

Key Insights
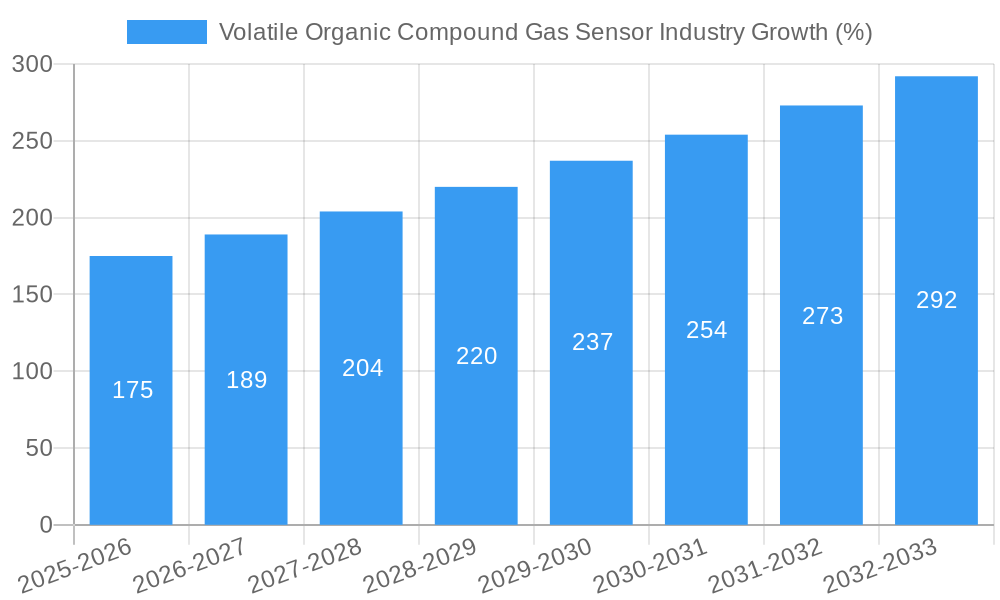
The Volatile Organic Compound (VOC) Gas Sensor market is experiencing robust growth, driven by stringent environmental regulations, increasing industrial automation, and a rising demand for enhanced safety and health monitoring across various sectors. The market, valued at approximately $2.5 billion in 2025, is projected to exhibit a Compound Annual Growth Rate (CAGR) exceeding 7% through 2033. This growth is fueled by several key factors. Firstly, the expanding industrial sector, particularly in manufacturing and petrochemicals, necessitates precise VOC detection for process optimization and emission control. Secondly, the growing awareness of indoor air quality (IAQ) is boosting demand for VOC sensors in residential and commercial applications, particularly in smart homes and buildings. Furthermore, advancements in sensor technology, such as the development of more sensitive, selective, and cost-effective sensors, are contributing to market expansion. Finally, government initiatives promoting environmental sustainability and worker safety are creating a favorable regulatory environment for VOC sensor adoption.
The market segmentation reveals a diverse landscape. Combustible gas sensors currently dominate the product type segment, reflecting the prevalent need for fire safety and hazard detection. However, non-combustible gas sensors are witnessing significant growth due to their increasing applications in environmental monitoring and healthcare. The industrial sector is the largest end-use segment, followed by commercial and residential applications. Geographically, North America and Europe currently hold substantial market shares, driven by mature economies and established regulatory frameworks. However, the Asia-Pacific region is expected to emerge as a key growth driver in the coming years, fueled by rapid industrialization and increasing investments in infrastructure development. Key players in the market, such as ABB Ltd, Alphasense, and SGX Sensortech Limited, are focusing on innovation and strategic partnerships to maintain a competitive edge. The continued emphasis on sustainability, safety, and technological advancements will further propel the growth of this dynamic market throughout the forecast period.
This comprehensive report provides an in-depth analysis of the Volatile Organic Compound (VOC) Gas Sensor industry, offering valuable insights for stakeholders seeking to navigate this dynamic market. Covering the period from 2019 to 2033, with a focus on 2025, this report delivers a detailed understanding of market trends, competitive landscapes, and future growth opportunities. The global VOC gas sensor market size was valued at xx Million in 2024 and is projected to reach xx Million by 2033, exhibiting a CAGR of xx% during the forecast period (2025-2033).

Volatile Organic Compound Gas Sensor Industry Market Composition & Trends
This section analyzes the VOC gas sensor market's structure, exploring key trends shaping its evolution. We examine market concentration, revealing the market share distribution among leading players such as ABB Ltd, MicroJet Technology Co Ltd, Aeroqual Limited, EcoSensors, Renesas Electronics Corporation, Alphasense, SGX Sensortech Limited, GfG Europe Ltd, and Ion Science Ltd. The report quantifies the level of market consolidation, identifying any dominant players and analyzing their strategies. Innovation is a key driver, with advancements in sensor technology pushing the market forward. We detail these advancements and their impact on market growth. The regulatory landscape plays a significant role, with evolving emission standards and safety regulations influencing demand. The report assesses the impact of these regulations on market dynamics. Substitute products and their competitive threat are also assessed. Finally, we examine recent mergers and acquisitions (M&A) activities within the industry, providing insights into deal values and their implications for market structure. We analyze the end-user profiles, detailing the major application segments for these sensors and how these segments are impacting industry growth.
- Market Concentration: xx% of the market is controlled by the top 5 players in 2025.
- M&A Activity: Total deal value in the last 5 years exceeded xx Million.
- Key Innovation Catalysts: Miniaturization, improved sensitivity, and wireless connectivity.
- Regulatory Landscape: Stringent environmental regulations driving demand in specific regions.
Volatile Organic Compound Gas Sensor Industry Industry Evolution
This section delves into the historical and projected growth trajectories of the VOC gas sensor market. We analyze the factors contributing to market expansion, including technological advancements that enhance sensor performance, reliability, and cost-effectiveness. The report examines shifting consumer demands for more accurate, efficient, and environmentally friendly sensing solutions. We present detailed data points illustrating growth rates, adoption metrics, and market penetration across various segments. The evolution of specific sensor types, such as combustible, non-combustible, and specific gas sensors, are discussed and analyzed. The impact of emerging technologies, like the Internet of Things (IoT), on the industry is thoroughly investigated. We further examine the changing landscape of the industry, its challenges and how it is adapting and evolving to meet changing demands and technological advancement.
Leading Regions, Countries, or Segments in Volatile Organic Compound Gas Sensor Industry
This section identifies the leading geographical regions, countries, and product/end-use segments within the VOC gas sensor market. We analyze the factors contributing to the dominance of specific regions, considering aspects such as economic development, regulatory support, and investment trends. The dominance of specific product types (Combustible Gas Sensors, Non-Combustible Gas Sensors, Specific Gas Sensors) and end-use sectors (Industrial, Commercial, Residential) is investigated. The study highlights the key market drivers behind the growth of different regions and segments.
- Dominant Region: North America, driven by stringent environmental regulations and robust industrial activity.
- Key Drivers (Industrial Segment): High demand for process monitoring and safety systems.
- Key Drivers (North America): Strong government initiatives to reduce emissions and improve air quality.
- Key Drivers (Specific Gas Sensors): Growing need for precise detection of specific VOCs in various applications.
Volatile Organic Compound Gas Sensor Industry Product Innovations
Recent innovations in VOC gas sensors include advancements in sensor materials, miniaturization techniques, and improved signal processing capabilities. These innovations result in higher sensitivity, faster response times, and enhanced accuracy. The development of wireless connectivity and integration with IoT platforms are also major advancements, leading to remote monitoring and data analytics capabilities. These improvements are driving wider adoption across various applications, providing unique selling propositions and expanding market reach.
Propelling Factors for Volatile Organic Compound Gas Sensor Industry Growth
Several factors are driving the growth of the VOC gas sensor market. Technological advancements lead to more sensitive, reliable, and cost-effective sensors. Stringent environmental regulations and increasing awareness of air quality issues are boosting demand. Growing industrialization and urbanization, particularly in developing economies, are increasing the need for VOC monitoring. Furthermore, the integration of VOC sensors into IoT applications is expanding market opportunities. Government investments in environmental monitoring infrastructure are providing further impetus for market growth.
Obstacles in the Volatile Organic Compound Gas Sensor Industry Market
The VOC gas sensor market faces certain challenges. High initial costs of implementing sensor systems can be a barrier to entry, particularly for smaller companies or individuals. Supply chain disruptions and the availability of raw materials can impact production and pricing. Intense competition from established players and new entrants creates pricing pressures. Strict regulatory compliance requirements can add to operational costs and complexity.
Future Opportunities in Volatile Organic Compound Gas Sensor Industry
Future opportunities lie in the development of more sophisticated and miniaturized sensors, particularly those with improved selectivity and sensitivity. Expansion into new application areas, such as personal air quality monitoring, is expected to drive growth. Integration with emerging technologies, such as artificial intelligence (AI) and machine learning (ML), will enhance sensor data analytics and predictive capabilities. Growth in the IoT market will present increased opportunities for data transmission and remote monitoring applications.
Major Players in the Volatile Organic Compound Gas Sensor Industry Ecosystem
- ABB Ltd
- MicroJet Technology Co Ltd
- Aeroqual Limited
- EcoSensors
- Renesas Electronics Corporation
- Alphasense
- SGX Sensortech Limited
- GfG Europe Ltd
- Ion Science Ltd
Key Developments in Volatile Organic Compound Gas Sensor Industry Industry
- 2023-Q4: Alphasense launched a new range of miniaturized VOC sensors.
- 2022-Q3: ABB Ltd acquired a smaller sensor technology company, expanding its product portfolio.
- 2021-Q2: New environmental regulations were introduced in the EU, boosting demand for VOC sensors. (Further details would be included in the full report).
Strategic Volatile Organic Compound Gas Sensor Industry Market Forecast
The VOC gas sensor market is poised for robust growth, driven by technological advancements, increasing environmental concerns, and expanding applications across diverse sectors. The market is expected to witness significant expansion in the coming years, particularly in developing economies. Continued innovation and the integration of new technologies will create further opportunities, shaping the future of this dynamic market. Government initiatives and investments in sustainable technologies will also play a pivotal role in driving future growth.
Volatile Organic Compound Gas Sensor Industry Segmentation
-
1. Product Type
- 1.1. Combustible Gas Sensors
- 1.2. Non-Combustible Gas Sensors
- 1.3. Specific Gas Sensors
-
2. End-Use
- 2.1. Industrial
- 2.2. Commercial
- 2.3. Residential
Volatile Organic Compound Gas Sensor Industry Segmentation By Geography
- 1. North America
- 2. Europe
- 3. Asia
- 4. Australia and New Zealand
- 5. Latin America
- 6. Middle East and Africa

Volatile Organic Compound Gas Sensor Industry REPORT HIGHLIGHTS
| Aspects | Details |
|---|---|
| Study Period | 2019-2033 |
| Base Year | 2024 |
| Estimated Year | 2025 |
| Forecast Period | 2025-2033 |
| Historical Period | 2019-2024 |
| Growth Rate | CAGR of > 7.00% from 2019-2033 |
| Segmentation |
|
Table of Contents
- 1. Introduction
- 1.1. Research Scope
- 1.2. Market Segmentation
- 1.3. Research Methodology
- 1.4. Definitions and Assumptions
- 2. Executive Summary
- 2.1. Introduction
- 3. Market Dynamics
- 3.1. Introduction
- 3.2. Market Drivers
- 3.2.1. ; Stringent Government Regulations to Control VOC Emissions; Increasing Use of Wireless and Smart Sensing Technology
- 3.3. Market Restrains
- 3.3.1. ; Interopereability Issues
- 3.4. Market Trends
- 3.4.1. Oil & Gas Industry to Drive the Market Growth
- 4. Market Factor Analysis
- 4.1. Porters Five Forces
- 4.2. Supply/Value Chain
- 4.3. PESTEL analysis
- 4.4. Market Entropy
- 4.5. Patent/Trademark Analysis
- 5. Global Volatile Organic Compound Gas Sensor Industry Analysis, Insights and Forecast, 2019-2031
- 5.1. Market Analysis, Insights and Forecast - by Product Type
- 5.1.1. Combustible Gas Sensors
- 5.1.2. Non-Combustible Gas Sensors
- 5.1.3. Specific Gas Sensors
- 5.2. Market Analysis, Insights and Forecast - by End-Use
- 5.2.1. Industrial
- 5.2.2. Commercial
- 5.2.3. Residential
- 5.3. Market Analysis, Insights and Forecast - by Region
- 5.3.1. North America
- 5.3.2. Europe
- 5.3.3. Asia
- 5.3.4. Australia and New Zealand
- 5.3.5. Latin America
- 5.3.6. Middle East and Africa
- 5.1. Market Analysis, Insights and Forecast - by Product Type
- 6. North America Volatile Organic Compound Gas Sensor Industry Analysis, Insights and Forecast, 2019-2031
- 6.1. Market Analysis, Insights and Forecast - by Product Type
- 6.1.1. Combustible Gas Sensors
- 6.1.2. Non-Combustible Gas Sensors
- 6.1.3. Specific Gas Sensors
- 6.2. Market Analysis, Insights and Forecast - by End-Use
- 6.2.1. Industrial
- 6.2.2. Commercial
- 6.2.3. Residential
- 6.1. Market Analysis, Insights and Forecast - by Product Type
- 7. Europe Volatile Organic Compound Gas Sensor Industry Analysis, Insights and Forecast, 2019-2031
- 7.1. Market Analysis, Insights and Forecast - by Product Type
- 7.1.1. Combustible Gas Sensors
- 7.1.2. Non-Combustible Gas Sensors
- 7.1.3. Specific Gas Sensors
- 7.2. Market Analysis, Insights and Forecast - by End-Use
- 7.2.1. Industrial
- 7.2.2. Commercial
- 7.2.3. Residential
- 7.1. Market Analysis, Insights and Forecast - by Product Type
- 8. Asia Volatile Organic Compound Gas Sensor Industry Analysis, Insights and Forecast, 2019-2031
- 8.1. Market Analysis, Insights and Forecast - by Product Type
- 8.1.1. Combustible Gas Sensors
- 8.1.2. Non-Combustible Gas Sensors
- 8.1.3. Specific Gas Sensors
- 8.2. Market Analysis, Insights and Forecast - by End-Use
- 8.2.1. Industrial
- 8.2.2. Commercial
- 8.2.3. Residential
- 8.1. Market Analysis, Insights and Forecast - by Product Type
- 9. Australia and New Zealand Volatile Organic Compound Gas Sensor Industry Analysis, Insights and Forecast, 2019-2031
- 9.1. Market Analysis, Insights and Forecast - by Product Type
- 9.1.1. Combustible Gas Sensors
- 9.1.2. Non-Combustible Gas Sensors
- 9.1.3. Specific Gas Sensors
- 9.2. Market Analysis, Insights and Forecast - by End-Use
- 9.2.1. Industrial
- 9.2.2. Commercial
- 9.2.3. Residential
- 9.1. Market Analysis, Insights and Forecast - by Product Type
- 10. Latin America Volatile Organic Compound Gas Sensor Industry Analysis, Insights and Forecast, 2019-2031
- 10.1. Market Analysis, Insights and Forecast - by Product Type
- 10.1.1. Combustible Gas Sensors
- 10.1.2. Non-Combustible Gas Sensors
- 10.1.3. Specific Gas Sensors
- 10.2. Market Analysis, Insights and Forecast - by End-Use
- 10.2.1. Industrial
- 10.2.2. Commercial
- 10.2.3. Residential
- 10.1. Market Analysis, Insights and Forecast - by Product Type
- 11. Middle East and Africa Volatile Organic Compound Gas Sensor Industry Analysis, Insights and Forecast, 2019-2031
- 11.1. Market Analysis, Insights and Forecast - by Product Type
- 11.1.1. Combustible Gas Sensors
- 11.1.2. Non-Combustible Gas Sensors
- 11.1.3. Specific Gas Sensors
- 11.2. Market Analysis, Insights and Forecast - by End-Use
- 11.2.1. Industrial
- 11.2.2. Commercial
- 11.2.3. Residential
- 11.1. Market Analysis, Insights and Forecast - by Product Type
- 12. North America Volatile Organic Compound Gas Sensor Industry Analysis, Insights and Forecast, 2019-2031
- 12.1. Market Analysis, Insights and Forecast - By Country/Sub-region
- 12.1.1 United States
- 12.1.2 Canada
- 12.1.3 Mexico
- 13. Europe Volatile Organic Compound Gas Sensor Industry Analysis, Insights and Forecast, 2019-2031
- 13.1. Market Analysis, Insights and Forecast - By Country/Sub-region
- 13.1.1 Germany
- 13.1.2 United Kingdom
- 13.1.3 France
- 13.1.4 Spain
- 13.1.5 Italy
- 13.1.6 Spain
- 13.1.7 Belgium
- 13.1.8 Netherland
- 13.1.9 Nordics
- 13.1.10 Rest of Europe
- 14. Asia Pacific Volatile Organic Compound Gas Sensor Industry Analysis, Insights and Forecast, 2019-2031
- 14.1. Market Analysis, Insights and Forecast - By Country/Sub-region
- 14.1.1 China
- 14.1.2 Japan
- 14.1.3 India
- 14.1.4 South Korea
- 14.1.5 Southeast Asia
- 14.1.6 Australia
- 14.1.7 Indonesia
- 14.1.8 Phillipes
- 14.1.9 Singapore
- 14.1.10 Thailandc
- 14.1.11 Rest of Asia Pacific
- 15. South America Volatile Organic Compound Gas Sensor Industry Analysis, Insights and Forecast, 2019-2031
- 15.1. Market Analysis, Insights and Forecast - By Country/Sub-region
- 15.1.1 Brazil
- 15.1.2 Argentina
- 15.1.3 Peru
- 15.1.4 Chile
- 15.1.5 Colombia
- 15.1.6 Ecuador
- 15.1.7 Venezuela
- 15.1.8 Rest of South America
- 16. MEA Volatile Organic Compound Gas Sensor Industry Analysis, Insights and Forecast, 2019-2031
- 16.1. Market Analysis, Insights and Forecast - By Country/Sub-region
- 16.1.1 United Arab Emirates
- 16.1.2 Saudi Arabia
- 16.1.3 South Africa
- 16.1.4 Rest of Middle East and Africa
- 17. Competitive Analysis
- 17.1. Global Market Share Analysis 2024
- 17.2. Company Profiles
- 17.2.1 ABB Ltd
- 17.2.1.1. Overview
- 17.2.1.2. Products
- 17.2.1.3. SWOT Analysis
- 17.2.1.4. Recent Developments
- 17.2.1.5. Financials (Based on Availability)
- 17.2.2 MicroJet Technology Co Ltd
- 17.2.2.1. Overview
- 17.2.2.2. Products
- 17.2.2.3. SWOT Analysis
- 17.2.2.4. Recent Developments
- 17.2.2.5. Financials (Based on Availability)
- 17.2.3 Aeroqual Limited
- 17.2.3.1. Overview
- 17.2.3.2. Products
- 17.2.3.3. SWOT Analysis
- 17.2.3.4. Recent Developments
- 17.2.3.5. Financials (Based on Availability)
- 17.2.4 EcoSensors
- 17.2.4.1. Overview
- 17.2.4.2. Products
- 17.2.4.3. SWOT Analysis
- 17.2.4.4. Recent Developments
- 17.2.4.5. Financials (Based on Availability)
- 17.2.5 Renesas Electronics Corporation
- 17.2.5.1. Overview
- 17.2.5.2. Products
- 17.2.5.3. SWOT Analysis
- 17.2.5.4. Recent Developments
- 17.2.5.5. Financials (Based on Availability)
- 17.2.6 Alphasense
- 17.2.6.1. Overview
- 17.2.6.2. Products
- 17.2.6.3. SWOT Analysis
- 17.2.6.4. Recent Developments
- 17.2.6.5. Financials (Based on Availability)
- 17.2.7 SGX Sensortech Limited
- 17.2.7.1. Overview
- 17.2.7.2. Products
- 17.2.7.3. SWOT Analysis
- 17.2.7.4. Recent Developments
- 17.2.7.5. Financials (Based on Availability)
- 17.2.8 GfG Europe Ltd
- 17.2.8.1. Overview
- 17.2.8.2. Products
- 17.2.8.3. SWOT Analysis
- 17.2.8.4. Recent Developments
- 17.2.8.5. Financials (Based on Availability)
- 17.2.9 Ion Science Ltd
- 17.2.9.1. Overview
- 17.2.9.2. Products
- 17.2.9.3. SWOT Analysis
- 17.2.9.4. Recent Developments
- 17.2.9.5. Financials (Based on Availability)
- 17.2.1 ABB Ltd
List of Figures
- Figure 1: Global Volatile Organic Compound Gas Sensor Industry Revenue Breakdown (Million, %) by Region 2024 & 2032
- Figure 2: North America Volatile Organic Compound Gas Sensor Industry Revenue (Million), by Country 2024 & 2032
- Figure 3: North America Volatile Organic Compound Gas Sensor Industry Revenue Share (%), by Country 2024 & 2032
- Figure 4: Europe Volatile Organic Compound Gas Sensor Industry Revenue (Million), by Country 2024 & 2032
- Figure 5: Europe Volatile Organic Compound Gas Sensor Industry Revenue Share (%), by Country 2024 & 2032
- Figure 6: Asia Pacific Volatile Organic Compound Gas Sensor Industry Revenue (Million), by Country 2024 & 2032
- Figure 7: Asia Pacific Volatile Organic Compound Gas Sensor Industry Revenue Share (%), by Country 2024 & 2032
- Figure 8: South America Volatile Organic Compound Gas Sensor Industry Revenue (Million), by Country 2024 & 2032
- Figure 9: South America Volatile Organic Compound Gas Sensor Industry Revenue Share (%), by Country 2024 & 2032
- Figure 10: MEA Volatile Organic Compound Gas Sensor Industry Revenue (Million), by Country 2024 & 2032
- Figure 11: MEA Volatile Organic Compound Gas Sensor Industry Revenue Share (%), by Country 2024 & 2032
- Figure 12: North America Volatile Organic Compound Gas Sensor Industry Revenue (Million), by Product Type 2024 & 2032
- Figure 13: North America Volatile Organic Compound Gas Sensor Industry Revenue Share (%), by Product Type 2024 & 2032
- Figure 14: North America Volatile Organic Compound Gas Sensor Industry Revenue (Million), by End-Use 2024 & 2032
- Figure 15: North America Volatile Organic Compound Gas Sensor Industry Revenue Share (%), by End-Use 2024 & 2032
- Figure 16: North America Volatile Organic Compound Gas Sensor Industry Revenue (Million), by Country 2024 & 2032
- Figure 17: North America Volatile Organic Compound Gas Sensor Industry Revenue Share (%), by Country 2024 & 2032
- Figure 18: Europe Volatile Organic Compound Gas Sensor Industry Revenue (Million), by Product Type 2024 & 2032
- Figure 19: Europe Volatile Organic Compound Gas Sensor Industry Revenue Share (%), by Product Type 2024 & 2032
- Figure 20: Europe Volatile Organic Compound Gas Sensor Industry Revenue (Million), by End-Use 2024 & 2032
- Figure 21: Europe Volatile Organic Compound Gas Sensor Industry Revenue Share (%), by End-Use 2024 & 2032
- Figure 22: Europe Volatile Organic Compound Gas Sensor Industry Revenue (Million), by Country 2024 & 2032
- Figure 23: Europe Volatile Organic Compound Gas Sensor Industry Revenue Share (%), by Country 2024 & 2032
- Figure 24: Asia Volatile Organic Compound Gas Sensor Industry Revenue (Million), by Product Type 2024 & 2032
- Figure 25: Asia Volatile Organic Compound Gas Sensor Industry Revenue Share (%), by Product Type 2024 & 2032
- Figure 26: Asia Volatile Organic Compound Gas Sensor Industry Revenue (Million), by End-Use 2024 & 2032
- Figure 27: Asia Volatile Organic Compound Gas Sensor Industry Revenue Share (%), by End-Use 2024 & 2032
- Figure 28: Asia Volatile Organic Compound Gas Sensor Industry Revenue (Million), by Country 2024 & 2032
- Figure 29: Asia Volatile Organic Compound Gas Sensor Industry Revenue Share (%), by Country 2024 & 2032
- Figure 30: Australia and New Zealand Volatile Organic Compound Gas Sensor Industry Revenue (Million), by Product Type 2024 & 2032
- Figure 31: Australia and New Zealand Volatile Organic Compound Gas Sensor Industry Revenue Share (%), by Product Type 2024 & 2032
- Figure 32: Australia and New Zealand Volatile Organic Compound Gas Sensor Industry Revenue (Million), by End-Use 2024 & 2032
- Figure 33: Australia and New Zealand Volatile Organic Compound Gas Sensor Industry Revenue Share (%), by End-Use 2024 & 2032
- Figure 34: Australia and New Zealand Volatile Organic Compound Gas Sensor Industry Revenue (Million), by Country 2024 & 2032
- Figure 35: Australia and New Zealand Volatile Organic Compound Gas Sensor Industry Revenue Share (%), by Country 2024 & 2032
- Figure 36: Latin America Volatile Organic Compound Gas Sensor Industry Revenue (Million), by Product Type 2024 & 2032
- Figure 37: Latin America Volatile Organic Compound Gas Sensor Industry Revenue Share (%), by Product Type 2024 & 2032
- Figure 38: Latin America Volatile Organic Compound Gas Sensor Industry Revenue (Million), by End-Use 2024 & 2032
- Figure 39: Latin America Volatile Organic Compound Gas Sensor Industry Revenue Share (%), by End-Use 2024 & 2032
- Figure 40: Latin America Volatile Organic Compound Gas Sensor Industry Revenue (Million), by Country 2024 & 2032
- Figure 41: Latin America Volatile Organic Compound Gas Sensor Industry Revenue Share (%), by Country 2024 & 2032
- Figure 42: Middle East and Africa Volatile Organic Compound Gas Sensor Industry Revenue (Million), by Product Type 2024 & 2032
- Figure 43: Middle East and Africa Volatile Organic Compound Gas Sensor Industry Revenue Share (%), by Product Type 2024 & 2032
- Figure 44: Middle East and Africa Volatile Organic Compound Gas Sensor Industry Revenue (Million), by End-Use 2024 & 2032
- Figure 45: Middle East and Africa Volatile Organic Compound Gas Sensor Industry Revenue Share (%), by End-Use 2024 & 2032
- Figure 46: Middle East and Africa Volatile Organic Compound Gas Sensor Industry Revenue (Million), by Country 2024 & 2032
- Figure 47: Middle East and Africa Volatile Organic Compound Gas Sensor Industry Revenue Share (%), by Country 2024 & 2032
List of Tables
- Table 1: Global Volatile Organic Compound Gas Sensor Industry Revenue Million Forecast, by Region 2019 & 2032
- Table 2: Global Volatile Organic Compound Gas Sensor Industry Revenue Million Forecast, by Product Type 2019 & 2032
- Table 3: Global Volatile Organic Compound Gas Sensor Industry Revenue Million Forecast, by End-Use 2019 & 2032
- Table 4: Global Volatile Organic Compound Gas Sensor Industry Revenue Million Forecast, by Region 2019 & 2032
- Table 5: Global Volatile Organic Compound Gas Sensor Industry Revenue Million Forecast, by Country 2019 & 2032
- Table 6: United States Volatile Organic Compound Gas Sensor Industry Revenue (Million) Forecast, by Application 2019 & 2032
- Table 7: Canada Volatile Organic Compound Gas Sensor Industry Revenue (Million) Forecast, by Application 2019 & 2032
- Table 8: Mexico Volatile Organic Compound Gas Sensor Industry Revenue (Million) Forecast, by Application 2019 & 2032
- Table 9: Global Volatile Organic Compound Gas Sensor Industry Revenue Million Forecast, by Country 2019 & 2032
- Table 10: Germany Volatile Organic Compound Gas Sensor Industry Revenue (Million) Forecast, by Application 2019 & 2032
- Table 11: United Kingdom Volatile Organic Compound Gas Sensor Industry Revenue (Million) Forecast, by Application 2019 & 2032
- Table 12: France Volatile Organic Compound Gas Sensor Industry Revenue (Million) Forecast, by Application 2019 & 2032
- Table 13: Spain Volatile Organic Compound Gas Sensor Industry Revenue (Million) Forecast, by Application 2019 & 2032
- Table 14: Italy Volatile Organic Compound Gas Sensor Industry Revenue (Million) Forecast, by Application 2019 & 2032
- Table 15: Spain Volatile Organic Compound Gas Sensor Industry Revenue (Million) Forecast, by Application 2019 & 2032
- Table 16: Belgium Volatile Organic Compound Gas Sensor Industry Revenue (Million) Forecast, by Application 2019 & 2032
- Table 17: Netherland Volatile Organic Compound Gas Sensor Industry Revenue (Million) Forecast, by Application 2019 & 2032
- Table 18: Nordics Volatile Organic Compound Gas Sensor Industry Revenue (Million) Forecast, by Application 2019 & 2032
- Table 19: Rest of Europe Volatile Organic Compound Gas Sensor Industry Revenue (Million) Forecast, by Application 2019 & 2032
- Table 20: Global Volatile Organic Compound Gas Sensor Industry Revenue Million Forecast, by Country 2019 & 2032
- Table 21: China Volatile Organic Compound Gas Sensor Industry Revenue (Million) Forecast, by Application 2019 & 2032
- Table 22: Japan Volatile Organic Compound Gas Sensor Industry Revenue (Million) Forecast, by Application 2019 & 2032
- Table 23: India Volatile Organic Compound Gas Sensor Industry Revenue (Million) Forecast, by Application 2019 & 2032
- Table 24: South Korea Volatile Organic Compound Gas Sensor Industry Revenue (Million) Forecast, by Application 2019 & 2032
- Table 25: Southeast Asia Volatile Organic Compound Gas Sensor Industry Revenue (Million) Forecast, by Application 2019 & 2032
- Table 26: Australia Volatile Organic Compound Gas Sensor Industry Revenue (Million) Forecast, by Application 2019 & 2032
- Table 27: Indonesia Volatile Organic Compound Gas Sensor Industry Revenue (Million) Forecast, by Application 2019 & 2032
- Table 28: Phillipes Volatile Organic Compound Gas Sensor Industry Revenue (Million) Forecast, by Application 2019 & 2032
- Table 29: Singapore Volatile Organic Compound Gas Sensor Industry Revenue (Million) Forecast, by Application 2019 & 2032
- Table 30: Thailandc Volatile Organic Compound Gas Sensor Industry Revenue (Million) Forecast, by Application 2019 & 2032
- Table 31: Rest of Asia Pacific Volatile Organic Compound Gas Sensor Industry Revenue (Million) Forecast, by Application 2019 & 2032
- Table 32: Global Volatile Organic Compound Gas Sensor Industry Revenue Million Forecast, by Country 2019 & 2032
- Table 33: Brazil Volatile Organic Compound Gas Sensor Industry Revenue (Million) Forecast, by Application 2019 & 2032
- Table 34: Argentina Volatile Organic Compound Gas Sensor Industry Revenue (Million) Forecast, by Application 2019 & 2032
- Table 35: Peru Volatile Organic Compound Gas Sensor Industry Revenue (Million) Forecast, by Application 2019 & 2032
- Table 36: Chile Volatile Organic Compound Gas Sensor Industry Revenue (Million) Forecast, by Application 2019 & 2032
- Table 37: Colombia Volatile Organic Compound Gas Sensor Industry Revenue (Million) Forecast, by Application 2019 & 2032
- Table 38: Ecuador Volatile Organic Compound Gas Sensor Industry Revenue (Million) Forecast, by Application 2019 & 2032
- Table 39: Venezuela Volatile Organic Compound Gas Sensor Industry Revenue (Million) Forecast, by Application 2019 & 2032
- Table 40: Rest of South America Volatile Organic Compound Gas Sensor Industry Revenue (Million) Forecast, by Application 2019 & 2032
- Table 41: Global Volatile Organic Compound Gas Sensor Industry Revenue Million Forecast, by Country 2019 & 2032
- Table 42: United Arab Emirates Volatile Organic Compound Gas Sensor Industry Revenue (Million) Forecast, by Application 2019 & 2032
- Table 43: Saudi Arabia Volatile Organic Compound Gas Sensor Industry Revenue (Million) Forecast, by Application 2019 & 2032
- Table 44: South Africa Volatile Organic Compound Gas Sensor Industry Revenue (Million) Forecast, by Application 2019 & 2032
- Table 45: Rest of Middle East and Africa Volatile Organic Compound Gas Sensor Industry Revenue (Million) Forecast, by Application 2019 & 2032
- Table 46: Global Volatile Organic Compound Gas Sensor Industry Revenue Million Forecast, by Product Type 2019 & 2032
- Table 47: Global Volatile Organic Compound Gas Sensor Industry Revenue Million Forecast, by End-Use 2019 & 2032
- Table 48: Global Volatile Organic Compound Gas Sensor Industry Revenue Million Forecast, by Country 2019 & 2032
- Table 49: Global Volatile Organic Compound Gas Sensor Industry Revenue Million Forecast, by Product Type 2019 & 2032
- Table 50: Global Volatile Organic Compound Gas Sensor Industry Revenue Million Forecast, by End-Use 2019 & 2032
- Table 51: Global Volatile Organic Compound Gas Sensor Industry Revenue Million Forecast, by Country 2019 & 2032
- Table 52: Global Volatile Organic Compound Gas Sensor Industry Revenue Million Forecast, by Product Type 2019 & 2032
- Table 53: Global Volatile Organic Compound Gas Sensor Industry Revenue Million Forecast, by End-Use 2019 & 2032
- Table 54: Global Volatile Organic Compound Gas Sensor Industry Revenue Million Forecast, by Country 2019 & 2032
- Table 55: Global Volatile Organic Compound Gas Sensor Industry Revenue Million Forecast, by Product Type 2019 & 2032
- Table 56: Global Volatile Organic Compound Gas Sensor Industry Revenue Million Forecast, by End-Use 2019 & 2032
- Table 57: Global Volatile Organic Compound Gas Sensor Industry Revenue Million Forecast, by Country 2019 & 2032
- Table 58: Global Volatile Organic Compound Gas Sensor Industry Revenue Million Forecast, by Product Type 2019 & 2032
- Table 59: Global Volatile Organic Compound Gas Sensor Industry Revenue Million Forecast, by End-Use 2019 & 2032
- Table 60: Global Volatile Organic Compound Gas Sensor Industry Revenue Million Forecast, by Country 2019 & 2032
- Table 61: Global Volatile Organic Compound Gas Sensor Industry Revenue Million Forecast, by Product Type 2019 & 2032
- Table 62: Global Volatile Organic Compound Gas Sensor Industry Revenue Million Forecast, by End-Use 2019 & 2032
- Table 63: Global Volatile Organic Compound Gas Sensor Industry Revenue Million Forecast, by Country 2019 & 2032
Frequently Asked Questions
1. What is the projected Compound Annual Growth Rate (CAGR) of the Volatile Organic Compound Gas Sensor Industry?
The projected CAGR is approximately > 7.00%.
2. Which companies are prominent players in the Volatile Organic Compound Gas Sensor Industry?
Key companies in the market include ABB Ltd, MicroJet Technology Co Ltd, Aeroqual Limited, EcoSensors, Renesas Electronics Corporation, Alphasense, SGX Sensortech Limited, GfG Europe Ltd, Ion Science Ltd.
3. What are the main segments of the Volatile Organic Compound Gas Sensor Industry?
The market segments include Product Type , End-Use .
4. Can you provide details about the market size?
The market size is estimated to be USD XX Million as of 2022.
5. What are some drivers contributing to market growth?
; Stringent Government Regulations to Control VOC Emissions; Increasing Use of Wireless and Smart Sensing Technology.
6. What are the notable trends driving market growth?
Oil & Gas Industry to Drive the Market Growth.
7. Are there any restraints impacting market growth?
; Interopereability Issues.
8. Can you provide examples of recent developments in the market?
N/A
9. What pricing options are available for accessing the report?
Pricing options include single-user, multi-user, and enterprise licenses priced at USD 4750, USD 5250, and USD 8750 respectively.
10. Is the market size provided in terms of value or volume?
The market size is provided in terms of value, measured in Million.
11. Are there any specific market keywords associated with the report?
Yes, the market keyword associated with the report is "Volatile Organic Compound Gas Sensor Industry," which aids in identifying and referencing the specific market segment covered.
12. How do I determine which pricing option suits my needs best?
The pricing options vary based on user requirements and access needs. Individual users may opt for single-user licenses, while businesses requiring broader access may choose multi-user or enterprise licenses for cost-effective access to the report.
13. Are there any additional resources or data provided in the Volatile Organic Compound Gas Sensor Industry report?
While the report offers comprehensive insights, it's advisable to review the specific contents or supplementary materials provided to ascertain if additional resources or data are available.
14. How can I stay updated on further developments or reports in the Volatile Organic Compound Gas Sensor Industry?
To stay informed about further developments, trends, and reports in the Volatile Organic Compound Gas Sensor Industry, consider subscribing to industry newsletters, following relevant companies and organizations, or regularly checking reputable industry news sources and publications.
Methodology
Step 1 - Identification of Relevant Samples Size from Population Database


Step 2 - Approaches for Defining Global Market Size (Value, Volume* & Price*)

Note*: In applicable scenarios
Step 3 - Data Sources
Primary Research
- Web Analytics
- Survey Reports
- Research Institute
- Latest Research Reports
- Opinion Leaders
Secondary Research
- Annual Reports
- White Paper
- Latest Press Release
- Industry Association
- Paid Database
- Investor Presentations

Step 4 - Data Triangulation
Involves using different sources of information in order to increase the validity of a study
These sources are likely to be stakeholders in a program - participants, other researchers, program staff, other community members, and so on.
Then we put all data in single framework & apply various statistical tools to find out the dynamic on the market.
During the analysis stage, feedback from the stakeholder groups would be compared to determine areas of agreement as well as areas of divergence
