

Key Insights
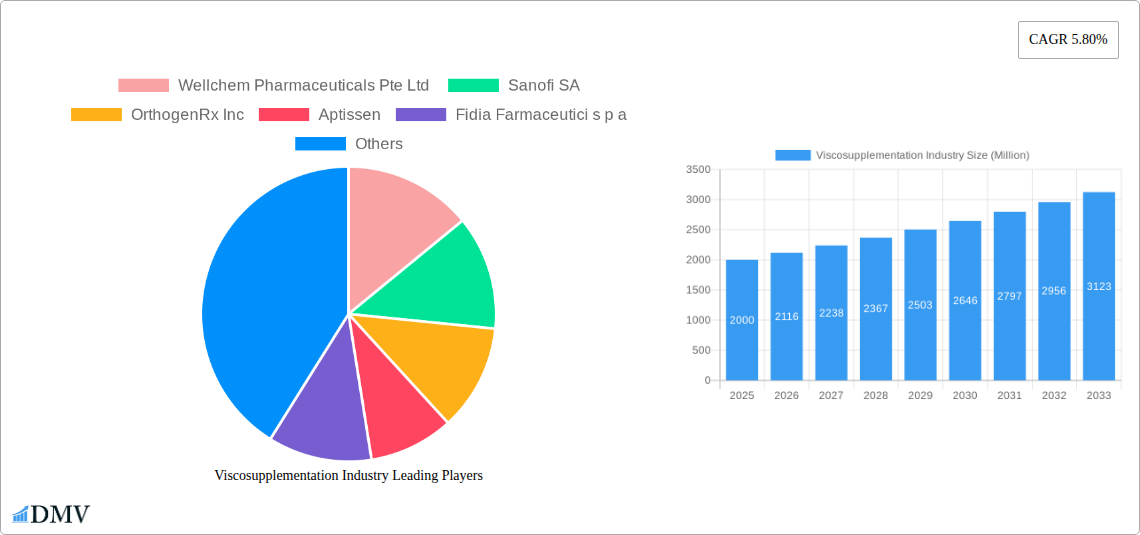
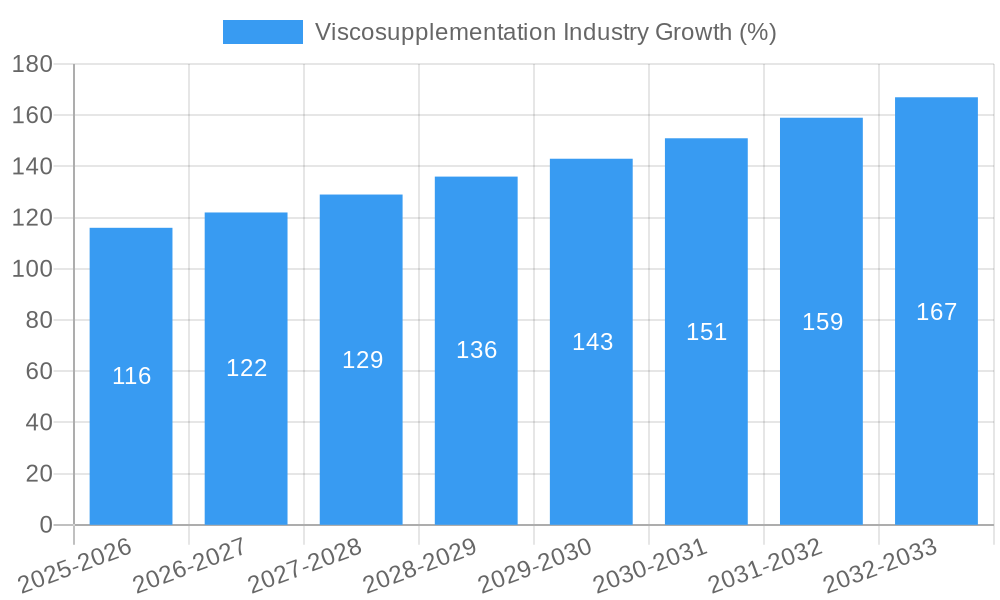
The viscosupplementation market, valued at approximately $XX million in 2025, is projected to experience robust growth, driven by a Compound Annual Growth Rate (CAGR) of 5.80% from 2025 to 2033. This expansion is fueled by several key factors. The aging global population, experiencing an increased prevalence of osteoarthritis (OA), a primary condition treated with viscosupplementation, is a major driver. Furthermore, advancements in viscosupplementation formulations, leading to improved efficacy and reduced side effects, are boosting market adoption. Increased awareness of less invasive treatment options for OA, coupled with rising healthcare expenditure in developed and developing nations, further contributes to market growth. The market segmentation shows a preference for single-injection dosages for convenience and cost-effectiveness, while hospitals and ambulatory surgical centers remain the dominant end-users. However, market growth may face some headwinds. The relatively high cost of viscosupplementation compared to other OA treatments and the availability of alternative therapies can limit market penetration, particularly in regions with limited healthcare access.
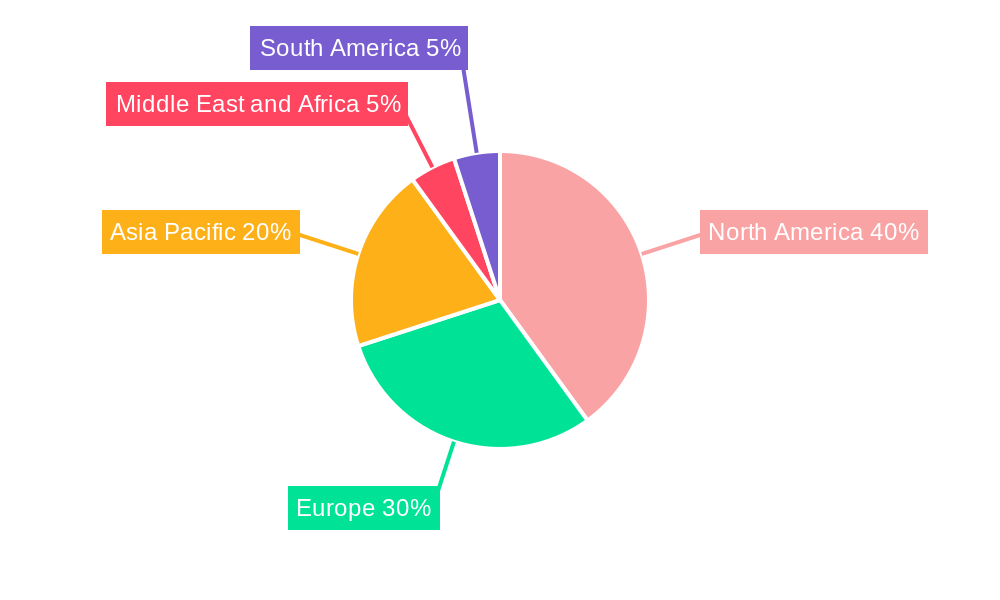
Competitive landscape analysis reveals a mix of established pharmaceutical giants like Sanofi and Johnson & Johnson, alongside specialized companies such as Anika Therapeutics and Bioventus. These companies are continuously investing in research and development to improve product efficacy and expand their product portfolios. Geographic analysis indicates that North America currently holds a significant market share due to high OA prevalence and advanced healthcare infrastructure. However, Asia Pacific is expected to witness substantial growth in the forecast period driven by increasing awareness, rising disposable incomes, and expanding healthcare access. The overall market trajectory indicates a promising future for viscosupplementation, with sustained growth anticipated throughout the forecast period, particularly in regions with a burgeoning aging population and increasing healthcare spending. However, manufacturers must strategically navigate pricing strategies and effectively communicate the benefits of viscosupplementation to ensure continued market penetration.
Viscosupplementation Industry Market Report: 2019-2033
This comprehensive report provides a detailed analysis of the global viscosupplementation industry, offering invaluable insights for stakeholders seeking to navigate this dynamic market. The study period spans 2019-2033, with a base year of 2025 and a forecast period of 2025-2033. We project a market valued at xx Million in 2025, poised for significant growth in the coming years. This in-depth analysis covers market composition, trends, leading players, and future opportunities.
Viscosupplementation Industry Market Composition & Trends
This section delves into the competitive landscape of the viscosupplementation market, evaluating market concentration, innovation drivers, regulatory frameworks, substitute products, and end-user dynamics. The analysis includes an assessment of mergers and acquisitions (M&A) activity, including deal values and their impact on market share distribution. We will examine the strategies employed by key players such as Sanofi SA, Johnson & Johnson Services Inc, and Zimmer Biomet, among others, to maintain their market position and expand their reach. The report quantifies market share amongst the top players, revealing the competitive intensity within the market. Furthermore, it analyzes the impact of regulatory changes on market growth and innovation, as well as the emergence of substitute products and their potential to disrupt the market.
- Market Concentration: Analysis of market share held by top 10 players, revealing industry competitiveness.
- Innovation Catalysts: Discussion of technological advancements driving product development and market expansion.
- Regulatory Landscape: Examination of key regulatory approvals and their impact on market access and product launches.
- Substitute Products: Assessment of competing therapies and their potential impact on market growth.
- End-User Profiles: Detailed analysis of end-user segments (Hospitals, Ambulatory Surgical Centers, Others) and their preferences.
- M&A Activities: Review of significant mergers and acquisitions, including deal values and their strategic implications. Estimated total M&A deal value for the period 2019-2024: xx Million.
Viscosupplementation Industry Evolution
This section provides a comprehensive overview of the viscosupplementation industry's historical and projected evolution. It analyzes market growth trajectories, technological advancements, and the evolving needs of patients and healthcare providers. The analysis includes specific data points, such as growth rates and adoption metrics, providing a clear picture of the industry's dynamic nature. We’ll examine how factors like the increasing prevalence of osteoarthritis and advancements in viscosupplementation technology are driving market growth and changing industry dynamics. The impact of shifting consumer preferences and emerging treatment modalities will also be considered. The report will showcase the evolution of viscosupplementation from single-injection to multi-injection therapies and analyze the adoption trends of different dosage forms.
Leading Regions, Countries, or Segments in Viscosupplementation Industry
This section identifies the leading regions, countries, and segments within the viscosupplementation market. It examines the factors contributing to the dominance of specific regions or segments, including investment trends, regulatory support, and healthcare infrastructure. A detailed analysis of the dosage segments (Single Injection, Three Injection, Five Injection) and end-user segments (Hospitals, Ambulatory Surgical Centers, Others) will highlight their relative market shares and growth prospects.
- Dominant Region/Country: [Name of region/country] due to [Reasons: e.g., high prevalence of osteoarthritis, favorable regulatory environment, strong healthcare infrastructure].
- Dosage Segment Analysis:
- Single Injection: Key drivers and market dynamics.
- Three Injection: Market size, growth rate, and influencing factors.
- Five Injection: Adoption trends, future potential, and challenges.
- End-User Segment Analysis:
- Hospitals: Market share, growth potential, and specific needs.
- Ambulatory Surgical Centers: Market share, growth trends, and unique characteristics.
- Others: Market size, growth drivers, and future outlook.
Viscosupplementation Industry Product Innovations
This section highlights recent product innovations in the viscosupplementation market, including novel formulations, delivery systems, and technological advancements. It will showcase unique selling propositions and improvements in product performance, focusing on how these innovations address unmet clinical needs and enhance patient outcomes. This includes an assessment of the impact of these innovations on market competition and adoption rates.
Propelling Factors for Viscosupplementation Industry Growth
This section identifies the key factors driving growth in the viscosupplementation market. This includes technological advancements, economic factors such as increasing disposable incomes and healthcare spending, and supportive regulatory environments that facilitate market access. Specific examples of these factors and their impact on market growth will be detailed.
Obstacles in the Viscosupplementation Industry Market
This section discusses the challenges and barriers hindering the growth of the viscosupplementation market. These may include regulatory hurdles, supply chain disruptions, intense competition, and pricing pressures. The report will quantify the impact of these factors, providing a realistic assessment of the market's limitations.
Future Opportunities in Viscosupplementation Industry
This section explores emerging opportunities in the viscosupplementation market. This includes the potential for expansion into new markets, the development of innovative products and technologies, and the adaptation to evolving consumer preferences and clinical needs.
Major Players in the Viscosupplementation Industry Ecosystem
- Wellchem Pharmaceuticals Pte Ltd
- Sanofi SA
- OrthogenRx Inc
- Aptissen
- Fidia Farmaceutici s p a
- Anika Therapeutics Inc
- Johnson & Johnson Services Inc
- Ferring Pharmaceuticals
- Bioventus LLC
- Seikagaku Corporation
- Chugai Pharmaceuticals Co Ltd (Roche)
- Zimmer Biomet
Key Developments in Viscosupplementation Industry Industry
- [Date]: [Description of development and its impact]
- [Date]: [Description of development and its impact]
- [Date]: [Description of development and its impact]
Strategic Viscosupplementation Industry Market Forecast
This section summarizes the key growth catalysts and presents a strategic forecast for the viscosupplementation market. The forecast considers the identified opportunities and challenges, providing a realistic assessment of the market's future potential and growth trajectory. This includes projections of market size and market share for key players.
Viscosupplementation Industry Segmentation
-
1. Dosage
- 1.1. Single Injection
- 1.2. Three Injection
- 1.3. Five Injection
-
2. End-User
- 2.1. Hospitals
- 2.2. Ambulatory Surgical Centers
- 2.3. Others
Viscosupplementation Industry Segmentation By Geography
-
1. North America
- 1.1. United States
- 1.2. Canada
- 1.3. Mexico
-
2. Europe
- 2.1. Germany
- 2.2. United Kingdom
- 2.3. France
- 2.4. Italy
- 2.5. Spain
- 2.6. Rest of Europe
-
3. Asia Pacific
- 3.1. China
- 3.2. Japan
- 3.3. India
- 3.4. Australia
- 3.5. South Korea
- 3.6. Rest of Asia Pacific
-
4. Middle East and Africa
- 4.1. GCC
- 4.2. South Africa
- 4.3. Rest of Middle East and Africa
-
5. South America
- 5.1. Brazil
- 5.2. Argentina
- 5.3. Rest of South America
Viscosupplementation Industry REPORT HIGHLIGHTS
| Aspects | Details |
|---|---|
| Study Period | 2019-2033 |
| Base Year | 2024 |
| Estimated Year | 2025 |
| Forecast Period | 2025-2033 |
| Historical Period | 2019-2024 |
| Growth Rate | CAGR of 5.80% from 2019-2033 |
| Segmentation |
|
Table of Contents
- 1. Introduction
- 1.1. Research Scope
- 1.2. Market Segmentation
- 1.3. Research Methodology
- 1.4. Definitions and Assumptions
- 2. Executive Summary
- 2.1. Introduction
- 3. Market Dynamics
- 3.1. Introduction
- 3.2. Market Drivers
- 3.2.1. Rising Patient Pool Suffering from Osteoarthritis; Introduction of Advanced and Combination Products
- 3.3. Market Restrains
- 3.3.1. Regulatory Issues and Lack of Awareness
- 3.4. Market Trends
- 3.4.1. Single Injection Segment Expects to Register a High CAGR in the Forecast Period
- 4. Market Factor Analysis
- 4.1. Porters Five Forces
- 4.2. Supply/Value Chain
- 4.3. PESTEL analysis
- 4.4. Market Entropy
- 4.5. Patent/Trademark Analysis
- 5. Global Viscosupplementation Industry Analysis, Insights and Forecast, 2019-2031
- 5.1. Market Analysis, Insights and Forecast - by Dosage
- 5.1.1. Single Injection
- 5.1.2. Three Injection
- 5.1.3. Five Injection
- 5.2. Market Analysis, Insights and Forecast - by End-User
- 5.2.1. Hospitals
- 5.2.2. Ambulatory Surgical Centers
- 5.2.3. Others
- 5.3. Market Analysis, Insights and Forecast - by Region
- 5.3.1. North America
- 5.3.2. Europe
- 5.3.3. Asia Pacific
- 5.3.4. Middle East and Africa
- 5.3.5. South America
- 5.1. Market Analysis, Insights and Forecast - by Dosage
- 6. North America Viscosupplementation Industry Analysis, Insights and Forecast, 2019-2031
- 6.1. Market Analysis, Insights and Forecast - by Dosage
- 6.1.1. Single Injection
- 6.1.2. Three Injection
- 6.1.3. Five Injection
- 6.2. Market Analysis, Insights and Forecast - by End-User
- 6.2.1. Hospitals
- 6.2.2. Ambulatory Surgical Centers
- 6.2.3. Others
- 6.1. Market Analysis, Insights and Forecast - by Dosage
- 7. Europe Viscosupplementation Industry Analysis, Insights and Forecast, 2019-2031
- 7.1. Market Analysis, Insights and Forecast - by Dosage
- 7.1.1. Single Injection
- 7.1.2. Three Injection
- 7.1.3. Five Injection
- 7.2. Market Analysis, Insights and Forecast - by End-User
- 7.2.1. Hospitals
- 7.2.2. Ambulatory Surgical Centers
- 7.2.3. Others
- 7.1. Market Analysis, Insights and Forecast - by Dosage
- 8. Asia Pacific Viscosupplementation Industry Analysis, Insights and Forecast, 2019-2031
- 8.1. Market Analysis, Insights and Forecast - by Dosage
- 8.1.1. Single Injection
- 8.1.2. Three Injection
- 8.1.3. Five Injection
- 8.2. Market Analysis, Insights and Forecast - by End-User
- 8.2.1. Hospitals
- 8.2.2. Ambulatory Surgical Centers
- 8.2.3. Others
- 8.1. Market Analysis, Insights and Forecast - by Dosage
- 9. Middle East and Africa Viscosupplementation Industry Analysis, Insights and Forecast, 2019-2031
- 9.1. Market Analysis, Insights and Forecast - by Dosage
- 9.1.1. Single Injection
- 9.1.2. Three Injection
- 9.1.3. Five Injection
- 9.2. Market Analysis, Insights and Forecast - by End-User
- 9.2.1. Hospitals
- 9.2.2. Ambulatory Surgical Centers
- 9.2.3. Others
- 9.1. Market Analysis, Insights and Forecast - by Dosage
- 10. South America Viscosupplementation Industry Analysis, Insights and Forecast, 2019-2031
- 10.1. Market Analysis, Insights and Forecast - by Dosage
- 10.1.1. Single Injection
- 10.1.2. Three Injection
- 10.1.3. Five Injection
- 10.2. Market Analysis, Insights and Forecast - by End-User
- 10.2.1. Hospitals
- 10.2.2. Ambulatory Surgical Centers
- 10.2.3. Others
- 10.1. Market Analysis, Insights and Forecast - by Dosage
- 11. North America Viscosupplementation Industry Analysis, Insights and Forecast, 2019-2031
- 11.1. Market Analysis, Insights and Forecast - By Country/Sub-region
- 11.1.1. undefined
- 12. Europe Viscosupplementation Industry Analysis, Insights and Forecast, 2019-2031
- 12.1. Market Analysis, Insights and Forecast - By Country/Sub-region
- 12.1.1. undefined
- 13. Asia Pacific Viscosupplementation Industry Analysis, Insights and Forecast, 2019-2031
- 13.1. Market Analysis, Insights and Forecast - By Country/Sub-region
- 13.1.1. undefined
- 14. Middle East and Africa Viscosupplementation Industry Analysis, Insights and Forecast, 2019-2031
- 14.1. Market Analysis, Insights and Forecast - By Country/Sub-region
- 14.1.1. undefined
- 15. South America Viscosupplementation Industry Analysis, Insights and Forecast, 2019-2031
- 15.1. Market Analysis, Insights and Forecast - By Country/Sub-region
- 15.1.1. undefined
- 16. Competitive Analysis
- 16.1. Global Market Share Analysis 2024
- 16.2. Company Profiles
- 16.2.1 Wellchem Pharmaceuticals Pte Ltd
- 16.2.1.1. Overview
- 16.2.1.2. Products
- 16.2.1.3. SWOT Analysis
- 16.2.1.4. Recent Developments
- 16.2.1.5. Financials (Based on Availability)
- 16.2.2 Sanofi SA
- 16.2.2.1. Overview
- 16.2.2.2. Products
- 16.2.2.3. SWOT Analysis
- 16.2.2.4. Recent Developments
- 16.2.2.5. Financials (Based on Availability)
- 16.2.3 OrthogenRx Inc
- 16.2.3.1. Overview
- 16.2.3.2. Products
- 16.2.3.3. SWOT Analysis
- 16.2.3.4. Recent Developments
- 16.2.3.5. Financials (Based on Availability)
- 16.2.4 Aptissen
- 16.2.4.1. Overview
- 16.2.4.2. Products
- 16.2.4.3. SWOT Analysis
- 16.2.4.4. Recent Developments
- 16.2.4.5. Financials (Based on Availability)
- 16.2.5 Fidia Farmaceutici s p a
- 16.2.5.1. Overview
- 16.2.5.2. Products
- 16.2.5.3. SWOT Analysis
- 16.2.5.4. Recent Developments
- 16.2.5.5. Financials (Based on Availability)
- 16.2.6 Anika Therapeutics Inc
- 16.2.6.1. Overview
- 16.2.6.2. Products
- 16.2.6.3. SWOT Analysis
- 16.2.6.4. Recent Developments
- 16.2.6.5. Financials (Based on Availability)
- 16.2.7 Johnson & Johnson Services Inc
- 16.2.7.1. Overview
- 16.2.7.2. Products
- 16.2.7.3. SWOT Analysis
- 16.2.7.4. Recent Developments
- 16.2.7.5. Financials (Based on Availability)
- 16.2.8 Ferring Pharmaceuticals
- 16.2.8.1. Overview
- 16.2.8.2. Products
- 16.2.8.3. SWOT Analysis
- 16.2.8.4. Recent Developments
- 16.2.8.5. Financials (Based on Availability)
- 16.2.9 Bioventus LLC
- 16.2.9.1. Overview
- 16.2.9.2. Products
- 16.2.9.3. SWOT Analysis
- 16.2.9.4. Recent Developments
- 16.2.9.5. Financials (Based on Availability)
- 16.2.10 Seikagaku Corporation
- 16.2.10.1. Overview
- 16.2.10.2. Products
- 16.2.10.3. SWOT Analysis
- 16.2.10.4. Recent Developments
- 16.2.10.5. Financials (Based on Availability)
- 16.2.11 Chugai Pharmaceuticals Co Ltd (Roche)
- 16.2.11.1. Overview
- 16.2.11.2. Products
- 16.2.11.3. SWOT Analysis
- 16.2.11.4. Recent Developments
- 16.2.11.5. Financials (Based on Availability)
- 16.2.12 Zimmer Biomet
- 16.2.12.1. Overview
- 16.2.12.2. Products
- 16.2.12.3. SWOT Analysis
- 16.2.12.4. Recent Developments
- 16.2.12.5. Financials (Based on Availability)
- 16.2.1 Wellchem Pharmaceuticals Pte Ltd
List of Figures
- Figure 1: Global Viscosupplementation Industry Revenue Breakdown (Million, %) by Region 2024 & 2032
- Figure 2: Global Viscosupplementation Industry Volume Breakdown (K Unit, %) by Region 2024 & 2032
- Figure 3: North America Viscosupplementation Industry Revenue (Million), by Country 2024 & 2032
- Figure 4: North America Viscosupplementation Industry Volume (K Unit), by Country 2024 & 2032
- Figure 5: North America Viscosupplementation Industry Revenue Share (%), by Country 2024 & 2032
- Figure 6: North America Viscosupplementation Industry Volume Share (%), by Country 2024 & 2032
- Figure 7: Europe Viscosupplementation Industry Revenue (Million), by Country 2024 & 2032
- Figure 8: Europe Viscosupplementation Industry Volume (K Unit), by Country 2024 & 2032
- Figure 9: Europe Viscosupplementation Industry Revenue Share (%), by Country 2024 & 2032
- Figure 10: Europe Viscosupplementation Industry Volume Share (%), by Country 2024 & 2032
- Figure 11: Asia Pacific Viscosupplementation Industry Revenue (Million), by Country 2024 & 2032
- Figure 12: Asia Pacific Viscosupplementation Industry Volume (K Unit), by Country 2024 & 2032
- Figure 13: Asia Pacific Viscosupplementation Industry Revenue Share (%), by Country 2024 & 2032
- Figure 14: Asia Pacific Viscosupplementation Industry Volume Share (%), by Country 2024 & 2032
- Figure 15: Middle East and Africa Viscosupplementation Industry Revenue (Million), by Country 2024 & 2032
- Figure 16: Middle East and Africa Viscosupplementation Industry Volume (K Unit), by Country 2024 & 2032
- Figure 17: Middle East and Africa Viscosupplementation Industry Revenue Share (%), by Country 2024 & 2032
- Figure 18: Middle East and Africa Viscosupplementation Industry Volume Share (%), by Country 2024 & 2032
- Figure 19: South America Viscosupplementation Industry Revenue (Million), by Country 2024 & 2032
- Figure 20: South America Viscosupplementation Industry Volume (K Unit), by Country 2024 & 2032
- Figure 21: South America Viscosupplementation Industry Revenue Share (%), by Country 2024 & 2032
- Figure 22: South America Viscosupplementation Industry Volume Share (%), by Country 2024 & 2032
- Figure 23: North America Viscosupplementation Industry Revenue (Million), by Dosage 2024 & 2032
- Figure 24: North America Viscosupplementation Industry Volume (K Unit), by Dosage 2024 & 2032
- Figure 25: North America Viscosupplementation Industry Revenue Share (%), by Dosage 2024 & 2032
- Figure 26: North America Viscosupplementation Industry Volume Share (%), by Dosage 2024 & 2032
- Figure 27: North America Viscosupplementation Industry Revenue (Million), by End-User 2024 & 2032
- Figure 28: North America Viscosupplementation Industry Volume (K Unit), by End-User 2024 & 2032
- Figure 29: North America Viscosupplementation Industry Revenue Share (%), by End-User 2024 & 2032
- Figure 30: North America Viscosupplementation Industry Volume Share (%), by End-User 2024 & 2032
- Figure 31: North America Viscosupplementation Industry Revenue (Million), by Country 2024 & 2032
- Figure 32: North America Viscosupplementation Industry Volume (K Unit), by Country 2024 & 2032
- Figure 33: North America Viscosupplementation Industry Revenue Share (%), by Country 2024 & 2032
- Figure 34: North America Viscosupplementation Industry Volume Share (%), by Country 2024 & 2032
- Figure 35: Europe Viscosupplementation Industry Revenue (Million), by Dosage 2024 & 2032
- Figure 36: Europe Viscosupplementation Industry Volume (K Unit), by Dosage 2024 & 2032
- Figure 37: Europe Viscosupplementation Industry Revenue Share (%), by Dosage 2024 & 2032
- Figure 38: Europe Viscosupplementation Industry Volume Share (%), by Dosage 2024 & 2032
- Figure 39: Europe Viscosupplementation Industry Revenue (Million), by End-User 2024 & 2032
- Figure 40: Europe Viscosupplementation Industry Volume (K Unit), by End-User 2024 & 2032
- Figure 41: Europe Viscosupplementation Industry Revenue Share (%), by End-User 2024 & 2032
- Figure 42: Europe Viscosupplementation Industry Volume Share (%), by End-User 2024 & 2032
- Figure 43: Europe Viscosupplementation Industry Revenue (Million), by Country 2024 & 2032
- Figure 44: Europe Viscosupplementation Industry Volume (K Unit), by Country 2024 & 2032
- Figure 45: Europe Viscosupplementation Industry Revenue Share (%), by Country 2024 & 2032
- Figure 46: Europe Viscosupplementation Industry Volume Share (%), by Country 2024 & 2032
- Figure 47: Asia Pacific Viscosupplementation Industry Revenue (Million), by Dosage 2024 & 2032
- Figure 48: Asia Pacific Viscosupplementation Industry Volume (K Unit), by Dosage 2024 & 2032
- Figure 49: Asia Pacific Viscosupplementation Industry Revenue Share (%), by Dosage 2024 & 2032
- Figure 50: Asia Pacific Viscosupplementation Industry Volume Share (%), by Dosage 2024 & 2032
- Figure 51: Asia Pacific Viscosupplementation Industry Revenue (Million), by End-User 2024 & 2032
- Figure 52: Asia Pacific Viscosupplementation Industry Volume (K Unit), by End-User 2024 & 2032
- Figure 53: Asia Pacific Viscosupplementation Industry Revenue Share (%), by End-User 2024 & 2032
- Figure 54: Asia Pacific Viscosupplementation Industry Volume Share (%), by End-User 2024 & 2032
- Figure 55: Asia Pacific Viscosupplementation Industry Revenue (Million), by Country 2024 & 2032
- Figure 56: Asia Pacific Viscosupplementation Industry Volume (K Unit), by Country 2024 & 2032
- Figure 57: Asia Pacific Viscosupplementation Industry Revenue Share (%), by Country 2024 & 2032
- Figure 58: Asia Pacific Viscosupplementation Industry Volume Share (%), by Country 2024 & 2032
- Figure 59: Middle East and Africa Viscosupplementation Industry Revenue (Million), by Dosage 2024 & 2032
- Figure 60: Middle East and Africa Viscosupplementation Industry Volume (K Unit), by Dosage 2024 & 2032
- Figure 61: Middle East and Africa Viscosupplementation Industry Revenue Share (%), by Dosage 2024 & 2032
- Figure 62: Middle East and Africa Viscosupplementation Industry Volume Share (%), by Dosage 2024 & 2032
- Figure 63: Middle East and Africa Viscosupplementation Industry Revenue (Million), by End-User 2024 & 2032
- Figure 64: Middle East and Africa Viscosupplementation Industry Volume (K Unit), by End-User 2024 & 2032
- Figure 65: Middle East and Africa Viscosupplementation Industry Revenue Share (%), by End-User 2024 & 2032
- Figure 66: Middle East and Africa Viscosupplementation Industry Volume Share (%), by End-User 2024 & 2032
- Figure 67: Middle East and Africa Viscosupplementation Industry Revenue (Million), by Country 2024 & 2032
- Figure 68: Middle East and Africa Viscosupplementation Industry Volume (K Unit), by Country 2024 & 2032
- Figure 69: Middle East and Africa Viscosupplementation Industry Revenue Share (%), by Country 2024 & 2032
- Figure 70: Middle East and Africa Viscosupplementation Industry Volume Share (%), by Country 2024 & 2032
- Figure 71: South America Viscosupplementation Industry Revenue (Million), by Dosage 2024 & 2032
- Figure 72: South America Viscosupplementation Industry Volume (K Unit), by Dosage 2024 & 2032
- Figure 73: South America Viscosupplementation Industry Revenue Share (%), by Dosage 2024 & 2032
- Figure 74: South America Viscosupplementation Industry Volume Share (%), by Dosage 2024 & 2032
- Figure 75: South America Viscosupplementation Industry Revenue (Million), by End-User 2024 & 2032
- Figure 76: South America Viscosupplementation Industry Volume (K Unit), by End-User 2024 & 2032
- Figure 77: South America Viscosupplementation Industry Revenue Share (%), by End-User 2024 & 2032
- Figure 78: South America Viscosupplementation Industry Volume Share (%), by End-User 2024 & 2032
- Figure 79: South America Viscosupplementation Industry Revenue (Million), by Country 2024 & 2032
- Figure 80: South America Viscosupplementation Industry Volume (K Unit), by Country 2024 & 2032
- Figure 81: South America Viscosupplementation Industry Revenue Share (%), by Country 2024 & 2032
- Figure 82: South America Viscosupplementation Industry Volume Share (%), by Country 2024 & 2032
List of Tables
- Table 1: Global Viscosupplementation Industry Revenue Million Forecast, by Region 2019 & 2032
- Table 2: Global Viscosupplementation Industry Volume K Unit Forecast, by Region 2019 & 2032
- Table 3: Global Viscosupplementation Industry Revenue Million Forecast, by Dosage 2019 & 2032
- Table 4: Global Viscosupplementation Industry Volume K Unit Forecast, by Dosage 2019 & 2032
- Table 5: Global Viscosupplementation Industry Revenue Million Forecast, by End-User 2019 & 2032
- Table 6: Global Viscosupplementation Industry Volume K Unit Forecast, by End-User 2019 & 2032
- Table 7: Global Viscosupplementation Industry Revenue Million Forecast, by Region 2019 & 2032
- Table 8: Global Viscosupplementation Industry Volume K Unit Forecast, by Region 2019 & 2032
- Table 9: Global Viscosupplementation Industry Revenue Million Forecast, by Country 2019 & 2032
- Table 10: Global Viscosupplementation Industry Volume K Unit Forecast, by Country 2019 & 2032
- Table 11: Global Viscosupplementation Industry Revenue Million Forecast, by Country 2019 & 2032
- Table 12: Global Viscosupplementation Industry Volume K Unit Forecast, by Country 2019 & 2032
- Table 13: Global Viscosupplementation Industry Revenue Million Forecast, by Country 2019 & 2032
- Table 14: Global Viscosupplementation Industry Volume K Unit Forecast, by Country 2019 & 2032
- Table 15: Global Viscosupplementation Industry Revenue Million Forecast, by Country 2019 & 2032
- Table 16: Global Viscosupplementation Industry Volume K Unit Forecast, by Country 2019 & 2032
- Table 17: Global Viscosupplementation Industry Revenue Million Forecast, by Country 2019 & 2032
- Table 18: Global Viscosupplementation Industry Volume K Unit Forecast, by Country 2019 & 2032
- Table 19: Global Viscosupplementation Industry Revenue Million Forecast, by Dosage 2019 & 2032
- Table 20: Global Viscosupplementation Industry Volume K Unit Forecast, by Dosage 2019 & 2032
- Table 21: Global Viscosupplementation Industry Revenue Million Forecast, by End-User 2019 & 2032
- Table 22: Global Viscosupplementation Industry Volume K Unit Forecast, by End-User 2019 & 2032
- Table 23: Global Viscosupplementation Industry Revenue Million Forecast, by Country 2019 & 2032
- Table 24: Global Viscosupplementation Industry Volume K Unit Forecast, by Country 2019 & 2032
- Table 25: United States Viscosupplementation Industry Revenue (Million) Forecast, by Application 2019 & 2032
- Table 26: United States Viscosupplementation Industry Volume (K Unit) Forecast, by Application 2019 & 2032
- Table 27: Canada Viscosupplementation Industry Revenue (Million) Forecast, by Application 2019 & 2032
- Table 28: Canada Viscosupplementation Industry Volume (K Unit) Forecast, by Application 2019 & 2032
- Table 29: Mexico Viscosupplementation Industry Revenue (Million) Forecast, by Application 2019 & 2032
- Table 30: Mexico Viscosupplementation Industry Volume (K Unit) Forecast, by Application 2019 & 2032
- Table 31: Global Viscosupplementation Industry Revenue Million Forecast, by Dosage 2019 & 2032
- Table 32: Global Viscosupplementation Industry Volume K Unit Forecast, by Dosage 2019 & 2032
- Table 33: Global Viscosupplementation Industry Revenue Million Forecast, by End-User 2019 & 2032
- Table 34: Global Viscosupplementation Industry Volume K Unit Forecast, by End-User 2019 & 2032
- Table 35: Global Viscosupplementation Industry Revenue Million Forecast, by Country 2019 & 2032
- Table 36: Global Viscosupplementation Industry Volume K Unit Forecast, by Country 2019 & 2032
- Table 37: Germany Viscosupplementation Industry Revenue (Million) Forecast, by Application 2019 & 2032
- Table 38: Germany Viscosupplementation Industry Volume (K Unit) Forecast, by Application 2019 & 2032
- Table 39: United Kingdom Viscosupplementation Industry Revenue (Million) Forecast, by Application 2019 & 2032
- Table 40: United Kingdom Viscosupplementation Industry Volume (K Unit) Forecast, by Application 2019 & 2032
- Table 41: France Viscosupplementation Industry Revenue (Million) Forecast, by Application 2019 & 2032
- Table 42: France Viscosupplementation Industry Volume (K Unit) Forecast, by Application 2019 & 2032
- Table 43: Italy Viscosupplementation Industry Revenue (Million) Forecast, by Application 2019 & 2032
- Table 44: Italy Viscosupplementation Industry Volume (K Unit) Forecast, by Application 2019 & 2032
- Table 45: Spain Viscosupplementation Industry Revenue (Million) Forecast, by Application 2019 & 2032
- Table 46: Spain Viscosupplementation Industry Volume (K Unit) Forecast, by Application 2019 & 2032
- Table 47: Rest of Europe Viscosupplementation Industry Revenue (Million) Forecast, by Application 2019 & 2032
- Table 48: Rest of Europe Viscosupplementation Industry Volume (K Unit) Forecast, by Application 2019 & 2032
- Table 49: Global Viscosupplementation Industry Revenue Million Forecast, by Dosage 2019 & 2032
- Table 50: Global Viscosupplementation Industry Volume K Unit Forecast, by Dosage 2019 & 2032
- Table 51: Global Viscosupplementation Industry Revenue Million Forecast, by End-User 2019 & 2032
- Table 52: Global Viscosupplementation Industry Volume K Unit Forecast, by End-User 2019 & 2032
- Table 53: Global Viscosupplementation Industry Revenue Million Forecast, by Country 2019 & 2032
- Table 54: Global Viscosupplementation Industry Volume K Unit Forecast, by Country 2019 & 2032
- Table 55: China Viscosupplementation Industry Revenue (Million) Forecast, by Application 2019 & 2032
- Table 56: China Viscosupplementation Industry Volume (K Unit) Forecast, by Application 2019 & 2032
- Table 57: Japan Viscosupplementation Industry Revenue (Million) Forecast, by Application 2019 & 2032
- Table 58: Japan Viscosupplementation Industry Volume (K Unit) Forecast, by Application 2019 & 2032
- Table 59: India Viscosupplementation Industry Revenue (Million) Forecast, by Application 2019 & 2032
- Table 60: India Viscosupplementation Industry Volume (K Unit) Forecast, by Application 2019 & 2032
- Table 61: Australia Viscosupplementation Industry Revenue (Million) Forecast, by Application 2019 & 2032
- Table 62: Australia Viscosupplementation Industry Volume (K Unit) Forecast, by Application 2019 & 2032
- Table 63: South Korea Viscosupplementation Industry Revenue (Million) Forecast, by Application 2019 & 2032
- Table 64: South Korea Viscosupplementation Industry Volume (K Unit) Forecast, by Application 2019 & 2032
- Table 65: Rest of Asia Pacific Viscosupplementation Industry Revenue (Million) Forecast, by Application 2019 & 2032
- Table 66: Rest of Asia Pacific Viscosupplementation Industry Volume (K Unit) Forecast, by Application 2019 & 2032
- Table 67: Global Viscosupplementation Industry Revenue Million Forecast, by Dosage 2019 & 2032
- Table 68: Global Viscosupplementation Industry Volume K Unit Forecast, by Dosage 2019 & 2032
- Table 69: Global Viscosupplementation Industry Revenue Million Forecast, by End-User 2019 & 2032
- Table 70: Global Viscosupplementation Industry Volume K Unit Forecast, by End-User 2019 & 2032
- Table 71: Global Viscosupplementation Industry Revenue Million Forecast, by Country 2019 & 2032
- Table 72: Global Viscosupplementation Industry Volume K Unit Forecast, by Country 2019 & 2032
- Table 73: GCC Viscosupplementation Industry Revenue (Million) Forecast, by Application 2019 & 2032
- Table 74: GCC Viscosupplementation Industry Volume (K Unit) Forecast, by Application 2019 & 2032
- Table 75: South Africa Viscosupplementation Industry Revenue (Million) Forecast, by Application 2019 & 2032
- Table 76: South Africa Viscosupplementation Industry Volume (K Unit) Forecast, by Application 2019 & 2032
- Table 77: Rest of Middle East and Africa Viscosupplementation Industry Revenue (Million) Forecast, by Application 2019 & 2032
- Table 78: Rest of Middle East and Africa Viscosupplementation Industry Volume (K Unit) Forecast, by Application 2019 & 2032
- Table 79: Global Viscosupplementation Industry Revenue Million Forecast, by Dosage 2019 & 2032
- Table 80: Global Viscosupplementation Industry Volume K Unit Forecast, by Dosage 2019 & 2032
- Table 81: Global Viscosupplementation Industry Revenue Million Forecast, by End-User 2019 & 2032
- Table 82: Global Viscosupplementation Industry Volume K Unit Forecast, by End-User 2019 & 2032
- Table 83: Global Viscosupplementation Industry Revenue Million Forecast, by Country 2019 & 2032
- Table 84: Global Viscosupplementation Industry Volume K Unit Forecast, by Country 2019 & 2032
- Table 85: Brazil Viscosupplementation Industry Revenue (Million) Forecast, by Application 2019 & 2032
- Table 86: Brazil Viscosupplementation Industry Volume (K Unit) Forecast, by Application 2019 & 2032
- Table 87: Argentina Viscosupplementation Industry Revenue (Million) Forecast, by Application 2019 & 2032
- Table 88: Argentina Viscosupplementation Industry Volume (K Unit) Forecast, by Application 2019 & 2032
- Table 89: Rest of South America Viscosupplementation Industry Revenue (Million) Forecast, by Application 2019 & 2032
- Table 90: Rest of South America Viscosupplementation Industry Volume (K Unit) Forecast, by Application 2019 & 2032
Frequently Asked Questions
1. What is the projected Compound Annual Growth Rate (CAGR) of the Viscosupplementation Industry?
The projected CAGR is approximately 5.80%.
2. Which companies are prominent players in the Viscosupplementation Industry?
Key companies in the market include Wellchem Pharmaceuticals Pte Ltd , Sanofi SA, OrthogenRx Inc, Aptissen, Fidia Farmaceutici s p a, Anika Therapeutics Inc, Johnson & Johnson Services Inc, Ferring Pharmaceuticals, Bioventus LLC, Seikagaku Corporation, Chugai Pharmaceuticals Co Ltd (Roche), Zimmer Biomet.
3. What are the main segments of the Viscosupplementation Industry?
The market segments include Dosage, End-User.
4. Can you provide details about the market size?
The market size is estimated to be USD XX Million as of 2022.
5. What are some drivers contributing to market growth?
Rising Patient Pool Suffering from Osteoarthritis; Introduction of Advanced and Combination Products.
6. What are the notable trends driving market growth?
Single Injection Segment Expects to Register a High CAGR in the Forecast Period.
7. Are there any restraints impacting market growth?
Regulatory Issues and Lack of Awareness.
8. Can you provide examples of recent developments in the market?
N/A
9. What pricing options are available for accessing the report?
Pricing options include single-user, multi-user, and enterprise licenses priced at USD 4750, USD 5250, and USD 8750 respectively.
10. Is the market size provided in terms of value or volume?
The market size is provided in terms of value, measured in Million and volume, measured in K Unit.
11. Are there any specific market keywords associated with the report?
Yes, the market keyword associated with the report is "Viscosupplementation Industry," which aids in identifying and referencing the specific market segment covered.
12. How do I determine which pricing option suits my needs best?
The pricing options vary based on user requirements and access needs. Individual users may opt for single-user licenses, while businesses requiring broader access may choose multi-user or enterprise licenses for cost-effective access to the report.
13. Are there any additional resources or data provided in the Viscosupplementation Industry report?
While the report offers comprehensive insights, it's advisable to review the specific contents or supplementary materials provided to ascertain if additional resources or data are available.
14. How can I stay updated on further developments or reports in the Viscosupplementation Industry?
To stay informed about further developments, trends, and reports in the Viscosupplementation Industry, consider subscribing to industry newsletters, following relevant companies and organizations, or regularly checking reputable industry news sources and publications.
Methodology
Step 1 - Identification of Relevant Samples Size from Population Database


Step 2 - Approaches for Defining Global Market Size (Value, Volume* & Price*)

Note*: In applicable scenarios
Step 3 - Data Sources
Primary Research
- Web Analytics
- Survey Reports
- Research Institute
- Latest Research Reports
- Opinion Leaders
Secondary Research
- Annual Reports
- White Paper
- Latest Press Release
- Industry Association
- Paid Database
- Investor Presentations

Step 4 - Data Triangulation
Involves using different sources of information in order to increase the validity of a study
These sources are likely to be stakeholders in a program - participants, other researchers, program staff, other community members, and so on.
Then we put all data in single framework & apply various statistical tools to find out the dynamic on the market.
During the analysis stage, feedback from the stakeholder groups would be compared to determine areas of agreement as well as areas of divergence
