

Key Insights
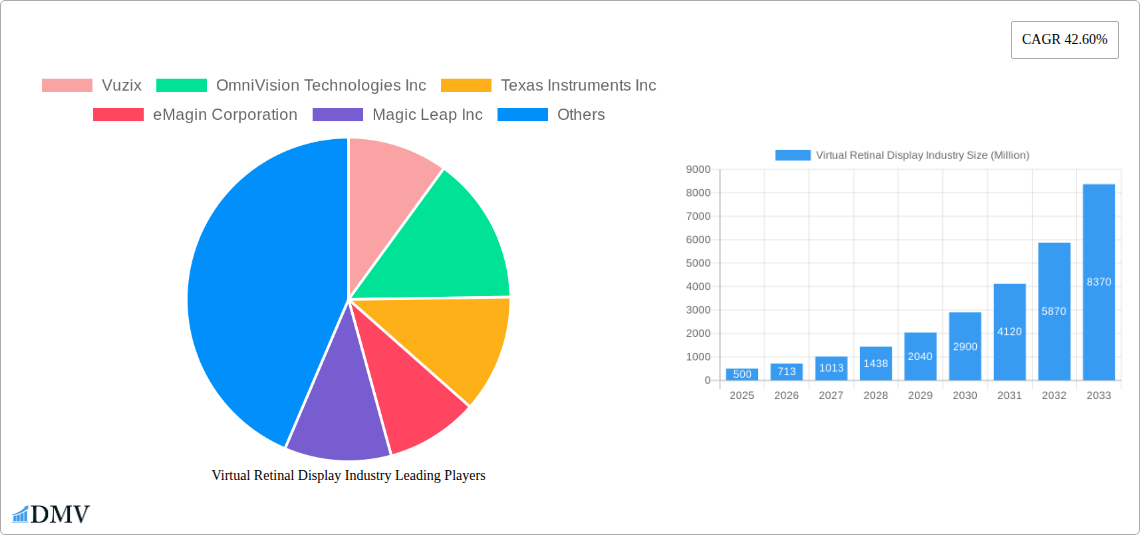
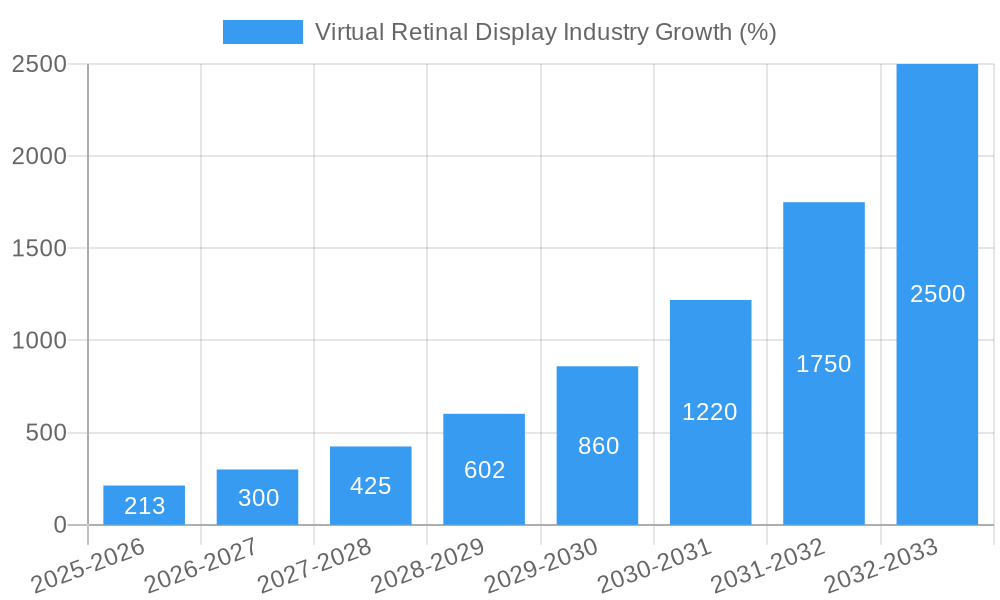
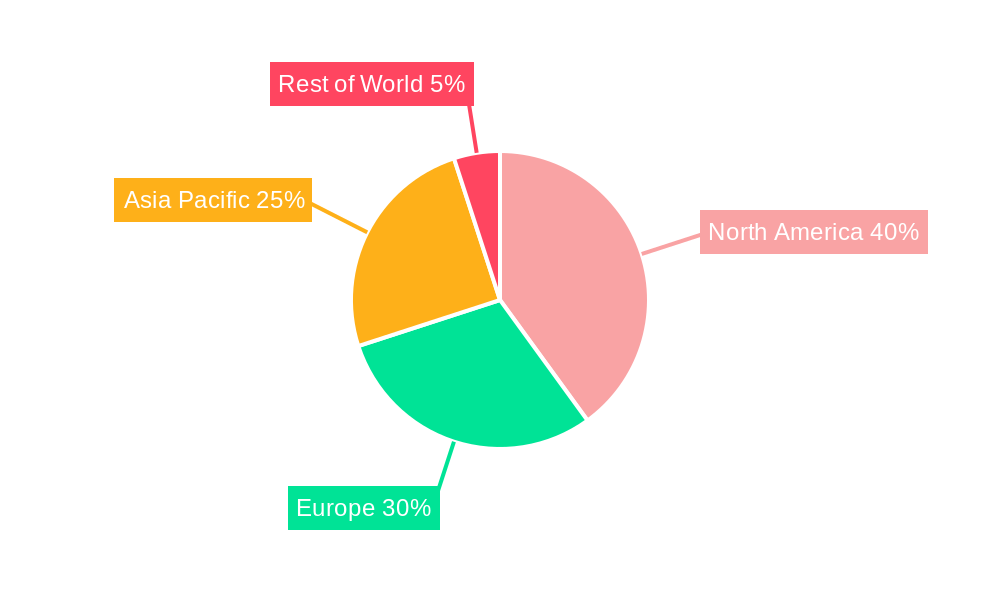
The virtual retinal display (VRD) market is experiencing rapid growth, projected at a 42.60% CAGR from 2025 to 2033. This surge is driven by increasing demand across diverse sectors, primarily fueled by advancements in augmented reality (AR) and virtual reality (VR) technologies. The medical and life sciences industry leads adoption, utilizing VRDs for minimally invasive surgeries, advanced diagnostics, and training simulations. Aerospace and defense benefit from improved pilot training and heads-up displays, while the media and entertainment sector leverages VRDs for immersive gaming and cinematic experiences. Technological advancements, such as improved resolution, brightness, and miniaturization, are further fueling market expansion. However, the high cost of development and implementation, along with potential health concerns related to prolonged use, pose challenges to widespread adoption. The competitive landscape features key players like Vuzix, OmniVision Technologies, and Texas Instruments, each striving for innovation and market share. Regional growth is robust across North America (driven by strong technological advancement), Europe (influenced by increasing adoption in healthcare and defense), and the Asia-Pacific region (with significant growth potential from emerging economies like China and India).
The forecast period of 2025-2033 anticipates sustained growth, though at a potentially moderating rate as the market matures. The continued miniaturization of VRD components is expected to lower production costs, making the technology more accessible to various industries. Furthermore, collaborative efforts between technology companies and industry-specific developers will lead to tailored VRD solutions for niche applications, widening the market base. However, regulatory hurdles related to safety and data privacy, coupled with the emergence of competing display technologies, may influence market growth trajectories. Therefore, continued innovation in areas like power efficiency, image quality, and user comfort is vital for sustained market expansion and overcoming existing limitations.
Virtual Retinal Display Industry: A Comprehensive Market Report (2019-2033)
This insightful report provides a detailed analysis of the Virtual Retinal Display (VRD) industry, encompassing market trends, technological advancements, leading players, and future growth prospects. The study period covers 2019-2033, with 2025 as the base and estimated year, and a forecast period of 2025-2033. The report leverages extensive data analysis and expert insights to provide stakeholders with a comprehensive understanding of this dynamic market poised for significant expansion. The global VRD market is projected to reach xx Million by 2033.
Virtual Retinal Display Industry Market Composition & Trends
This section delves into the competitive landscape of the VRD industry, analyzing market concentration, innovation drivers, regulatory frameworks, and the impact of mergers and acquisitions (M&A). The report examines the distribution of market share amongst key players, revealing a moderately concentrated market with several dominant players and emerging competitors.
- Market Concentration: The market is characterized by a mix of established players and emerging startups, with the top 5 companies holding an estimated xx% market share in 2025.
- Innovation Catalysts: Advancements in micro-display technology, particularly OLED and microLED, are driving innovation. Increased investment in augmented reality (AR) and virtual reality (VR) technologies is fueling further development.
- Regulatory Landscape: The regulatory environment varies across different regions, impacting market entry and product approvals. The report provides a detailed analysis of key regional regulations.
- Substitute Products: Traditional display technologies remain a key substitute, although VRDs offer superior resolution and immersion.
- End-User Profiles: The report segments end-users across Medical & Lifesciences, Aerospace and Defense, Media and Entertainment, and Other End-user Verticals, providing detailed profiles and market size estimations for each sector.
- M&A Activity: Significant M&A activity has shaped the industry landscape. While precise deal values are commercially sensitive, the report notes several key acquisitions exceeding xx Million in value between 2019 and 2024, significantly altering market dynamics.
Virtual Retinal Display Industry Industry Evolution
This section traces the evolution of the VRD industry, examining market growth trajectories, technological advancements, and evolving consumer preferences. The industry has experienced a period of rapid growth, driven by technological advancements and increased demand for immersive experiences. The historical period (2019-2024) witnessed a compound annual growth rate (CAGR) of xx%, while the forecast period (2025-2033) is expected to see a CAGR of xx%, fueled by increased adoption across various sectors, particularly in the Medical & Lifesciences segment. Technological advancements, such as improvements in pixel density (PPD) and field of view, are key drivers for this growth. The increasing affordability of AR/VR devices and the rising demand for immersive gaming experiences and remote collaboration tools are also contributing factors. The integration of VRD technology in smartphones and other portable devices is expected to drive further growth in the coming years. Consumer demand is shifting towards higher resolution, wider field of view, and more comfortable devices.
Leading Regions, Countries, or Segments in Virtual Retinal Display Industry
This section identifies the leading regions, countries, and segments within the VRD market.
Dominant Segment: The Medical & Lifesciences segment is projected to be the fastest-growing segment during the forecast period, driven by the increasing adoption of VRD technology for minimally invasive surgeries, improved diagnostics, and advanced training simulations. This segment is expected to account for xx Million in revenue by 2033.
Key Drivers:
- Medical & Lifesciences: High demand for improved precision in medical procedures, coupled with significant investments in medical technology R&D, is propelling growth. Regulatory approvals for specific medical applications are also crucial.
- Aerospace and Defense: VRD technology offers significant advantages for pilot training and advanced situational awareness, driving adoption in this sector. High government spending on defense technologies supports growth.
- Media and Entertainment: The ongoing growth of AR/VR gaming and immersive entertainment experiences contributes to market demand, although this segment is presently smaller than Medical & Lifesciences.
- Other End-user Verticals: Emerging applications in industrial training, design visualization, and remote collaboration are expanding the market’s reach.
The North American region is expected to hold a significant market share owing to the presence of major players, robust technological advancements, and substantial investments in AR/VR technologies.
Virtual Retinal Display Industry Product Innovations
Recent innovations have focused on enhancing resolution, expanding the field of view, improving power efficiency, and reducing the overall size and weight of VRD devices. The development of higher-PPD microdisplays, exceeding 50 PPD in prototypes, represents a major leap towards achieving retina-resolution displays. This enhancement, along with improved optics and eye-tracking technologies, significantly improves user experience and expands potential applications. Several companies are exploring new materials and manufacturing techniques to further refine performance and lower production costs.
Propelling Factors for Virtual Retinal Display Industry Growth
Several factors are propelling the growth of the VRD industry. Technological advancements, particularly in micro-display technologies and optics, are reducing costs and improving performance. Increased investment in AR/VR technologies by both public and private entities is stimulating innovation and market expansion. Finally, supportive government regulations in certain sectors, particularly medical and defense, are further driving market growth.
Obstacles in the Virtual Retinal Display Industry Market
The VRD industry faces several challenges. High production costs, particularly for high-resolution displays, can limit accessibility. Supply chain disruptions, as seen recently in global markets, can impact production and product availability. Intense competition among existing and emerging players necessitates continuous innovation to maintain market share. Finally, regulatory hurdles and safety concerns, especially within the medical sector, can create barriers to entry and market expansion.
Future Opportunities in Virtual Retinal Display Industry
Future opportunities lie in expanding into new markets, such as industrial applications and consumer electronics. The integration of VRD technology in smartphones and other portable devices holds significant potential. Developments in advanced optics and microdisplay technologies will lead to lighter, smaller, and more energy-efficient VRD devices. Moreover, the growing demand for immersive experiences in various sectors will create further opportunities for growth.
Major Players in the Virtual Retinal Display Industry Ecosystem
- Vuzix
- OmniVision Technologies Inc
- Texas Instruments Inc
- eMagin Corporation
- Magic Leap Inc
- Optivent
- Human Interface Technology Laboratory
- Avegant Corporation
- Movidius Inc (Intel Corporation)
- QD Laser Co Ltd
- Analogix Semiconductor Inc
- Himax Technologies Inc
Key Developments in Virtual Retinal Display Industry Industry
- December 2022: Meta announces plans for a retina-resolution VR headset (60 PPD target), with the Quest Pro already achieving 22 PPD, a 10% increase over the Meta Quest 2. A Butterscotch prototype achieving 55 PPD, but with a limited field of view, was also presented. These advancements highlight the industry's focus on higher resolution and improved user experience.
- December 2022: eMagin Corporation showcases its high-resolution OLED microdisplays at the 10th International Congress on OCT and OCT Angiography, highlighting their application in medical imaging and ophthalmology. This underscores the expanding role of VRD technology in healthcare.
Strategic Virtual Retinal Display Industry Market Forecast
The VRD industry is poised for robust growth, driven by technological advancements and increasing adoption across multiple sectors. New applications, improved performance metrics, and decreasing production costs will fuel market expansion. The focus on high-resolution displays and wider fields of view will define the future landscape, with significant potential for market penetration across various sectors including medical, defense, and entertainment, ultimately increasing the overall market value significantly.
Virtual Retinal Display Industry Segmentation
-
1. End-user Industry
- 1.1. Medical & Lifesciences
- 1.2. Aerospace and Defense
- 1.3. Media and Entertainment
- 1.4. Other End-user Verticals
Virtual Retinal Display Industry Segmentation By Geography
- 1. North America
- 2. Europe
- 3. Asia Pacific
- 4. Latin America
- 5. Middle East
Virtual Retinal Display Industry REPORT HIGHLIGHTS
| Aspects | Details |
|---|---|
| Study Period | 2019-2033 |
| Base Year | 2024 |
| Estimated Year | 2025 |
| Forecast Period | 2025-2033 |
| Historical Period | 2019-2024 |
| Growth Rate | CAGR of 42.60% from 2019-2033 |
| Segmentation |
|
Table of Contents
- 1. Introduction
- 1.1. Research Scope
- 1.2. Market Segmentation
- 1.3. Research Methodology
- 1.4. Definitions and Assumptions
- 2. Executive Summary
- 2.1. Introduction
- 3. Market Dynamics
- 3.1. Introduction
- 3.2. Market Drivers
- 3.2.1. Technical Advantages Over Screen-Based Devices
- 3.3. Market Restrains
- 3.3.1. Security Concerns Regarding Cloud-based Solutions
- 3.4. Market Trends
- 3.4.1. Virtual Reality and Augmented Reality are Gaining Surging Demand from the Entertainment Industry
- 4. Market Factor Analysis
- 4.1. Porters Five Forces
- 4.2. Supply/Value Chain
- 4.3. PESTEL analysis
- 4.4. Market Entropy
- 4.5. Patent/Trademark Analysis
- 5. Global Virtual Retinal Display Industry Analysis, Insights and Forecast, 2019-2031
- 5.1. Market Analysis, Insights and Forecast - by End-user Industry
- 5.1.1. Medical & Lifesciences
- 5.1.2. Aerospace and Defense
- 5.1.3. Media and Entertainment
- 5.1.4. Other End-user Verticals
- 5.2. Market Analysis, Insights and Forecast - by Region
- 5.2.1. North America
- 5.2.2. Europe
- 5.2.3. Asia Pacific
- 5.2.4. Latin America
- 5.2.5. Middle East
- 5.1. Market Analysis, Insights and Forecast - by End-user Industry
- 6. North America Virtual Retinal Display Industry Analysis, Insights and Forecast, 2019-2031
- 6.1. Market Analysis, Insights and Forecast - by End-user Industry
- 6.1.1. Medical & Lifesciences
- 6.1.2. Aerospace and Defense
- 6.1.3. Media and Entertainment
- 6.1.4. Other End-user Verticals
- 6.1. Market Analysis, Insights and Forecast - by End-user Industry
- 7. Europe Virtual Retinal Display Industry Analysis, Insights and Forecast, 2019-2031
- 7.1. Market Analysis, Insights and Forecast - by End-user Industry
- 7.1.1. Medical & Lifesciences
- 7.1.2. Aerospace and Defense
- 7.1.3. Media and Entertainment
- 7.1.4. Other End-user Verticals
- 7.1. Market Analysis, Insights and Forecast - by End-user Industry
- 8. Asia Pacific Virtual Retinal Display Industry Analysis, Insights and Forecast, 2019-2031
- 8.1. Market Analysis, Insights and Forecast - by End-user Industry
- 8.1.1. Medical & Lifesciences
- 8.1.2. Aerospace and Defense
- 8.1.3. Media and Entertainment
- 8.1.4. Other End-user Verticals
- 8.1. Market Analysis, Insights and Forecast - by End-user Industry
- 9. Latin America Virtual Retinal Display Industry Analysis, Insights and Forecast, 2019-2031
- 9.1. Market Analysis, Insights and Forecast - by End-user Industry
- 9.1.1. Medical & Lifesciences
- 9.1.2. Aerospace and Defense
- 9.1.3. Media and Entertainment
- 9.1.4. Other End-user Verticals
- 9.1. Market Analysis, Insights and Forecast - by End-user Industry
- 10. Middle East Virtual Retinal Display Industry Analysis, Insights and Forecast, 2019-2031
- 10.1. Market Analysis, Insights and Forecast - by End-user Industry
- 10.1.1. Medical & Lifesciences
- 10.1.2. Aerospace and Defense
- 10.1.3. Media and Entertainment
- 10.1.4. Other End-user Verticals
- 10.1. Market Analysis, Insights and Forecast - by End-user Industry
- 11. North America Virtual Retinal Display Industry Analysis, Insights and Forecast, 2019-2031
- 11.1. Market Analysis, Insights and Forecast - By Country/Sub-region
- 11.1.1 United States
- 11.1.2 Canada
- 11.1.3 Mexico
- 12. Europe Virtual Retinal Display Industry Analysis, Insights and Forecast, 2019-2031
- 12.1. Market Analysis, Insights and Forecast - By Country/Sub-region
- 12.1.1 Germany
- 12.1.2 United Kingdom
- 12.1.3 France
- 12.1.4 Spain
- 12.1.5 Italy
- 12.1.6 Spain
- 12.1.7 Belgium
- 12.1.8 Netherland
- 12.1.9 Nordics
- 12.1.10 Rest of Europe
- 13. Asia Pacific Virtual Retinal Display Industry Analysis, Insights and Forecast, 2019-2031
- 13.1. Market Analysis, Insights and Forecast - By Country/Sub-region
- 13.1.1 China
- 13.1.2 Japan
- 13.1.3 India
- 13.1.4 South Korea
- 13.1.5 Southeast Asia
- 13.1.6 Australia
- 13.1.7 Indonesia
- 13.1.8 Phillipes
- 13.1.9 Singapore
- 13.1.10 Thailandc
- 13.1.11 Rest of Asia Pacific
- 14. South America Virtual Retinal Display Industry Analysis, Insights and Forecast, 2019-2031
- 14.1. Market Analysis, Insights and Forecast - By Country/Sub-region
- 14.1.1 Brazil
- 14.1.2 Argentina
- 14.1.3 Peru
- 14.1.4 Chile
- 14.1.5 Colombia
- 14.1.6 Ecuador
- 14.1.7 Venezuela
- 14.1.8 Rest of South America
- 15. North America Virtual Retinal Display Industry Analysis, Insights and Forecast, 2019-2031
- 15.1. Market Analysis, Insights and Forecast - By Country/Sub-region
- 15.1.1 United States
- 15.1.2 Canada
- 15.1.3 Mexico
- 16. MEA Virtual Retinal Display Industry Analysis, Insights and Forecast, 2019-2031
- 16.1. Market Analysis, Insights and Forecast - By Country/Sub-region
- 16.1.1 United Arab Emirates
- 16.1.2 Saudi Arabia
- 16.1.3 South Africa
- 16.1.4 Rest of Middle East and Africa
- 17. Competitive Analysis
- 17.1. Global Market Share Analysis 2024
- 17.2. Company Profiles
- 17.2.1 Vuzix
- 17.2.1.1. Overview
- 17.2.1.2. Products
- 17.2.1.3. SWOT Analysis
- 17.2.1.4. Recent Developments
- 17.2.1.5. Financials (Based on Availability)
- 17.2.2 OmniVision Technologies Inc
- 17.2.2.1. Overview
- 17.2.2.2. Products
- 17.2.2.3. SWOT Analysis
- 17.2.2.4. Recent Developments
- 17.2.2.5. Financials (Based on Availability)
- 17.2.3 Texas Instruments Inc
- 17.2.3.1. Overview
- 17.2.3.2. Products
- 17.2.3.3. SWOT Analysis
- 17.2.3.4. Recent Developments
- 17.2.3.5. Financials (Based on Availability)
- 17.2.4 eMagin Corporation
- 17.2.4.1. Overview
- 17.2.4.2. Products
- 17.2.4.3. SWOT Analysis
- 17.2.4.4. Recent Developments
- 17.2.4.5. Financials (Based on Availability)
- 17.2.5 Magic Leap Inc
- 17.2.5.1. Overview
- 17.2.5.2. Products
- 17.2.5.3. SWOT Analysis
- 17.2.5.4. Recent Developments
- 17.2.5.5. Financials (Based on Availability)
- 17.2.6 Optivent
- 17.2.6.1. Overview
- 17.2.6.2. Products
- 17.2.6.3. SWOT Analysis
- 17.2.6.4. Recent Developments
- 17.2.6.5. Financials (Based on Availability)
- 17.2.7 Human Interface Technology Laboratory
- 17.2.7.1. Overview
- 17.2.7.2. Products
- 17.2.7.3. SWOT Analysis
- 17.2.7.4. Recent Developments
- 17.2.7.5. Financials (Based on Availability)
- 17.2.8 Avegant Corporation
- 17.2.8.1. Overview
- 17.2.8.2. Products
- 17.2.8.3. SWOT Analysis
- 17.2.8.4. Recent Developments
- 17.2.8.5. Financials (Based on Availability)
- 17.2.9 Movidius Inc (Intel Corporation)
- 17.2.9.1. Overview
- 17.2.9.2. Products
- 17.2.9.3. SWOT Analysis
- 17.2.9.4. Recent Developments
- 17.2.9.5. Financials (Based on Availability)
- 17.2.10 QD Laser Co Ltd
- 17.2.10.1. Overview
- 17.2.10.2. Products
- 17.2.10.3. SWOT Analysis
- 17.2.10.4. Recent Developments
- 17.2.10.5. Financials (Based on Availability)
- 17.2.11 Analogix Semiconductor Inc
- 17.2.11.1. Overview
- 17.2.11.2. Products
- 17.2.11.3. SWOT Analysis
- 17.2.11.4. Recent Developments
- 17.2.11.5. Financials (Based on Availability)
- 17.2.12 Himax Technologies Inc
- 17.2.12.1. Overview
- 17.2.12.2. Products
- 17.2.12.3. SWOT Analysis
- 17.2.12.4. Recent Developments
- 17.2.12.5. Financials (Based on Availability)
- 17.2.1 Vuzix
List of Figures
- Figure 1: Global Virtual Retinal Display Industry Revenue Breakdown (Million, %) by Region 2024 & 2032
- Figure 2: Global Virtual Retinal Display Industry Volume Breakdown (K Unit, %) by Region 2024 & 2032
- Figure 3: North America Virtual Retinal Display Industry Revenue (Million), by Country 2024 & 2032
- Figure 4: North America Virtual Retinal Display Industry Volume (K Unit), by Country 2024 & 2032
- Figure 5: North America Virtual Retinal Display Industry Revenue Share (%), by Country 2024 & 2032
- Figure 6: North America Virtual Retinal Display Industry Volume Share (%), by Country 2024 & 2032
- Figure 7: Europe Virtual Retinal Display Industry Revenue (Million), by Country 2024 & 2032
- Figure 8: Europe Virtual Retinal Display Industry Volume (K Unit), by Country 2024 & 2032
- Figure 9: Europe Virtual Retinal Display Industry Revenue Share (%), by Country 2024 & 2032
- Figure 10: Europe Virtual Retinal Display Industry Volume Share (%), by Country 2024 & 2032
- Figure 11: Asia Pacific Virtual Retinal Display Industry Revenue (Million), by Country 2024 & 2032
- Figure 12: Asia Pacific Virtual Retinal Display Industry Volume (K Unit), by Country 2024 & 2032
- Figure 13: Asia Pacific Virtual Retinal Display Industry Revenue Share (%), by Country 2024 & 2032
- Figure 14: Asia Pacific Virtual Retinal Display Industry Volume Share (%), by Country 2024 & 2032
- Figure 15: South America Virtual Retinal Display Industry Revenue (Million), by Country 2024 & 2032
- Figure 16: South America Virtual Retinal Display Industry Volume (K Unit), by Country 2024 & 2032
- Figure 17: South America Virtual Retinal Display Industry Revenue Share (%), by Country 2024 & 2032
- Figure 18: South America Virtual Retinal Display Industry Volume Share (%), by Country 2024 & 2032
- Figure 19: North America Virtual Retinal Display Industry Revenue (Million), by Country 2024 & 2032
- Figure 20: North America Virtual Retinal Display Industry Volume (K Unit), by Country 2024 & 2032
- Figure 21: North America Virtual Retinal Display Industry Revenue Share (%), by Country 2024 & 2032
- Figure 22: North America Virtual Retinal Display Industry Volume Share (%), by Country 2024 & 2032
- Figure 23: MEA Virtual Retinal Display Industry Revenue (Million), by Country 2024 & 2032
- Figure 24: MEA Virtual Retinal Display Industry Volume (K Unit), by Country 2024 & 2032
- Figure 25: MEA Virtual Retinal Display Industry Revenue Share (%), by Country 2024 & 2032
- Figure 26: MEA Virtual Retinal Display Industry Volume Share (%), by Country 2024 & 2032
- Figure 27: North America Virtual Retinal Display Industry Revenue (Million), by End-user Industry 2024 & 2032
- Figure 28: North America Virtual Retinal Display Industry Volume (K Unit), by End-user Industry 2024 & 2032
- Figure 29: North America Virtual Retinal Display Industry Revenue Share (%), by End-user Industry 2024 & 2032
- Figure 30: North America Virtual Retinal Display Industry Volume Share (%), by End-user Industry 2024 & 2032
- Figure 31: North America Virtual Retinal Display Industry Revenue (Million), by Country 2024 & 2032
- Figure 32: North America Virtual Retinal Display Industry Volume (K Unit), by Country 2024 & 2032
- Figure 33: North America Virtual Retinal Display Industry Revenue Share (%), by Country 2024 & 2032
- Figure 34: North America Virtual Retinal Display Industry Volume Share (%), by Country 2024 & 2032
- Figure 35: Europe Virtual Retinal Display Industry Revenue (Million), by End-user Industry 2024 & 2032
- Figure 36: Europe Virtual Retinal Display Industry Volume (K Unit), by End-user Industry 2024 & 2032
- Figure 37: Europe Virtual Retinal Display Industry Revenue Share (%), by End-user Industry 2024 & 2032
- Figure 38: Europe Virtual Retinal Display Industry Volume Share (%), by End-user Industry 2024 & 2032
- Figure 39: Europe Virtual Retinal Display Industry Revenue (Million), by Country 2024 & 2032
- Figure 40: Europe Virtual Retinal Display Industry Volume (K Unit), by Country 2024 & 2032
- Figure 41: Europe Virtual Retinal Display Industry Revenue Share (%), by Country 2024 & 2032
- Figure 42: Europe Virtual Retinal Display Industry Volume Share (%), by Country 2024 & 2032
- Figure 43: Asia Pacific Virtual Retinal Display Industry Revenue (Million), by End-user Industry 2024 & 2032
- Figure 44: Asia Pacific Virtual Retinal Display Industry Volume (K Unit), by End-user Industry 2024 & 2032
- Figure 45: Asia Pacific Virtual Retinal Display Industry Revenue Share (%), by End-user Industry 2024 & 2032
- Figure 46: Asia Pacific Virtual Retinal Display Industry Volume Share (%), by End-user Industry 2024 & 2032
- Figure 47: Asia Pacific Virtual Retinal Display Industry Revenue (Million), by Country 2024 & 2032
- Figure 48: Asia Pacific Virtual Retinal Display Industry Volume (K Unit), by Country 2024 & 2032
- Figure 49: Asia Pacific Virtual Retinal Display Industry Revenue Share (%), by Country 2024 & 2032
- Figure 50: Asia Pacific Virtual Retinal Display Industry Volume Share (%), by Country 2024 & 2032
- Figure 51: Latin America Virtual Retinal Display Industry Revenue (Million), by End-user Industry 2024 & 2032
- Figure 52: Latin America Virtual Retinal Display Industry Volume (K Unit), by End-user Industry 2024 & 2032
- Figure 53: Latin America Virtual Retinal Display Industry Revenue Share (%), by End-user Industry 2024 & 2032
- Figure 54: Latin America Virtual Retinal Display Industry Volume Share (%), by End-user Industry 2024 & 2032
- Figure 55: Latin America Virtual Retinal Display Industry Revenue (Million), by Country 2024 & 2032
- Figure 56: Latin America Virtual Retinal Display Industry Volume (K Unit), by Country 2024 & 2032
- Figure 57: Latin America Virtual Retinal Display Industry Revenue Share (%), by Country 2024 & 2032
- Figure 58: Latin America Virtual Retinal Display Industry Volume Share (%), by Country 2024 & 2032
- Figure 59: Middle East Virtual Retinal Display Industry Revenue (Million), by End-user Industry 2024 & 2032
- Figure 60: Middle East Virtual Retinal Display Industry Volume (K Unit), by End-user Industry 2024 & 2032
- Figure 61: Middle East Virtual Retinal Display Industry Revenue Share (%), by End-user Industry 2024 & 2032
- Figure 62: Middle East Virtual Retinal Display Industry Volume Share (%), by End-user Industry 2024 & 2032
- Figure 63: Middle East Virtual Retinal Display Industry Revenue (Million), by Country 2024 & 2032
- Figure 64: Middle East Virtual Retinal Display Industry Volume (K Unit), by Country 2024 & 2032
- Figure 65: Middle East Virtual Retinal Display Industry Revenue Share (%), by Country 2024 & 2032
- Figure 66: Middle East Virtual Retinal Display Industry Volume Share (%), by Country 2024 & 2032
List of Tables
- Table 1: Global Virtual Retinal Display Industry Revenue Million Forecast, by Region 2019 & 2032
- Table 2: Global Virtual Retinal Display Industry Volume K Unit Forecast, by Region 2019 & 2032
- Table 3: Global Virtual Retinal Display Industry Revenue Million Forecast, by End-user Industry 2019 & 2032
- Table 4: Global Virtual Retinal Display Industry Volume K Unit Forecast, by End-user Industry 2019 & 2032
- Table 5: Global Virtual Retinal Display Industry Revenue Million Forecast, by Region 2019 & 2032
- Table 6: Global Virtual Retinal Display Industry Volume K Unit Forecast, by Region 2019 & 2032
- Table 7: Global Virtual Retinal Display Industry Revenue Million Forecast, by Country 2019 & 2032
- Table 8: Global Virtual Retinal Display Industry Volume K Unit Forecast, by Country 2019 & 2032
- Table 9: United States Virtual Retinal Display Industry Revenue (Million) Forecast, by Application 2019 & 2032
- Table 10: United States Virtual Retinal Display Industry Volume (K Unit) Forecast, by Application 2019 & 2032
- Table 11: Canada Virtual Retinal Display Industry Revenue (Million) Forecast, by Application 2019 & 2032
- Table 12: Canada Virtual Retinal Display Industry Volume (K Unit) Forecast, by Application 2019 & 2032
- Table 13: Mexico Virtual Retinal Display Industry Revenue (Million) Forecast, by Application 2019 & 2032
- Table 14: Mexico Virtual Retinal Display Industry Volume (K Unit) Forecast, by Application 2019 & 2032
- Table 15: Global Virtual Retinal Display Industry Revenue Million Forecast, by Country 2019 & 2032
- Table 16: Global Virtual Retinal Display Industry Volume K Unit Forecast, by Country 2019 & 2032
- Table 17: Germany Virtual Retinal Display Industry Revenue (Million) Forecast, by Application 2019 & 2032
- Table 18: Germany Virtual Retinal Display Industry Volume (K Unit) Forecast, by Application 2019 & 2032
- Table 19: United Kingdom Virtual Retinal Display Industry Revenue (Million) Forecast, by Application 2019 & 2032
- Table 20: United Kingdom Virtual Retinal Display Industry Volume (K Unit) Forecast, by Application 2019 & 2032
- Table 21: France Virtual Retinal Display Industry Revenue (Million) Forecast, by Application 2019 & 2032
- Table 22: France Virtual Retinal Display Industry Volume (K Unit) Forecast, by Application 2019 & 2032
- Table 23: Spain Virtual Retinal Display Industry Revenue (Million) Forecast, by Application 2019 & 2032
- Table 24: Spain Virtual Retinal Display Industry Volume (K Unit) Forecast, by Application 2019 & 2032
- Table 25: Italy Virtual Retinal Display Industry Revenue (Million) Forecast, by Application 2019 & 2032
- Table 26: Italy Virtual Retinal Display Industry Volume (K Unit) Forecast, by Application 2019 & 2032
- Table 27: Spain Virtual Retinal Display Industry Revenue (Million) Forecast, by Application 2019 & 2032
- Table 28: Spain Virtual Retinal Display Industry Volume (K Unit) Forecast, by Application 2019 & 2032
- Table 29: Belgium Virtual Retinal Display Industry Revenue (Million) Forecast, by Application 2019 & 2032
- Table 30: Belgium Virtual Retinal Display Industry Volume (K Unit) Forecast, by Application 2019 & 2032
- Table 31: Netherland Virtual Retinal Display Industry Revenue (Million) Forecast, by Application 2019 & 2032
- Table 32: Netherland Virtual Retinal Display Industry Volume (K Unit) Forecast, by Application 2019 & 2032
- Table 33: Nordics Virtual Retinal Display Industry Revenue (Million) Forecast, by Application 2019 & 2032
- Table 34: Nordics Virtual Retinal Display Industry Volume (K Unit) Forecast, by Application 2019 & 2032
- Table 35: Rest of Europe Virtual Retinal Display Industry Revenue (Million) Forecast, by Application 2019 & 2032
- Table 36: Rest of Europe Virtual Retinal Display Industry Volume (K Unit) Forecast, by Application 2019 & 2032
- Table 37: Global Virtual Retinal Display Industry Revenue Million Forecast, by Country 2019 & 2032
- Table 38: Global Virtual Retinal Display Industry Volume K Unit Forecast, by Country 2019 & 2032
- Table 39: China Virtual Retinal Display Industry Revenue (Million) Forecast, by Application 2019 & 2032
- Table 40: China Virtual Retinal Display Industry Volume (K Unit) Forecast, by Application 2019 & 2032
- Table 41: Japan Virtual Retinal Display Industry Revenue (Million) Forecast, by Application 2019 & 2032
- Table 42: Japan Virtual Retinal Display Industry Volume (K Unit) Forecast, by Application 2019 & 2032
- Table 43: India Virtual Retinal Display Industry Revenue (Million) Forecast, by Application 2019 & 2032
- Table 44: India Virtual Retinal Display Industry Volume (K Unit) Forecast, by Application 2019 & 2032
- Table 45: South Korea Virtual Retinal Display Industry Revenue (Million) Forecast, by Application 2019 & 2032
- Table 46: South Korea Virtual Retinal Display Industry Volume (K Unit) Forecast, by Application 2019 & 2032
- Table 47: Southeast Asia Virtual Retinal Display Industry Revenue (Million) Forecast, by Application 2019 & 2032
- Table 48: Southeast Asia Virtual Retinal Display Industry Volume (K Unit) Forecast, by Application 2019 & 2032
- Table 49: Australia Virtual Retinal Display Industry Revenue (Million) Forecast, by Application 2019 & 2032
- Table 50: Australia Virtual Retinal Display Industry Volume (K Unit) Forecast, by Application 2019 & 2032
- Table 51: Indonesia Virtual Retinal Display Industry Revenue (Million) Forecast, by Application 2019 & 2032
- Table 52: Indonesia Virtual Retinal Display Industry Volume (K Unit) Forecast, by Application 2019 & 2032
- Table 53: Phillipes Virtual Retinal Display Industry Revenue (Million) Forecast, by Application 2019 & 2032
- Table 54: Phillipes Virtual Retinal Display Industry Volume (K Unit) Forecast, by Application 2019 & 2032
- Table 55: Singapore Virtual Retinal Display Industry Revenue (Million) Forecast, by Application 2019 & 2032
- Table 56: Singapore Virtual Retinal Display Industry Volume (K Unit) Forecast, by Application 2019 & 2032
- Table 57: Thailandc Virtual Retinal Display Industry Revenue (Million) Forecast, by Application 2019 & 2032
- Table 58: Thailandc Virtual Retinal Display Industry Volume (K Unit) Forecast, by Application 2019 & 2032
- Table 59: Rest of Asia Pacific Virtual Retinal Display Industry Revenue (Million) Forecast, by Application 2019 & 2032
- Table 60: Rest of Asia Pacific Virtual Retinal Display Industry Volume (K Unit) Forecast, by Application 2019 & 2032
- Table 61: Global Virtual Retinal Display Industry Revenue Million Forecast, by Country 2019 & 2032
- Table 62: Global Virtual Retinal Display Industry Volume K Unit Forecast, by Country 2019 & 2032
- Table 63: Brazil Virtual Retinal Display Industry Revenue (Million) Forecast, by Application 2019 & 2032
- Table 64: Brazil Virtual Retinal Display Industry Volume (K Unit) Forecast, by Application 2019 & 2032
- Table 65: Argentina Virtual Retinal Display Industry Revenue (Million) Forecast, by Application 2019 & 2032
- Table 66: Argentina Virtual Retinal Display Industry Volume (K Unit) Forecast, by Application 2019 & 2032
- Table 67: Peru Virtual Retinal Display Industry Revenue (Million) Forecast, by Application 2019 & 2032
- Table 68: Peru Virtual Retinal Display Industry Volume (K Unit) Forecast, by Application 2019 & 2032
- Table 69: Chile Virtual Retinal Display Industry Revenue (Million) Forecast, by Application 2019 & 2032
- Table 70: Chile Virtual Retinal Display Industry Volume (K Unit) Forecast, by Application 2019 & 2032
- Table 71: Colombia Virtual Retinal Display Industry Revenue (Million) Forecast, by Application 2019 & 2032
- Table 72: Colombia Virtual Retinal Display Industry Volume (K Unit) Forecast, by Application 2019 & 2032
- Table 73: Ecuador Virtual Retinal Display Industry Revenue (Million) Forecast, by Application 2019 & 2032
- Table 74: Ecuador Virtual Retinal Display Industry Volume (K Unit) Forecast, by Application 2019 & 2032
- Table 75: Venezuela Virtual Retinal Display Industry Revenue (Million) Forecast, by Application 2019 & 2032
- Table 76: Venezuela Virtual Retinal Display Industry Volume (K Unit) Forecast, by Application 2019 & 2032
- Table 77: Rest of South America Virtual Retinal Display Industry Revenue (Million) Forecast, by Application 2019 & 2032
- Table 78: Rest of South America Virtual Retinal Display Industry Volume (K Unit) Forecast, by Application 2019 & 2032
- Table 79: Global Virtual Retinal Display Industry Revenue Million Forecast, by Country 2019 & 2032
- Table 80: Global Virtual Retinal Display Industry Volume K Unit Forecast, by Country 2019 & 2032
- Table 81: United States Virtual Retinal Display Industry Revenue (Million) Forecast, by Application 2019 & 2032
- Table 82: United States Virtual Retinal Display Industry Volume (K Unit) Forecast, by Application 2019 & 2032
- Table 83: Canada Virtual Retinal Display Industry Revenue (Million) Forecast, by Application 2019 & 2032
- Table 84: Canada Virtual Retinal Display Industry Volume (K Unit) Forecast, by Application 2019 & 2032
- Table 85: Mexico Virtual Retinal Display Industry Revenue (Million) Forecast, by Application 2019 & 2032
- Table 86: Mexico Virtual Retinal Display Industry Volume (K Unit) Forecast, by Application 2019 & 2032
- Table 87: Global Virtual Retinal Display Industry Revenue Million Forecast, by Country 2019 & 2032
- Table 88: Global Virtual Retinal Display Industry Volume K Unit Forecast, by Country 2019 & 2032
- Table 89: United Arab Emirates Virtual Retinal Display Industry Revenue (Million) Forecast, by Application 2019 & 2032
- Table 90: United Arab Emirates Virtual Retinal Display Industry Volume (K Unit) Forecast, by Application 2019 & 2032
- Table 91: Saudi Arabia Virtual Retinal Display Industry Revenue (Million) Forecast, by Application 2019 & 2032
- Table 92: Saudi Arabia Virtual Retinal Display Industry Volume (K Unit) Forecast, by Application 2019 & 2032
- Table 93: South Africa Virtual Retinal Display Industry Revenue (Million) Forecast, by Application 2019 & 2032
- Table 94: South Africa Virtual Retinal Display Industry Volume (K Unit) Forecast, by Application 2019 & 2032
- Table 95: Rest of Middle East and Africa Virtual Retinal Display Industry Revenue (Million) Forecast, by Application 2019 & 2032
- Table 96: Rest of Middle East and Africa Virtual Retinal Display Industry Volume (K Unit) Forecast, by Application 2019 & 2032
- Table 97: Global Virtual Retinal Display Industry Revenue Million Forecast, by End-user Industry 2019 & 2032
- Table 98: Global Virtual Retinal Display Industry Volume K Unit Forecast, by End-user Industry 2019 & 2032
- Table 99: Global Virtual Retinal Display Industry Revenue Million Forecast, by Country 2019 & 2032
- Table 100: Global Virtual Retinal Display Industry Volume K Unit Forecast, by Country 2019 & 2032
- Table 101: Global Virtual Retinal Display Industry Revenue Million Forecast, by End-user Industry 2019 & 2032
- Table 102: Global Virtual Retinal Display Industry Volume K Unit Forecast, by End-user Industry 2019 & 2032
- Table 103: Global Virtual Retinal Display Industry Revenue Million Forecast, by Country 2019 & 2032
- Table 104: Global Virtual Retinal Display Industry Volume K Unit Forecast, by Country 2019 & 2032
- Table 105: Global Virtual Retinal Display Industry Revenue Million Forecast, by End-user Industry 2019 & 2032
- Table 106: Global Virtual Retinal Display Industry Volume K Unit Forecast, by End-user Industry 2019 & 2032
- Table 107: Global Virtual Retinal Display Industry Revenue Million Forecast, by Country 2019 & 2032
- Table 108: Global Virtual Retinal Display Industry Volume K Unit Forecast, by Country 2019 & 2032
- Table 109: Global Virtual Retinal Display Industry Revenue Million Forecast, by End-user Industry 2019 & 2032
- Table 110: Global Virtual Retinal Display Industry Volume K Unit Forecast, by End-user Industry 2019 & 2032
- Table 111: Global Virtual Retinal Display Industry Revenue Million Forecast, by Country 2019 & 2032
- Table 112: Global Virtual Retinal Display Industry Volume K Unit Forecast, by Country 2019 & 2032
- Table 113: Global Virtual Retinal Display Industry Revenue Million Forecast, by End-user Industry 2019 & 2032
- Table 114: Global Virtual Retinal Display Industry Volume K Unit Forecast, by End-user Industry 2019 & 2032
- Table 115: Global Virtual Retinal Display Industry Revenue Million Forecast, by Country 2019 & 2032
- Table 116: Global Virtual Retinal Display Industry Volume K Unit Forecast, by Country 2019 & 2032
Frequently Asked Questions
1. What is the projected Compound Annual Growth Rate (CAGR) of the Virtual Retinal Display Industry?
The projected CAGR is approximately 42.60%.
2. Which companies are prominent players in the Virtual Retinal Display Industry?
Key companies in the market include Vuzix, OmniVision Technologies Inc, Texas Instruments Inc, eMagin Corporation, Magic Leap Inc, Optivent, Human Interface Technology Laboratory, Avegant Corporation, Movidius Inc (Intel Corporation), QD Laser Co Ltd, Analogix Semiconductor Inc, Himax Technologies Inc.
3. What are the main segments of the Virtual Retinal Display Industry?
The market segments include End-user Industry.
4. Can you provide details about the market size?
The market size is estimated to be USD XX Million as of 2022.
5. What are some drivers contributing to market growth?
Technical Advantages Over Screen-Based Devices.
6. What are the notable trends driving market growth?
Virtual Reality and Augmented Reality are Gaining Surging Demand from the Entertainment Industry.
7. Are there any restraints impacting market growth?
Security Concerns Regarding Cloud-based Solutions.
8. Can you provide examples of recent developments in the market?
December 2022: Meta confirms that it plans to bring a Retina-resolution VR headset to product maturity. Quest Pro has ten percent more PPD than Meta Quest 2, according to Meta (22 vs. 20 PPD). The PPD value takes the screen and the optics into account and measures the number of pixels within 1° of the field of view. For comparison, the Retina's 'resolution' is around 60 PPD, which is also the value Meta is aiming In the summer, display researchers presented the Butterscotch prototype, which achieves 55 PPD, but only has half the field of view of Meta Quest 2.
9. What pricing options are available for accessing the report?
Pricing options include single-user, multi-user, and enterprise licenses priced at USD 4750, USD 5250, and USD 8750 respectively.
10. Is the market size provided in terms of value or volume?
The market size is provided in terms of value, measured in Million and volume, measured in K Unit.
11. Are there any specific market keywords associated with the report?
Yes, the market keyword associated with the report is "Virtual Retinal Display Industry," which aids in identifying and referencing the specific market segment covered.
12. How do I determine which pricing option suits my needs best?
The pricing options vary based on user requirements and access needs. Individual users may opt for single-user licenses, while businesses requiring broader access may choose multi-user or enterprise licenses for cost-effective access to the report.
13. Are there any additional resources or data provided in the Virtual Retinal Display Industry report?
While the report offers comprehensive insights, it's advisable to review the specific contents or supplementary materials provided to ascertain if additional resources or data are available.
14. How can I stay updated on further developments or reports in the Virtual Retinal Display Industry?
To stay informed about further developments, trends, and reports in the Virtual Retinal Display Industry, consider subscribing to industry newsletters, following relevant companies and organizations, or regularly checking reputable industry news sources and publications.
Methodology
Step 1 - Identification of Relevant Samples Size from Population Database


Step 2 - Approaches for Defining Global Market Size (Value, Volume* & Price*)

Note*: In applicable scenarios
Step 3 - Data Sources
Primary Research
- Web Analytics
- Survey Reports
- Research Institute
- Latest Research Reports
- Opinion Leaders
Secondary Research
- Annual Reports
- White Paper
- Latest Press Release
- Industry Association
- Paid Database
- Investor Presentations

Step 4 - Data Triangulation
Involves using different sources of information in order to increase the validity of a study
These sources are likely to be stakeholders in a program - participants, other researchers, program staff, other community members, and so on.
Then we put all data in single framework & apply various statistical tools to find out the dynamic on the market.
During the analysis stage, feedback from the stakeholder groups would be compared to determine areas of agreement as well as areas of divergence
