

Key Insights
The virtual event industry is experiencing explosive growth, projected to reach \$216.12 million in 2025 and maintain a robust Compound Annual Growth Rate (CAGR) of 24.92% from 2025 to 2033. This expansion is fueled by several key drivers. The increasing adoption of digital technologies across various sectors, including education, enterprise, and organizations, is a primary catalyst. Furthermore, the cost-effectiveness and scalability of virtual events compared to traditional in-person events are significant advantages. The flexibility offered by virtual events, enabling participation from diverse geographical locations and accommodating larger audiences, further bolsters market growth. The ongoing trend towards hybrid event models, combining both virtual and in-person components, is also contributing to market expansion. While challenges such as ensuring engaging virtual experiences and overcoming technological limitations exist, these are being actively addressed through continuous innovation in virtual event platforms and interactive technologies. The segmentation of the market, encompassing various service types (communication, recruitment, sales & marketing, training) and applications (conferences, exhibitions, summits), reflects the versatility and wide applicability of virtual events. Leading companies such as Zoom, Cvent, and 6Connex are spearheading this growth by offering sophisticated platforms and services. The geographic distribution of the market, with strong presence in North America and Europe, is further expanding into Asia Pacific and other regions as digital adoption increases globally.
The sustained high CAGR indicates a strong future for the virtual event industry. While specific regional market shares require further data, North America and Europe are likely to maintain a significant portion of the market in the foreseeable future due to their advanced technological infrastructure and high adoption rates. However, rapid growth is expected in Asia Pacific, driven by increasing internet penetration and a burgeoning middle class. The continued development of immersive technologies, such as virtual reality and augmented reality, will likely play a crucial role in enhancing user experience and further propelling market growth. This presents an opportunity for companies offering advanced virtual event solutions and a continuing need for robust cybersecurity and data privacy measures. Strategic partnerships between event organizers and technology providers will be key to capturing the significant market opportunities that lie ahead.

Virtual Event Industry Market Report: 2019-2033
This comprehensive report provides an in-depth analysis of the Virtual Event Industry, projecting a market value exceeding $XX Million by 2033. It offers invaluable insights for stakeholders, investors, and industry professionals seeking to navigate this rapidly evolving landscape. The report covers the period from 2019 to 2033, with 2025 serving as the base and estimated year. This detailed analysis encompasses market size, segmentation, key players, technological advancements, and future growth prospects. The study period covers the historical period (2019-2024), and the forecast period extends from 2025 to 2033.
Virtual Event Industry Market Composition & Trends
This section evaluates the competitive intensity, innovation drivers, regulatory frameworks, substitute offerings, and end-user characteristics within the virtual event market. The analysis delves into the market share distribution among key players, including Eventxtra, Zoom Video Communications Inc, Cvent Inc, George P Johnson, Cisco Systems Inc, 6Connex International sp z o o, GES, Alive Events Agency, Avaya LLC, Arkadin Cloud Communications, and ALE International (list not exhaustive). We examine the impact of mergers and acquisitions (M&A), analyzing deal values and their influence on market consolidation.
Market Concentration: The market exhibits a moderately concentrated structure with a few major players commanding significant shares, while numerous smaller players cater to niche segments. Precise market share figures for each major player are not available, but data suggests a top 5 market share of approximately 70% as of 2024.
Innovation Catalysts: Ongoing technological advancements, such as advancements in VR/AR and AI-powered engagement tools, are driving innovation and pushing the boundaries of virtual event experiences. The emergence of metaverse platforms also signifies a disruptive force.
Regulatory Landscape: Data privacy regulations and accessibility standards significantly influence the market's trajectory. Compliance costs and potential legal hurdles impact operations and expansion plans.
Substitute Products: Traditional in-person events and alternative online communication platforms pose competitive threats, however, the unique capabilities of virtual events in terms of scalability, cost efficiency, and global reach present a strong competitive advantage.
M&A Activity: The industry has witnessed considerable M&A activity in recent years, with deal values exceeding $XX Million. This trend reflects the ongoing market consolidation and the strategic acquisition of innovative technologies and customer bases.
End-User Profiles: The primary end-user segments include educational institutions, enterprises, and various organizations, with diverse needs and preferences driving specific product and service offerings.

Virtual Event Industry Industry Evolution
This section charts the evolution of the virtual event industry, analyzing market growth trajectories, technological advancements, and the changing preferences of event organizers and attendees. The industry's rapid growth from 2019 to 2024 showcases its resilience and adaptability. The period from 2025 to 2033 will witness accelerated growth owing to technological improvements and changing consumer demand.
The post-pandemic era has been a major catalyst for increased adoption. The global shift towards hybrid and remote working models has broadened the appeal and necessity of virtual events across multiple industries. Technological advancements like improved streaming capabilities, interactive features (e.g., polls, Q&A), enhanced networking tools, and better analytics have continually enhanced user experience. Increased demand for personalized virtual event experiences, along with a focus on enhancing attendee engagement, are shaping industry trends. The compound annual growth rate (CAGR) from 2025 to 2033 is projected to be xx%. The adoption rate of virtual event platforms among businesses is expected to surpass xx% by 2033.
Leading Regions, Countries, or Segments in Virtual Event Industry
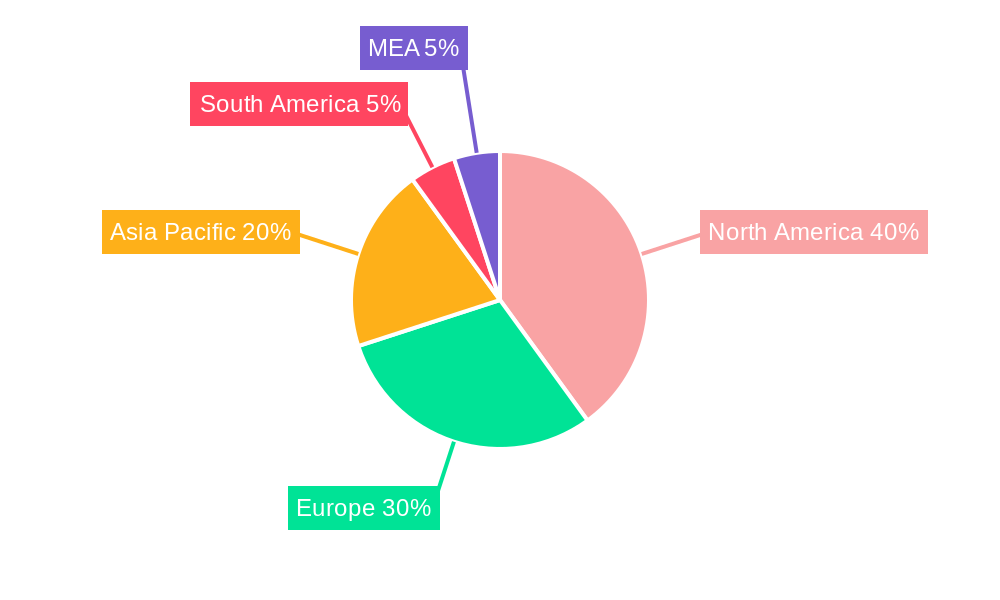
This section pinpoints the leading regions, countries, and market segments within the virtual event landscape. North America and Europe currently hold dominant positions, driven by strong technological infrastructure and high corporate adoption rates. However, the Asia-Pacific region demonstrates substantial growth potential.
Key Drivers:
- Investment Trends: Significant investments in virtual event technology and infrastructure are fueling growth in key regions.
- Regulatory Support: Government initiatives promoting digitalization and remote work are further bolstering market expansion.
Dominance Factors: North America's dominance stems from established tech infrastructure, high corporate adoption rates, and a robust entrepreneurial ecosystem. Europe's strong presence is attributable to a similar level of technological advancement and a high demand for virtual events in various sectors. The Asia-Pacific region demonstrates tremendous potential due to its rapidly expanding digital economy and large population base, although it faces challenges in terms of infrastructure development and digital literacy in certain areas.
Segment Analysis:
Service Type: The Communication segment shows the largest market share, followed closely by Sales & Marketing and Training. Recruitment remains a significant segment with growth potential.
Application: Conferences dominate the application segment, with Exhibitions/Trade Shows and Summits showing consistent growth. The "Others" category represents a diverse collection of niche applications.
End-User Industry: The Enterprise segment currently holds the largest market share, followed by Organizations. Educational institutions are a rapidly growing end-user sector.
Virtual Event Industry Product Innovations
Recent years have witnessed substantial product innovation in the virtual event sector. New platforms integrate advanced features like AI-powered chatbots for enhanced attendee support, immersive 3D environments for enhanced engagement, and sophisticated analytics dashboards to measure event effectiveness. These innovations enhance user experience, improve event management efficiency, and provide valuable insights into attendee behavior. Unique selling propositions include features like seamless integration with CRM systems, customizable branding options, and robust security protocols. The integration of VR/AR technologies is also emerging as a major innovation driver.
Propelling Factors for Virtual Event Industry Growth
Several factors are driving the growth of the virtual event industry. Technological advancements, such as improved video conferencing and virtual reality capabilities, are increasing the quality and accessibility of virtual events. Economically, the cost-effectiveness of virtual events compared to in-person events is a major driver. Furthermore, favorable regulatory environments in certain regions are facilitating industry expansion. The increasing acceptance of remote work and hybrid work models is also a key growth driver.
Obstacles in the Virtual Event Industry Market
Despite its growth, the virtual event industry faces challenges. Regulatory hurdles related to data privacy and security can be costly and complex to navigate. Supply chain disruptions can affect the availability of essential technologies and services. Furthermore, intense competition from existing and emerging players can lead to price wars and margin compression. These factors can limit market growth and profitability.
Future Opportunities in Virtual Event Industry
The virtual event industry holds significant future potential. New markets in developing economies, especially in the Asia-Pacific region, present substantial growth opportunities. The expansion of virtual reality (VR) and augmented reality (AR) technologies offers possibilities for creating more immersive and engaging experiences. Emerging consumer trends towards personalized and interactive event experiences will drive further demand.
Major Players in the Virtual Event Industry Ecosystem
- Eventxtra
- Zoom Video Communications Inc
- Cvent Inc
- George P Johnson
- Cisco Systems Inc
- 6Connex International sp z o o
- GES
- Alive Events Agency
- Avaya LLC
- Arkadin Cloud Communications
- ALE International
Key Developments in Virtual Event Industry Industry
- October 2022: Zoom launched 'Zoom Events' in India, enhancing virtual event capabilities with custom branding options.
- May 2023: VOSMOS launched VOSMOS.Events, a platform for user-created virtual events, offering scalability for events ranging from 100 to over 100,000 participants.
Strategic Virtual Event Industry Market Forecast
The virtual event industry is poised for sustained growth, driven by technological innovation, increasing adoption rates across various sectors, and expanding global reach. The forecast for 2025-2033 indicates a significant market expansion, with notable opportunities in emerging markets and innovative applications of VR/AR technologies. Further consolidation through M&A activity is also expected to shape the industry's competitive landscape.
Virtual Event Industry Segmentation
-
1. Service Type
- 1.1. Communication
- 1.2. Recruitment
- 1.3. Sales and Marketing
- 1.4. Training
-
2. Application
- 2.1. Conferences
- 2.2. Exhibitions/Trade Shows
- 2.3. Summits
- 2.4. Other Applications
-
3. End-User Industry
- 3.1. Educational Institutions
- 3.2. Enterprise
- 3.3. Organizations
- 3.4. Other End-User Industries
Virtual Event Industry Segmentation By Geography
- 1. North America
- 2. Europe
- 3. Asia
- 4. Australia and New Zealand
- 5. Latin America
- 6. Middle East and Africa
Virtual Event Industry REPORT HIGHLIGHTS
| Aspects | Details |
|---|---|
| Study Period | 2019-2033 |
| Base Year | 2024 |
| Estimated Year | 2025 |
| Forecast Period | 2025-2033 |
| Historical Period | 2019-2024 |
| Growth Rate | CAGR of 24.92% from 2019-2033 |
| Segmentation |
|
Table of Contents
- 1. Introduction
- 1.1. Research Scope
- 1.2. Market Segmentation
- 1.3. Research Methodology
- 1.4. Definitions and Assumptions
- 2. Executive Summary
- 2.1. Introduction
- 3. Market Dynamics
- 3.1. Introduction
- 3.2. Market Drivers
- 3.2.1 Technology Advancements such as Growing Acceptance of Unified Communication as a Service (UCAAS)
- 3.2.2 VR
- 3.2.3 etc.; Increased Frequency of Business Events; Global Reach
- 3.2.4 Accessibility
- 3.2.5 and Cost Efficiency
- 3.3. Market Restrains
- 3.3.1. Data Security and Privacy Issues; Technology Constraints and Experiential Limitations
- 3.4. Market Trends
- 3.4.1. Increased Frequency of Business Events may Drive the Market Growth
- 4. Market Factor Analysis
- 4.1. Porters Five Forces
- 4.2. Supply/Value Chain
- 4.3. PESTEL analysis
- 4.4. Market Entropy
- 4.5. Patent/Trademark Analysis
- 5. Global Virtual Event Industry Analysis, Insights and Forecast, 2019-2031
- 5.1. Market Analysis, Insights and Forecast - by Service Type
- 5.1.1. Communication
- 5.1.2. Recruitment
- 5.1.3. Sales and Marketing
- 5.1.4. Training
- 5.2. Market Analysis, Insights and Forecast - by Application
- 5.2.1. Conferences
- 5.2.2. Exhibitions/Trade Shows
- 5.2.3. Summits
- 5.2.4. Other Applications
- 5.3. Market Analysis, Insights and Forecast - by End-User Industry
- 5.3.1. Educational Institutions
- 5.3.2. Enterprise
- 5.3.3. Organizations
- 5.3.4. Other End-User Industries
- 5.4. Market Analysis, Insights and Forecast - by Region
- 5.4.1. North America
- 5.4.2. Europe
- 5.4.3. Asia
- 5.4.4. Australia and New Zealand
- 5.4.5. Latin America
- 5.4.6. Middle East and Africa
- 5.1. Market Analysis, Insights and Forecast - by Service Type
- 6. North America Virtual Event Industry Analysis, Insights and Forecast, 2019-2031
- 6.1. Market Analysis, Insights and Forecast - by Service Type
- 6.1.1. Communication
- 6.1.2. Recruitment
- 6.1.3. Sales and Marketing
- 6.1.4. Training
- 6.2. Market Analysis, Insights and Forecast - by Application
- 6.2.1. Conferences
- 6.2.2. Exhibitions/Trade Shows
- 6.2.3. Summits
- 6.2.4. Other Applications
- 6.3. Market Analysis, Insights and Forecast - by End-User Industry
- 6.3.1. Educational Institutions
- 6.3.2. Enterprise
- 6.3.3. Organizations
- 6.3.4. Other End-User Industries
- 6.1. Market Analysis, Insights and Forecast - by Service Type
- 7. Europe Virtual Event Industry Analysis, Insights and Forecast, 2019-2031
- 7.1. Market Analysis, Insights and Forecast - by Service Type
- 7.1.1. Communication
- 7.1.2. Recruitment
- 7.1.3. Sales and Marketing
- 7.1.4. Training
- 7.2. Market Analysis, Insights and Forecast - by Application
- 7.2.1. Conferences
- 7.2.2. Exhibitions/Trade Shows
- 7.2.3. Summits
- 7.2.4. Other Applications
- 7.3. Market Analysis, Insights and Forecast - by End-User Industry
- 7.3.1. Educational Institutions
- 7.3.2. Enterprise
- 7.3.3. Organizations
- 7.3.4. Other End-User Industries
- 7.1. Market Analysis, Insights and Forecast - by Service Type
- 8. Asia Virtual Event Industry Analysis, Insights and Forecast, 2019-2031
- 8.1. Market Analysis, Insights and Forecast - by Service Type
- 8.1.1. Communication
- 8.1.2. Recruitment
- 8.1.3. Sales and Marketing
- 8.1.4. Training
- 8.2. Market Analysis, Insights and Forecast - by Application
- 8.2.1. Conferences
- 8.2.2. Exhibitions/Trade Shows
- 8.2.3. Summits
- 8.2.4. Other Applications
- 8.3. Market Analysis, Insights and Forecast - by End-User Industry
- 8.3.1. Educational Institutions
- 8.3.2. Enterprise
- 8.3.3. Organizations
- 8.3.4. Other End-User Industries
- 8.1. Market Analysis, Insights and Forecast - by Service Type
- 9. Australia and New Zealand Virtual Event Industry Analysis, Insights and Forecast, 2019-2031
- 9.1. Market Analysis, Insights and Forecast - by Service Type
- 9.1.1. Communication
- 9.1.2. Recruitment
- 9.1.3. Sales and Marketing
- 9.1.4. Training
- 9.2. Market Analysis, Insights and Forecast - by Application
- 9.2.1. Conferences
- 9.2.2. Exhibitions/Trade Shows
- 9.2.3. Summits
- 9.2.4. Other Applications
- 9.3. Market Analysis, Insights and Forecast - by End-User Industry
- 9.3.1. Educational Institutions
- 9.3.2. Enterprise
- 9.3.3. Organizations
- 9.3.4. Other End-User Industries
- 9.1. Market Analysis, Insights and Forecast - by Service Type
- 10. Latin America Virtual Event Industry Analysis, Insights and Forecast, 2019-2031
- 10.1. Market Analysis, Insights and Forecast - by Service Type
- 10.1.1. Communication
- 10.1.2. Recruitment
- 10.1.3. Sales and Marketing
- 10.1.4. Training
- 10.2. Market Analysis, Insights and Forecast - by Application
- 10.2.1. Conferences
- 10.2.2. Exhibitions/Trade Shows
- 10.2.3. Summits
- 10.2.4. Other Applications
- 10.3. Market Analysis, Insights and Forecast - by End-User Industry
- 10.3.1. Educational Institutions
- 10.3.2. Enterprise
- 10.3.3. Organizations
- 10.3.4. Other End-User Industries
- 10.1. Market Analysis, Insights and Forecast - by Service Type
- 11. Middle East and Africa Virtual Event Industry Analysis, Insights and Forecast, 2019-2031
- 11.1. Market Analysis, Insights and Forecast - by Service Type
- 11.1.1. Communication
- 11.1.2. Recruitment
- 11.1.3. Sales and Marketing
- 11.1.4. Training
- 11.2. Market Analysis, Insights and Forecast - by Application
- 11.2.1. Conferences
- 11.2.2. Exhibitions/Trade Shows
- 11.2.3. Summits
- 11.2.4. Other Applications
- 11.3. Market Analysis, Insights and Forecast - by End-User Industry
- 11.3.1. Educational Institutions
- 11.3.2. Enterprise
- 11.3.3. Organizations
- 11.3.4. Other End-User Industries
- 11.1. Market Analysis, Insights and Forecast - by Service Type
- 12. North America Virtual Event Industry Analysis, Insights and Forecast, 2019-2031
- 12.1. Market Analysis, Insights and Forecast - By Country/Sub-region
- 12.1.1 United States
- 12.1.2 Canada
- 12.1.3 Mexico
- 13. Europe Virtual Event Industry Analysis, Insights and Forecast, 2019-2031
- 13.1. Market Analysis, Insights and Forecast - By Country/Sub-region
- 13.1.1 Germany
- 13.1.2 United Kingdom
- 13.1.3 France
- 13.1.4 Spain
- 13.1.5 Italy
- 13.1.6 Spain
- 13.1.7 Belgium
- 13.1.8 Netherland
- 13.1.9 Nordics
- 13.1.10 Rest of Europe
- 14. Asia Pacific Virtual Event Industry Analysis, Insights and Forecast, 2019-2031
- 14.1. Market Analysis, Insights and Forecast - By Country/Sub-region
- 14.1.1 China
- 14.1.2 Japan
- 14.1.3 India
- 14.1.4 South Korea
- 14.1.5 Southeast Asia
- 14.1.6 Australia
- 14.1.7 Indonesia
- 14.1.8 Phillipes
- 14.1.9 Singapore
- 14.1.10 Thailandc
- 14.1.11 Rest of Asia Pacific
- 15. South America Virtual Event Industry Analysis, Insights and Forecast, 2019-2031
- 15.1. Market Analysis, Insights and Forecast - By Country/Sub-region
- 15.1.1 Brazil
- 15.1.2 Argentina
- 15.1.3 Peru
- 15.1.4 Chile
- 15.1.5 Colombia
- 15.1.6 Ecuador
- 15.1.7 Venezuela
- 15.1.8 Rest of South America
- 16. North America Virtual Event Industry Analysis, Insights and Forecast, 2019-2031
- 16.1. Market Analysis, Insights and Forecast - By Country/Sub-region
- 16.1.1 United States
- 16.1.2 Canada
- 16.1.3 Mexico
- 17. MEA Virtual Event Industry Analysis, Insights and Forecast, 2019-2031
- 17.1. Market Analysis, Insights and Forecast - By Country/Sub-region
- 17.1.1 United Arab Emirates
- 17.1.2 Saudi Arabia
- 17.1.3 South Africa
- 17.1.4 Rest of Middle East and Africa
- 18. Competitive Analysis
- 18.1. Global Market Share Analysis 2024
- 18.2. Company Profiles
- 18.2.1 Eventxtra
- 18.2.1.1. Overview
- 18.2.1.2. Products
- 18.2.1.3. SWOT Analysis
- 18.2.1.4. Recent Developments
- 18.2.1.5. Financials (Based on Availability)
- 18.2.2 Zoom Video Communications Inc
- 18.2.2.1. Overview
- 18.2.2.2. Products
- 18.2.2.3. SWOT Analysis
- 18.2.2.4. Recent Developments
- 18.2.2.5. Financials (Based on Availability)
- 18.2.3 Cvent Inc
- 18.2.3.1. Overview
- 18.2.3.2. Products
- 18.2.3.3. SWOT Analysis
- 18.2.3.4. Recent Developments
- 18.2.3.5. Financials (Based on Availability)
- 18.2.4 George P Johnson
- 18.2.4.1. Overview
- 18.2.4.2. Products
- 18.2.4.3. SWOT Analysis
- 18.2.4.4. Recent Developments
- 18.2.4.5. Financials (Based on Availability)
- 18.2.5 Cisco Systems Inc
- 18.2.5.1. Overview
- 18.2.5.2. Products
- 18.2.5.3. SWOT Analysis
- 18.2.5.4. Recent Developments
- 18.2.5.5. Financials (Based on Availability)
- 18.2.6 6Connex International sp z o o
- 18.2.6.1. Overview
- 18.2.6.2. Products
- 18.2.6.3. SWOT Analysis
- 18.2.6.4. Recent Developments
- 18.2.6.5. Financials (Based on Availability)
- 18.2.7 GES*List Not Exhaustive
- 18.2.7.1. Overview
- 18.2.7.2. Products
- 18.2.7.3. SWOT Analysis
- 18.2.7.4. Recent Developments
- 18.2.7.5. Financials (Based on Availability)
- 18.2.8 Alive Events Agency
- 18.2.8.1. Overview
- 18.2.8.2. Products
- 18.2.8.3. SWOT Analysis
- 18.2.8.4. Recent Developments
- 18.2.8.5. Financials (Based on Availability)
- 18.2.9 Avaya LLC
- 18.2.9.1. Overview
- 18.2.9.2. Products
- 18.2.9.3. SWOT Analysis
- 18.2.9.4. Recent Developments
- 18.2.9.5. Financials (Based on Availability)
- 18.2.10 Arkadin Cloud Communications
- 18.2.10.1. Overview
- 18.2.10.2. Products
- 18.2.10.3. SWOT Analysis
- 18.2.10.4. Recent Developments
- 18.2.10.5. Financials (Based on Availability)
- 18.2.11 ALE International
- 18.2.11.1. Overview
- 18.2.11.2. Products
- 18.2.11.3. SWOT Analysis
- 18.2.11.4. Recent Developments
- 18.2.11.5. Financials (Based on Availability)
- 18.2.1 Eventxtra
List of Figures
- Figure 1: Global Virtual Event Industry Revenue Breakdown (Million, %) by Region 2024 & 2032
- Figure 2: North America Virtual Event Industry Revenue (Million), by Country 2024 & 2032
- Figure 3: North America Virtual Event Industry Revenue Share (%), by Country 2024 & 2032
- Figure 4: Europe Virtual Event Industry Revenue (Million), by Country 2024 & 2032
- Figure 5: Europe Virtual Event Industry Revenue Share (%), by Country 2024 & 2032
- Figure 6: Asia Pacific Virtual Event Industry Revenue (Million), by Country 2024 & 2032
- Figure 7: Asia Pacific Virtual Event Industry Revenue Share (%), by Country 2024 & 2032
- Figure 8: South America Virtual Event Industry Revenue (Million), by Country 2024 & 2032
- Figure 9: South America Virtual Event Industry Revenue Share (%), by Country 2024 & 2032
- Figure 10: North America Virtual Event Industry Revenue (Million), by Country 2024 & 2032
- Figure 11: North America Virtual Event Industry Revenue Share (%), by Country 2024 & 2032
- Figure 12: MEA Virtual Event Industry Revenue (Million), by Country 2024 & 2032
- Figure 13: MEA Virtual Event Industry Revenue Share (%), by Country 2024 & 2032
- Figure 14: North America Virtual Event Industry Revenue (Million), by Service Type 2024 & 2032
- Figure 15: North America Virtual Event Industry Revenue Share (%), by Service Type 2024 & 2032
- Figure 16: North America Virtual Event Industry Revenue (Million), by Application 2024 & 2032
- Figure 17: North America Virtual Event Industry Revenue Share (%), by Application 2024 & 2032
- Figure 18: North America Virtual Event Industry Revenue (Million), by End-User Industry 2024 & 2032
- Figure 19: North America Virtual Event Industry Revenue Share (%), by End-User Industry 2024 & 2032
- Figure 20: North America Virtual Event Industry Revenue (Million), by Country 2024 & 2032
- Figure 21: North America Virtual Event Industry Revenue Share (%), by Country 2024 & 2032
- Figure 22: Europe Virtual Event Industry Revenue (Million), by Service Type 2024 & 2032
- Figure 23: Europe Virtual Event Industry Revenue Share (%), by Service Type 2024 & 2032
- Figure 24: Europe Virtual Event Industry Revenue (Million), by Application 2024 & 2032
- Figure 25: Europe Virtual Event Industry Revenue Share (%), by Application 2024 & 2032
- Figure 26: Europe Virtual Event Industry Revenue (Million), by End-User Industry 2024 & 2032
- Figure 27: Europe Virtual Event Industry Revenue Share (%), by End-User Industry 2024 & 2032
- Figure 28: Europe Virtual Event Industry Revenue (Million), by Country 2024 & 2032
- Figure 29: Europe Virtual Event Industry Revenue Share (%), by Country 2024 & 2032
- Figure 30: Asia Virtual Event Industry Revenue (Million), by Service Type 2024 & 2032
- Figure 31: Asia Virtual Event Industry Revenue Share (%), by Service Type 2024 & 2032
- Figure 32: Asia Virtual Event Industry Revenue (Million), by Application 2024 & 2032
- Figure 33: Asia Virtual Event Industry Revenue Share (%), by Application 2024 & 2032
- Figure 34: Asia Virtual Event Industry Revenue (Million), by End-User Industry 2024 & 2032
- Figure 35: Asia Virtual Event Industry Revenue Share (%), by End-User Industry 2024 & 2032
- Figure 36: Asia Virtual Event Industry Revenue (Million), by Country 2024 & 2032
- Figure 37: Asia Virtual Event Industry Revenue Share (%), by Country 2024 & 2032
- Figure 38: Australia and New Zealand Virtual Event Industry Revenue (Million), by Service Type 2024 & 2032
- Figure 39: Australia and New Zealand Virtual Event Industry Revenue Share (%), by Service Type 2024 & 2032
- Figure 40: Australia and New Zealand Virtual Event Industry Revenue (Million), by Application 2024 & 2032
- Figure 41: Australia and New Zealand Virtual Event Industry Revenue Share (%), by Application 2024 & 2032
- Figure 42: Australia and New Zealand Virtual Event Industry Revenue (Million), by End-User Industry 2024 & 2032
- Figure 43: Australia and New Zealand Virtual Event Industry Revenue Share (%), by End-User Industry 2024 & 2032
- Figure 44: Australia and New Zealand Virtual Event Industry Revenue (Million), by Country 2024 & 2032
- Figure 45: Australia and New Zealand Virtual Event Industry Revenue Share (%), by Country 2024 & 2032
- Figure 46: Latin America Virtual Event Industry Revenue (Million), by Service Type 2024 & 2032
- Figure 47: Latin America Virtual Event Industry Revenue Share (%), by Service Type 2024 & 2032
- Figure 48: Latin America Virtual Event Industry Revenue (Million), by Application 2024 & 2032
- Figure 49: Latin America Virtual Event Industry Revenue Share (%), by Application 2024 & 2032
- Figure 50: Latin America Virtual Event Industry Revenue (Million), by End-User Industry 2024 & 2032
- Figure 51: Latin America Virtual Event Industry Revenue Share (%), by End-User Industry 2024 & 2032
- Figure 52: Latin America Virtual Event Industry Revenue (Million), by Country 2024 & 2032
- Figure 53: Latin America Virtual Event Industry Revenue Share (%), by Country 2024 & 2032
- Figure 54: Middle East and Africa Virtual Event Industry Revenue (Million), by Service Type 2024 & 2032
- Figure 55: Middle East and Africa Virtual Event Industry Revenue Share (%), by Service Type 2024 & 2032
- Figure 56: Middle East and Africa Virtual Event Industry Revenue (Million), by Application 2024 & 2032
- Figure 57: Middle East and Africa Virtual Event Industry Revenue Share (%), by Application 2024 & 2032
- Figure 58: Middle East and Africa Virtual Event Industry Revenue (Million), by End-User Industry 2024 & 2032
- Figure 59: Middle East and Africa Virtual Event Industry Revenue Share (%), by End-User Industry 2024 & 2032
- Figure 60: Middle East and Africa Virtual Event Industry Revenue (Million), by Country 2024 & 2032
- Figure 61: Middle East and Africa Virtual Event Industry Revenue Share (%), by Country 2024 & 2032
List of Tables
- Table 1: Global Virtual Event Industry Revenue Million Forecast, by Region 2019 & 2032
- Table 2: Global Virtual Event Industry Revenue Million Forecast, by Service Type 2019 & 2032
- Table 3: Global Virtual Event Industry Revenue Million Forecast, by Application 2019 & 2032
- Table 4: Global Virtual Event Industry Revenue Million Forecast, by End-User Industry 2019 & 2032
- Table 5: Global Virtual Event Industry Revenue Million Forecast, by Region 2019 & 2032
- Table 6: Global Virtual Event Industry Revenue Million Forecast, by Country 2019 & 2032
- Table 7: United States Virtual Event Industry Revenue (Million) Forecast, by Application 2019 & 2032
- Table 8: Canada Virtual Event Industry Revenue (Million) Forecast, by Application 2019 & 2032
- Table 9: Mexico Virtual Event Industry Revenue (Million) Forecast, by Application 2019 & 2032
- Table 10: Global Virtual Event Industry Revenue Million Forecast, by Country 2019 & 2032
- Table 11: Germany Virtual Event Industry Revenue (Million) Forecast, by Application 2019 & 2032
- Table 12: United Kingdom Virtual Event Industry Revenue (Million) Forecast, by Application 2019 & 2032
- Table 13: France Virtual Event Industry Revenue (Million) Forecast, by Application 2019 & 2032
- Table 14: Spain Virtual Event Industry Revenue (Million) Forecast, by Application 2019 & 2032
- Table 15: Italy Virtual Event Industry Revenue (Million) Forecast, by Application 2019 & 2032
- Table 16: Spain Virtual Event Industry Revenue (Million) Forecast, by Application 2019 & 2032
- Table 17: Belgium Virtual Event Industry Revenue (Million) Forecast, by Application 2019 & 2032
- Table 18: Netherland Virtual Event Industry Revenue (Million) Forecast, by Application 2019 & 2032
- Table 19: Nordics Virtual Event Industry Revenue (Million) Forecast, by Application 2019 & 2032
- Table 20: Rest of Europe Virtual Event Industry Revenue (Million) Forecast, by Application 2019 & 2032
- Table 21: Global Virtual Event Industry Revenue Million Forecast, by Country 2019 & 2032
- Table 22: China Virtual Event Industry Revenue (Million) Forecast, by Application 2019 & 2032
- Table 23: Japan Virtual Event Industry Revenue (Million) Forecast, by Application 2019 & 2032
- Table 24: India Virtual Event Industry Revenue (Million) Forecast, by Application 2019 & 2032
- Table 25: South Korea Virtual Event Industry Revenue (Million) Forecast, by Application 2019 & 2032
- Table 26: Southeast Asia Virtual Event Industry Revenue (Million) Forecast, by Application 2019 & 2032
- Table 27: Australia Virtual Event Industry Revenue (Million) Forecast, by Application 2019 & 2032
- Table 28: Indonesia Virtual Event Industry Revenue (Million) Forecast, by Application 2019 & 2032
- Table 29: Phillipes Virtual Event Industry Revenue (Million) Forecast, by Application 2019 & 2032
- Table 30: Singapore Virtual Event Industry Revenue (Million) Forecast, by Application 2019 & 2032
- Table 31: Thailandc Virtual Event Industry Revenue (Million) Forecast, by Application 2019 & 2032
- Table 32: Rest of Asia Pacific Virtual Event Industry Revenue (Million) Forecast, by Application 2019 & 2032
- Table 33: Global Virtual Event Industry Revenue Million Forecast, by Country 2019 & 2032
- Table 34: Brazil Virtual Event Industry Revenue (Million) Forecast, by Application 2019 & 2032
- Table 35: Argentina Virtual Event Industry Revenue (Million) Forecast, by Application 2019 & 2032
- Table 36: Peru Virtual Event Industry Revenue (Million) Forecast, by Application 2019 & 2032
- Table 37: Chile Virtual Event Industry Revenue (Million) Forecast, by Application 2019 & 2032
- Table 38: Colombia Virtual Event Industry Revenue (Million) Forecast, by Application 2019 & 2032
- Table 39: Ecuador Virtual Event Industry Revenue (Million) Forecast, by Application 2019 & 2032
- Table 40: Venezuela Virtual Event Industry Revenue (Million) Forecast, by Application 2019 & 2032
- Table 41: Rest of South America Virtual Event Industry Revenue (Million) Forecast, by Application 2019 & 2032
- Table 42: Global Virtual Event Industry Revenue Million Forecast, by Country 2019 & 2032
- Table 43: United States Virtual Event Industry Revenue (Million) Forecast, by Application 2019 & 2032
- Table 44: Canada Virtual Event Industry Revenue (Million) Forecast, by Application 2019 & 2032
- Table 45: Mexico Virtual Event Industry Revenue (Million) Forecast, by Application 2019 & 2032
- Table 46: Global Virtual Event Industry Revenue Million Forecast, by Country 2019 & 2032
- Table 47: United Arab Emirates Virtual Event Industry Revenue (Million) Forecast, by Application 2019 & 2032
- Table 48: Saudi Arabia Virtual Event Industry Revenue (Million) Forecast, by Application 2019 & 2032
- Table 49: South Africa Virtual Event Industry Revenue (Million) Forecast, by Application 2019 & 2032
- Table 50: Rest of Middle East and Africa Virtual Event Industry Revenue (Million) Forecast, by Application 2019 & 2032
- Table 51: Global Virtual Event Industry Revenue Million Forecast, by Service Type 2019 & 2032
- Table 52: Global Virtual Event Industry Revenue Million Forecast, by Application 2019 & 2032
- Table 53: Global Virtual Event Industry Revenue Million Forecast, by End-User Industry 2019 & 2032
- Table 54: Global Virtual Event Industry Revenue Million Forecast, by Country 2019 & 2032
- Table 55: Global Virtual Event Industry Revenue Million Forecast, by Service Type 2019 & 2032
- Table 56: Global Virtual Event Industry Revenue Million Forecast, by Application 2019 & 2032
- Table 57: Global Virtual Event Industry Revenue Million Forecast, by End-User Industry 2019 & 2032
- Table 58: Global Virtual Event Industry Revenue Million Forecast, by Country 2019 & 2032
- Table 59: Global Virtual Event Industry Revenue Million Forecast, by Service Type 2019 & 2032
- Table 60: Global Virtual Event Industry Revenue Million Forecast, by Application 2019 & 2032
- Table 61: Global Virtual Event Industry Revenue Million Forecast, by End-User Industry 2019 & 2032
- Table 62: Global Virtual Event Industry Revenue Million Forecast, by Country 2019 & 2032
- Table 63: Global Virtual Event Industry Revenue Million Forecast, by Service Type 2019 & 2032
- Table 64: Global Virtual Event Industry Revenue Million Forecast, by Application 2019 & 2032
- Table 65: Global Virtual Event Industry Revenue Million Forecast, by End-User Industry 2019 & 2032
- Table 66: Global Virtual Event Industry Revenue Million Forecast, by Country 2019 & 2032
- Table 67: Global Virtual Event Industry Revenue Million Forecast, by Service Type 2019 & 2032
- Table 68: Global Virtual Event Industry Revenue Million Forecast, by Application 2019 & 2032
- Table 69: Global Virtual Event Industry Revenue Million Forecast, by End-User Industry 2019 & 2032
- Table 70: Global Virtual Event Industry Revenue Million Forecast, by Country 2019 & 2032
- Table 71: Global Virtual Event Industry Revenue Million Forecast, by Service Type 2019 & 2032
- Table 72: Global Virtual Event Industry Revenue Million Forecast, by Application 2019 & 2032
- Table 73: Global Virtual Event Industry Revenue Million Forecast, by End-User Industry 2019 & 2032
- Table 74: Global Virtual Event Industry Revenue Million Forecast, by Country 2019 & 2032
Frequently Asked Questions
1. What is the projected Compound Annual Growth Rate (CAGR) of the Virtual Event Industry?
The projected CAGR is approximately 24.92%.
2. Which companies are prominent players in the Virtual Event Industry?
Key companies in the market include Eventxtra, Zoom Video Communications Inc, Cvent Inc, George P Johnson, Cisco Systems Inc, 6Connex International sp z o o, GES*List Not Exhaustive, Alive Events Agency, Avaya LLC, Arkadin Cloud Communications, ALE International.
3. What are the main segments of the Virtual Event Industry?
The market segments include Service Type, Application, End-User Industry.
4. Can you provide details about the market size?
The market size is estimated to be USD 216.12 Million as of 2022.
5. What are some drivers contributing to market growth?
Technology Advancements such as Growing Acceptance of Unified Communication as a Service (UCAAS). VR. etc.; Increased Frequency of Business Events; Global Reach. Accessibility. and Cost Efficiency.
6. What are the notable trends driving market growth?
Increased Frequency of Business Events may Drive the Market Growth.
7. Are there any restraints impacting market growth?
Data Security and Privacy Issues; Technology Constraints and Experiential Limitations.
8. Can you provide examples of recent developments in the market?
May 2023: Tech startup VOSMOS, which focuses on the metaverse and virtual experiences, has introduced VOSMOS. Events, a platform for user-created virtual events Individuals and organizations may organize dynamic, secure virtual events of any size with the help of VOSMOS.Events. The offering, created by the Indian company VOSMOS, provides a subscription-based business model and allows customers to conduct virtual events with anywhere between 100 and more than 1 lakh participants.
9. What pricing options are available for accessing the report?
Pricing options include single-user, multi-user, and enterprise licenses priced at USD 4750, USD 5250, and USD 8750 respectively.
10. Is the market size provided in terms of value or volume?
The market size is provided in terms of value, measured in Million.
11. Are there any specific market keywords associated with the report?
Yes, the market keyword associated with the report is "Virtual Event Industry," which aids in identifying and referencing the specific market segment covered.
12. How do I determine which pricing option suits my needs best?
The pricing options vary based on user requirements and access needs. Individual users may opt for single-user licenses, while businesses requiring broader access may choose multi-user or enterprise licenses for cost-effective access to the report.
13. Are there any additional resources or data provided in the Virtual Event Industry report?
While the report offers comprehensive insights, it's advisable to review the specific contents or supplementary materials provided to ascertain if additional resources or data are available.
14. How can I stay updated on further developments or reports in the Virtual Event Industry?
To stay informed about further developments, trends, and reports in the Virtual Event Industry, consider subscribing to industry newsletters, following relevant companies and organizations, or regularly checking reputable industry news sources and publications.
Methodology
Step 1 - Identification of Relevant Samples Size from Population Database


Step 2 - Approaches for Defining Global Market Size (Value, Volume* & Price*)

Note*: In applicable scenarios
Step 3 - Data Sources
Primary Research
- Web Analytics
- Survey Reports
- Research Institute
- Latest Research Reports
- Opinion Leaders
Secondary Research
- Annual Reports
- White Paper
- Latest Press Release
- Industry Association
- Paid Database
- Investor Presentations

Step 4 - Data Triangulation
Involves using different sources of information in order to increase the validity of a study
These sources are likely to be stakeholders in a program - participants, other researchers, program staff, other community members, and so on.
Then we put all data in single framework & apply various statistical tools to find out the dynamic on the market.
During the analysis stage, feedback from the stakeholder groups would be compared to determine areas of agreement as well as areas of divergence
