

Key Insights
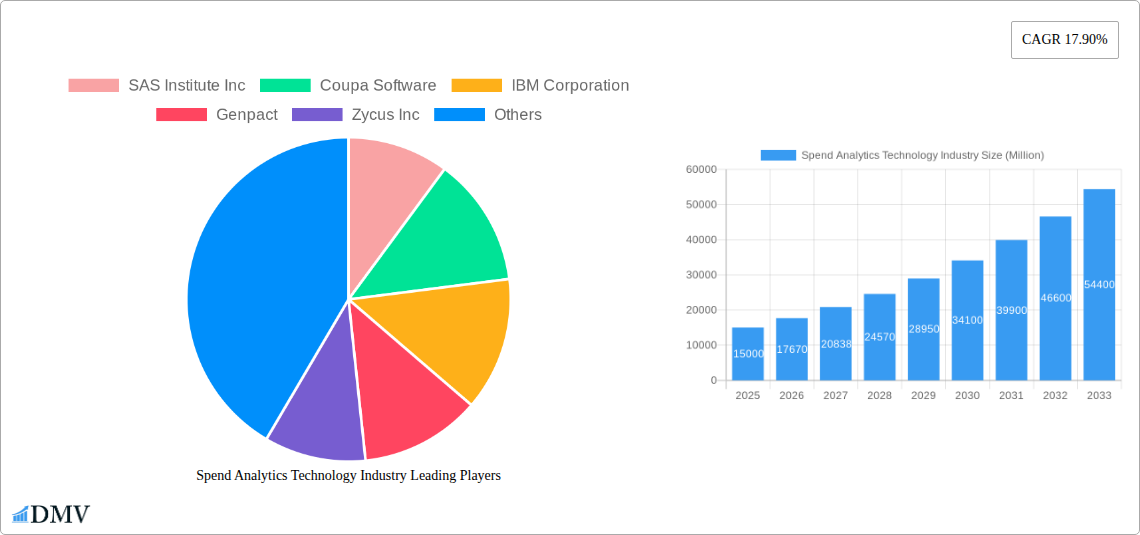
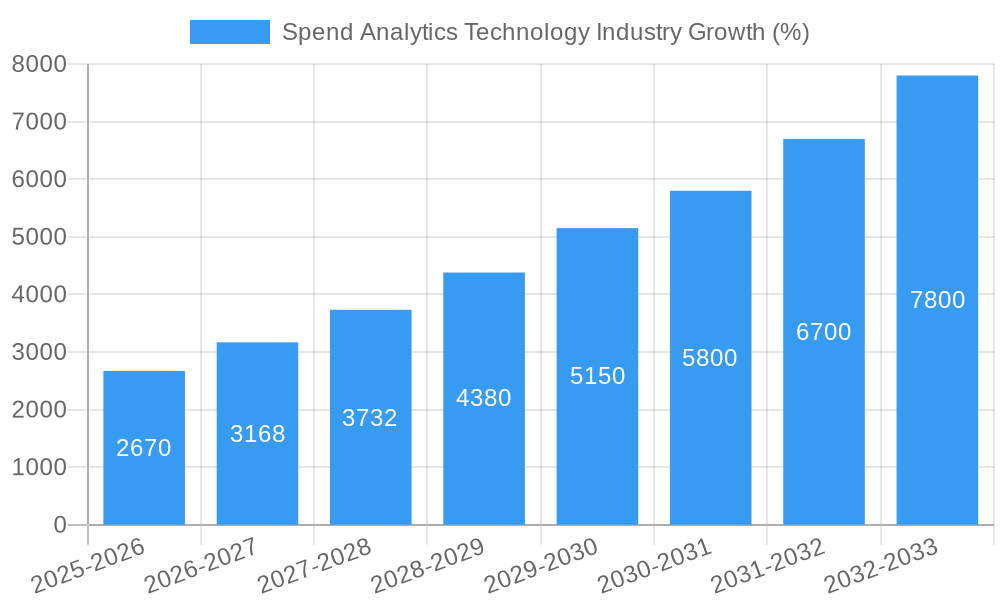
The Spend Analytics Technology market is experiencing robust growth, projected to reach a substantial size by 2033. A Compound Annual Growth Rate (CAGR) of 17.90% from 2025 to 2033 indicates significant market expansion driven by several factors. The increasing need for organizations across diverse sectors—including manufacturing, supply chain & logistics, retail, BFSI (Banking, Financial Services, and Insurance), IT & telecommunications, education, and healthcare—to optimize spending and enhance procurement efficiency fuels this growth. Businesses are increasingly adopting spend analytics solutions to gain better visibility into their expenditures, identify cost-saving opportunities, negotiate better supplier contracts, and improve overall financial performance. The shift towards cloud-based deployments further accelerates adoption, offering scalability, accessibility, and reduced infrastructure costs. The market is segmented by type (software and service), analysis (descriptive, prescriptive, and predictive), and deployment (on-premise and cloud), allowing businesses to select solutions tailored to their specific needs and technological capabilities. Leading vendors like SAS Institute Inc., Coupa Software, IBM Corporation, and others are contributing to market innovation through continuous product development and strategic partnerships. The competitive landscape is dynamic, with both established players and emerging companies vying for market share. Geographical expansion, particularly in developing economies with growing digitalization, presents further growth opportunities.
While significant opportunities exist, certain challenges remain. Integration complexities with existing enterprise resource planning (ERP) systems and the need for skilled professionals to effectively utilize these sophisticated tools represent potential obstacles to wider adoption. Data security and privacy concerns also need to be addressed to build trust and confidence among users. However, the overall market outlook remains positive, with continuous innovation and increasing awareness of the benefits driving sustained growth in the spend analytics technology sector. The prescriptive and predictive analytics segments are anticipated to experience particularly strong growth due to their ability to offer actionable insights and proactive cost management capabilities.
Spend Analytics Technology Industry Market Report: 2019-2033
This comprehensive report provides an in-depth analysis of the Spend Analytics Technology industry, projecting a market value of $XX Million by 2033. The study covers the historical period (2019-2024), base year (2025), and forecast period (2025-2033), offering valuable insights for stakeholders seeking to navigate this rapidly evolving landscape. Key players such as SAS Institute Inc, Coupa Software, IBM Corporation, and others are profiled, revealing market share distribution and strategic maneuvers.
Spend Analytics Technology Industry Market Composition & Trends
The Spend Analytics Technology market, valued at $XX Million in 2024, is experiencing robust growth driven by increasing data volumes, the need for improved cost optimization, and the adoption of advanced analytics. Market concentration is moderate, with a few major players holding significant market share, while numerous smaller players compete in niche segments. Innovation is propelled by advancements in AI, machine learning, and cloud computing, enabling more sophisticated analytics and predictive capabilities. The regulatory landscape varies by region, with evolving data privacy regulations influencing deployment strategies. Substitute products include traditional manual spend analysis methods, but these are gradually being replaced by automated solutions due to efficiency gains. End-user profiles span various industries, with Manufacturing, Retail, and BFSI sectors exhibiting high adoption rates. M&A activity is significant, with deals like SAP SE's acquisition of Askdata (July 2022) and JAGGAER's purchase of DocSkiff Inc. (February 2022) showcasing the strategic importance of expanding capabilities and market reach. These transactions, estimated at a combined value of $XX Million, demonstrate the industry's dynamism.
- Market Share Distribution (2024):
- Top 5 players: XX%
- Remaining players: XX%
- Average M&A Deal Value (2019-2024): $XX Million
- Key Innovation Catalysts: AI, Machine Learning, Cloud Computing
- Regulatory Landscape: Varies by region, with increasing focus on data privacy.
Spend Analytics Technology Industry Industry Evolution
The Spend Analytics Technology market has witnessed exponential growth over the past five years, fueled by a confluence of factors. The increasing complexity of global supply chains and the need for improved cost visibility have driven demand for sophisticated analytical tools. Technological advancements, particularly in AI and machine learning, have enabled the development of predictive analytics capabilities, providing businesses with actionable insights for optimizing spending. Shifting consumer demands, including the preference for cloud-based solutions and self-service analytics, have further shaped market dynamics. The market exhibited a Compound Annual Growth Rate (CAGR) of XX% during the historical period (2019-2024) and is projected to maintain a robust CAGR of XX% throughout the forecast period (2025-2033). Adoption rates are increasing across various sectors, with early adopters in BFSI and Manufacturing driving market expansion. The transition from on-premise to cloud-based deployments is a significant trend, impacting market segmentation and vendor strategies.
Leading Regions, Countries, or Segments in Spend Analytics Technology Industry
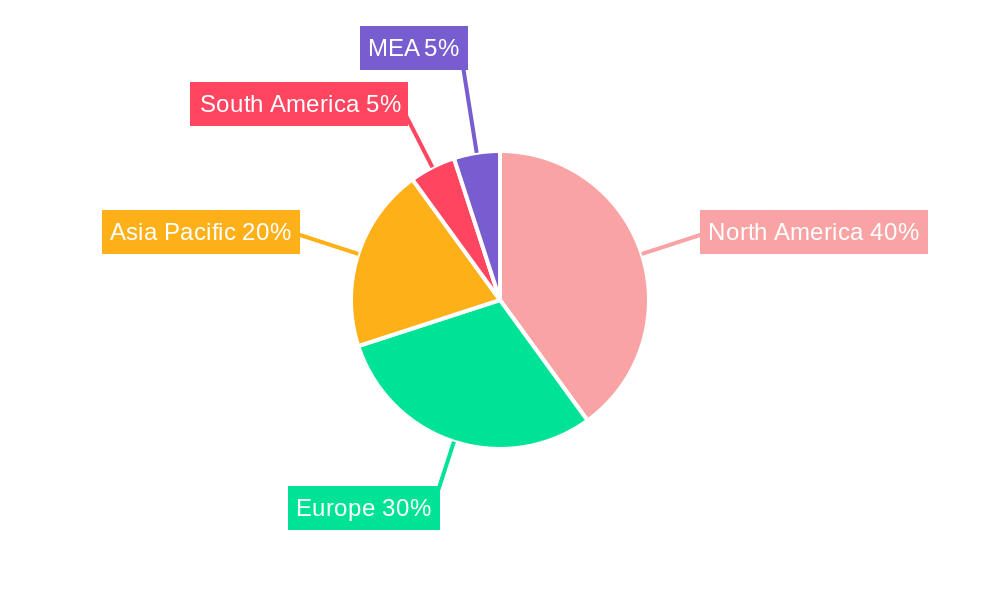
The North American region currently holds the dominant position in the Spend Analytics Technology market, driven by high technological adoption, robust investment in digital transformation initiatives, and a strong presence of major players. However, the Asia-Pacific region is experiencing rapid growth, fueled by increasing digitization across various industries.
- By End-user Industry: Manufacturing and BFSI are currently leading segments, showcasing high demand for spend optimization solutions. Supply Chain & Logistics also demonstrates substantial growth potential.
- By Type: Software solutions dominate the market, owing to their scalability and flexibility. However, service offerings are gaining traction as organizations seek customized implementation and support.
- By Analysis: Descriptive analytics remains prevalent, but demand for prescriptive and predictive analytics is growing rapidly, reflecting a shift towards proactive spend management.
- By Deployment: Cloud-based deployments are rapidly outpacing on-premise solutions due to cost efficiency and scalability advantages.
Key Drivers:
- High Investment in Digital Transformation: Organizations are increasing their IT budgets to upgrade their systems and processes.
- Stringent Regulatory Compliance: Growing regulatory pressure in areas like data privacy is driving adoption of compliance-focused solutions.
Spend Analytics Technology Industry Product Innovations
Recent product innovations focus on enhancing AI and machine learning capabilities for more accurate forecasting, improved data visualization, and seamless integration with existing ERP systems. Unique selling propositions include advanced algorithms for anomaly detection, automated reporting features, and user-friendly interfaces tailored to different business roles. Technological advancements are continuously improving the accuracy, speed, and scope of spend analytics, enabling businesses to identify cost savings and mitigate risks more effectively.
Propelling Factors for Spend Analytics Technology Growth
Several factors fuel the growth of the Spend Analytics Technology industry. Technological advancements such as AI and machine learning provide more precise insights into spending patterns, allowing businesses to optimize costs and improve efficiency. Growing economic pressures incentivize companies to seek cost-effective solutions for managing expenses, while regulatory changes concerning data privacy and compliance necessitate robust data analysis tools. The increasing complexity of global supply chains further contributes to the demand for comprehensive spend visibility and control.
Obstacles in the Spend Analytics Technology Industry Market
The Spend Analytics Technology market faces certain challenges. Data integration complexities across diverse systems can hinder the implementation of effective solutions. The high cost of software licenses and implementation services can create barriers to entry for smaller businesses. Furthermore, competitive pressures from established players and emerging startups necessitate continuous innovation and adaptation to maintain market share. Supply chain disruptions can impact the availability of certain hardware components, potentially delaying project implementation.
Future Opportunities in Spend Analytics Technology Industry
The industry presents considerable future opportunities. Expansion into emerging markets with high growth potential, particularly in developing economies, offers significant prospects. The integration of blockchain technology promises enhanced security and transparency in supply chain transactions, opening up new avenues for spend analytics. The rising adoption of Internet of Things (IoT) devices generates large volumes of data, requiring sophisticated analytics solutions for extracting valuable insights.
Major Players in the Spend Analytics Technology Industry Ecosystem
- SAS Institute Inc
- Coupa Software
- IBM Corporation
- Genpact
- Zycus Inc
- Oracle Corporation
- Empronc Solutions Pvt Ltd
- JAGGAER Incorporation
- Sievo Oy
- Proactis Inc
- SAP SE
Key Developments in Spend Analytics Technology Industry
- July 2022: SAP SE acquired Askdata, enhancing its AI-driven natural language search capabilities for improved decision-making.
- February 2022: JAGGAER acquired DocSkiff Inc., integrating AI-powered contract analysis into its JAGGAER ONE platform.
Strategic Spend Analytics Technology Market Forecast
The Spend Analytics Technology market is poised for sustained growth, driven by ongoing technological advancements, increasing demand for improved cost optimization, and the growing adoption of cloud-based solutions. The market's potential for expansion into new markets and the integration of emerging technologies like blockchain and IoT presents substantial opportunities for growth and innovation. The forecast period anticipates a continued high CAGR, with significant market expansion across various sectors and geographical regions.
Spend Analytics Technology Industry Segmentation
-
1. Type
- 1.1. Software
-
1.2. Service
- 1.2.1. Professional Service
- 1.2.2. Managed Service
-
2. Analysis
- 2.1. Descriptive
- 2.2. Prescriptive
- 2.3. Predictive
-
3. Deployment
- 3.1. On-Premise
- 3.2. Cloud
-
4. End-user Industry
- 4.1. Manufacturing
- 4.2. Supply Chain & Logistic
- 4.3. Retail
- 4.4. BFSI
- 4.5. IT & Telecommunication
- 4.6. Education
- 4.7. Healthcare
- 4.8. Other End-user Industries
Spend Analytics Technology Industry Segmentation By Geography
- 1. North America
- 2. Europe
- 3. Asia Pacific
- 4. Latin America
- 5. Middle East
Spend Analytics Technology Industry REPORT HIGHLIGHTS
| Aspects | Details |
|---|---|
| Study Period | 2019-2033 |
| Base Year | 2024 |
| Estimated Year | 2025 |
| Forecast Period | 2025-2033 |
| Historical Period | 2019-2024 |
| Growth Rate | CAGR of 17.90% from 2019-2033 |
| Segmentation |
|
Table of Contents
- 1. Introduction
- 1.1. Research Scope
- 1.2. Market Segmentation
- 1.3. Research Methodology
- 1.4. Definitions and Assumptions
- 2. Executive Summary
- 2.1. Introduction
- 3. Market Dynamics
- 3.1. Introduction
- 3.2. Market Drivers
- 3.2.1. Rising Adoption in Procurement Process in Industries; Rising Adoption of Cloud Services and Increasing Penetration of IoT Applications
- 3.3. Market Restrains
- 3.3.1. Growing Data Breaches Cases
- 3.4. Market Trends
- 3.4.1. Retail Segment is Expected to Hold Significant Share
- 4. Market Factor Analysis
- 4.1. Porters Five Forces
- 4.2. Supply/Value Chain
- 4.3. PESTEL analysis
- 4.4. Market Entropy
- 4.5. Patent/Trademark Analysis
- 5. Global Spend Analytics Technology Industry Analysis, Insights and Forecast, 2019-2031
- 5.1. Market Analysis, Insights and Forecast - by Type
- 5.1.1. Software
- 5.1.2. Service
- 5.1.2.1. Professional Service
- 5.1.2.2. Managed Service
- 5.2. Market Analysis, Insights and Forecast - by Analysis
- 5.2.1. Descriptive
- 5.2.2. Prescriptive
- 5.2.3. Predictive
- 5.3. Market Analysis, Insights and Forecast - by Deployment
- 5.3.1. On-Premise
- 5.3.2. Cloud
- 5.4. Market Analysis, Insights and Forecast - by End-user Industry
- 5.4.1. Manufacturing
- 5.4.2. Supply Chain & Logistic
- 5.4.3. Retail
- 5.4.4. BFSI
- 5.4.5. IT & Telecommunication
- 5.4.6. Education
- 5.4.7. Healthcare
- 5.4.8. Other End-user Industries
- 5.5. Market Analysis, Insights and Forecast - by Region
- 5.5.1. North America
- 5.5.2. Europe
- 5.5.3. Asia Pacific
- 5.5.4. Latin America
- 5.5.5. Middle East
- 5.1. Market Analysis, Insights and Forecast - by Type
- 6. North America Spend Analytics Technology Industry Analysis, Insights and Forecast, 2019-2031
- 6.1. Market Analysis, Insights and Forecast - by Type
- 6.1.1. Software
- 6.1.2. Service
- 6.1.2.1. Professional Service
- 6.1.2.2. Managed Service
- 6.2. Market Analysis, Insights and Forecast - by Analysis
- 6.2.1. Descriptive
- 6.2.2. Prescriptive
- 6.2.3. Predictive
- 6.3. Market Analysis, Insights and Forecast - by Deployment
- 6.3.1. On-Premise
- 6.3.2. Cloud
- 6.4. Market Analysis, Insights and Forecast - by End-user Industry
- 6.4.1. Manufacturing
- 6.4.2. Supply Chain & Logistic
- 6.4.3. Retail
- 6.4.4. BFSI
- 6.4.5. IT & Telecommunication
- 6.4.6. Education
- 6.4.7. Healthcare
- 6.4.8. Other End-user Industries
- 6.1. Market Analysis, Insights and Forecast - by Type
- 7. Europe Spend Analytics Technology Industry Analysis, Insights and Forecast, 2019-2031
- 7.1. Market Analysis, Insights and Forecast - by Type
- 7.1.1. Software
- 7.1.2. Service
- 7.1.2.1. Professional Service
- 7.1.2.2. Managed Service
- 7.2. Market Analysis, Insights and Forecast - by Analysis
- 7.2.1. Descriptive
- 7.2.2. Prescriptive
- 7.2.3. Predictive
- 7.3. Market Analysis, Insights and Forecast - by Deployment
- 7.3.1. On-Premise
- 7.3.2. Cloud
- 7.4. Market Analysis, Insights and Forecast - by End-user Industry
- 7.4.1. Manufacturing
- 7.4.2. Supply Chain & Logistic
- 7.4.3. Retail
- 7.4.4. BFSI
- 7.4.5. IT & Telecommunication
- 7.4.6. Education
- 7.4.7. Healthcare
- 7.4.8. Other End-user Industries
- 7.1. Market Analysis, Insights and Forecast - by Type
- 8. Asia Pacific Spend Analytics Technology Industry Analysis, Insights and Forecast, 2019-2031
- 8.1. Market Analysis, Insights and Forecast - by Type
- 8.1.1. Software
- 8.1.2. Service
- 8.1.2.1. Professional Service
- 8.1.2.2. Managed Service
- 8.2. Market Analysis, Insights and Forecast - by Analysis
- 8.2.1. Descriptive
- 8.2.2. Prescriptive
- 8.2.3. Predictive
- 8.3. Market Analysis, Insights and Forecast - by Deployment
- 8.3.1. On-Premise
- 8.3.2. Cloud
- 8.4. Market Analysis, Insights and Forecast - by End-user Industry
- 8.4.1. Manufacturing
- 8.4.2. Supply Chain & Logistic
- 8.4.3. Retail
- 8.4.4. BFSI
- 8.4.5. IT & Telecommunication
- 8.4.6. Education
- 8.4.7. Healthcare
- 8.4.8. Other End-user Industries
- 8.1. Market Analysis, Insights and Forecast - by Type
- 9. Latin America Spend Analytics Technology Industry Analysis, Insights and Forecast, 2019-2031
- 9.1. Market Analysis, Insights and Forecast - by Type
- 9.1.1. Software
- 9.1.2. Service
- 9.1.2.1. Professional Service
- 9.1.2.2. Managed Service
- 9.2. Market Analysis, Insights and Forecast - by Analysis
- 9.2.1. Descriptive
- 9.2.2. Prescriptive
- 9.2.3. Predictive
- 9.3. Market Analysis, Insights and Forecast - by Deployment
- 9.3.1. On-Premise
- 9.3.2. Cloud
- 9.4. Market Analysis, Insights and Forecast - by End-user Industry
- 9.4.1. Manufacturing
- 9.4.2. Supply Chain & Logistic
- 9.4.3. Retail
- 9.4.4. BFSI
- 9.4.5. IT & Telecommunication
- 9.4.6. Education
- 9.4.7. Healthcare
- 9.4.8. Other End-user Industries
- 9.1. Market Analysis, Insights and Forecast - by Type
- 10. Middle East Spend Analytics Technology Industry Analysis, Insights and Forecast, 2019-2031
- 10.1. Market Analysis, Insights and Forecast - by Type
- 10.1.1. Software
- 10.1.2. Service
- 10.1.2.1. Professional Service
- 10.1.2.2. Managed Service
- 10.2. Market Analysis, Insights and Forecast - by Analysis
- 10.2.1. Descriptive
- 10.2.2. Prescriptive
- 10.2.3. Predictive
- 10.3. Market Analysis, Insights and Forecast - by Deployment
- 10.3.1. On-Premise
- 10.3.2. Cloud
- 10.4. Market Analysis, Insights and Forecast - by End-user Industry
- 10.4.1. Manufacturing
- 10.4.2. Supply Chain & Logistic
- 10.4.3. Retail
- 10.4.4. BFSI
- 10.4.5. IT & Telecommunication
- 10.4.6. Education
- 10.4.7. Healthcare
- 10.4.8. Other End-user Industries
- 10.1. Market Analysis, Insights and Forecast - by Type
- 11. North America Spend Analytics Technology Industry Analysis, Insights and Forecast, 2019-2031
- 11.1. Market Analysis, Insights and Forecast - By Country/Sub-region
- 11.1.1 United States
- 11.1.2 Canada
- 11.1.3 Mexico
- 12. Europe Spend Analytics Technology Industry Analysis, Insights and Forecast, 2019-2031
- 12.1. Market Analysis, Insights and Forecast - By Country/Sub-region
- 12.1.1 Germany
- 12.1.2 United Kingdom
- 12.1.3 France
- 12.1.4 Spain
- 12.1.5 Italy
- 12.1.6 Spain
- 12.1.7 Belgium
- 12.1.8 Netherland
- 12.1.9 Nordics
- 12.1.10 Rest of Europe
- 13. Asia Pacific Spend Analytics Technology Industry Analysis, Insights and Forecast, 2019-2031
- 13.1. Market Analysis, Insights and Forecast - By Country/Sub-region
- 13.1.1 China
- 13.1.2 Japan
- 13.1.3 India
- 13.1.4 South Korea
- 13.1.5 Southeast Asia
- 13.1.6 Australia
- 13.1.7 Indonesia
- 13.1.8 Phillipes
- 13.1.9 Singapore
- 13.1.10 Thailandc
- 13.1.11 Rest of Asia Pacific
- 14. South America Spend Analytics Technology Industry Analysis, Insights and Forecast, 2019-2031
- 14.1. Market Analysis, Insights and Forecast - By Country/Sub-region
- 14.1.1 Brazil
- 14.1.2 Argentina
- 14.1.3 Peru
- 14.1.4 Chile
- 14.1.5 Colombia
- 14.1.6 Ecuador
- 14.1.7 Venezuela
- 14.1.8 Rest of South America
- 15. North America Spend Analytics Technology Industry Analysis, Insights and Forecast, 2019-2031
- 15.1. Market Analysis, Insights and Forecast - By Country/Sub-region
- 15.1.1 United States
- 15.1.2 Canada
- 15.1.3 Mexico
- 16. MEA Spend Analytics Technology Industry Analysis, Insights and Forecast, 2019-2031
- 16.1. Market Analysis, Insights and Forecast - By Country/Sub-region
- 16.1.1 United Arab Emirates
- 16.1.2 Saudi Arabia
- 16.1.3 South Africa
- 16.1.4 Rest of Middle East and Africa
- 17. Competitive Analysis
- 17.1. Global Market Share Analysis 2024
- 17.2. Company Profiles
- 17.2.1 SAS Institute Inc
- 17.2.1.1. Overview
- 17.2.1.2. Products
- 17.2.1.3. SWOT Analysis
- 17.2.1.4. Recent Developments
- 17.2.1.5. Financials (Based on Availability)
- 17.2.2 Coupa Software
- 17.2.2.1. Overview
- 17.2.2.2. Products
- 17.2.2.3. SWOT Analysis
- 17.2.2.4. Recent Developments
- 17.2.2.5. Financials (Based on Availability)
- 17.2.3 IBM Corporation
- 17.2.3.1. Overview
- 17.2.3.2. Products
- 17.2.3.3. SWOT Analysis
- 17.2.3.4. Recent Developments
- 17.2.3.5. Financials (Based on Availability)
- 17.2.4 Genpact
- 17.2.4.1. Overview
- 17.2.4.2. Products
- 17.2.4.3. SWOT Analysis
- 17.2.4.4. Recent Developments
- 17.2.4.5. Financials (Based on Availability)
- 17.2.5 Zycus Inc
- 17.2.5.1. Overview
- 17.2.5.2. Products
- 17.2.5.3. SWOT Analysis
- 17.2.5.4. Recent Developments
- 17.2.5.5. Financials (Based on Availability)
- 17.2.6 Oracle Corporation
- 17.2.6.1. Overview
- 17.2.6.2. Products
- 17.2.6.3. SWOT Analysis
- 17.2.6.4. Recent Developments
- 17.2.6.5. Financials (Based on Availability)
- 17.2.7 Empronc Solutions Pvt Ltd
- 17.2.7.1. Overview
- 17.2.7.2. Products
- 17.2.7.3. SWOT Analysis
- 17.2.7.4. Recent Developments
- 17.2.7.5. Financials (Based on Availability)
- 17.2.8 JAGGAER Incorporation
- 17.2.8.1. Overview
- 17.2.8.2. Products
- 17.2.8.3. SWOT Analysis
- 17.2.8.4. Recent Developments
- 17.2.8.5. Financials (Based on Availability)
- 17.2.9 Sievo Oy*List Not Exhaustive
- 17.2.9.1. Overview
- 17.2.9.2. Products
- 17.2.9.3. SWOT Analysis
- 17.2.9.4. Recent Developments
- 17.2.9.5. Financials (Based on Availability)
- 17.2.10 Proactis Inc
- 17.2.10.1. Overview
- 17.2.10.2. Products
- 17.2.10.3. SWOT Analysis
- 17.2.10.4. Recent Developments
- 17.2.10.5. Financials (Based on Availability)
- 17.2.11 SAP SE
- 17.2.11.1. Overview
- 17.2.11.2. Products
- 17.2.11.3. SWOT Analysis
- 17.2.11.4. Recent Developments
- 17.2.11.5. Financials (Based on Availability)
- 17.2.1 SAS Institute Inc
List of Figures
- Figure 1: Global Spend Analytics Technology Industry Revenue Breakdown (Million, %) by Region 2024 & 2032
- Figure 2: North America Spend Analytics Technology Industry Revenue (Million), by Country 2024 & 2032
- Figure 3: North America Spend Analytics Technology Industry Revenue Share (%), by Country 2024 & 2032
- Figure 4: Europe Spend Analytics Technology Industry Revenue (Million), by Country 2024 & 2032
- Figure 5: Europe Spend Analytics Technology Industry Revenue Share (%), by Country 2024 & 2032
- Figure 6: Asia Pacific Spend Analytics Technology Industry Revenue (Million), by Country 2024 & 2032
- Figure 7: Asia Pacific Spend Analytics Technology Industry Revenue Share (%), by Country 2024 & 2032
- Figure 8: South America Spend Analytics Technology Industry Revenue (Million), by Country 2024 & 2032
- Figure 9: South America Spend Analytics Technology Industry Revenue Share (%), by Country 2024 & 2032
- Figure 10: North America Spend Analytics Technology Industry Revenue (Million), by Country 2024 & 2032
- Figure 11: North America Spend Analytics Technology Industry Revenue Share (%), by Country 2024 & 2032
- Figure 12: MEA Spend Analytics Technology Industry Revenue (Million), by Country 2024 & 2032
- Figure 13: MEA Spend Analytics Technology Industry Revenue Share (%), by Country 2024 & 2032
- Figure 14: North America Spend Analytics Technology Industry Revenue (Million), by Type 2024 & 2032
- Figure 15: North America Spend Analytics Technology Industry Revenue Share (%), by Type 2024 & 2032
- Figure 16: North America Spend Analytics Technology Industry Revenue (Million), by Analysis 2024 & 2032
- Figure 17: North America Spend Analytics Technology Industry Revenue Share (%), by Analysis 2024 & 2032
- Figure 18: North America Spend Analytics Technology Industry Revenue (Million), by Deployment 2024 & 2032
- Figure 19: North America Spend Analytics Technology Industry Revenue Share (%), by Deployment 2024 & 2032
- Figure 20: North America Spend Analytics Technology Industry Revenue (Million), by End-user Industry 2024 & 2032
- Figure 21: North America Spend Analytics Technology Industry Revenue Share (%), by End-user Industry 2024 & 2032
- Figure 22: North America Spend Analytics Technology Industry Revenue (Million), by Country 2024 & 2032
- Figure 23: North America Spend Analytics Technology Industry Revenue Share (%), by Country 2024 & 2032
- Figure 24: Europe Spend Analytics Technology Industry Revenue (Million), by Type 2024 & 2032
- Figure 25: Europe Spend Analytics Technology Industry Revenue Share (%), by Type 2024 & 2032
- Figure 26: Europe Spend Analytics Technology Industry Revenue (Million), by Analysis 2024 & 2032
- Figure 27: Europe Spend Analytics Technology Industry Revenue Share (%), by Analysis 2024 & 2032
- Figure 28: Europe Spend Analytics Technology Industry Revenue (Million), by Deployment 2024 & 2032
- Figure 29: Europe Spend Analytics Technology Industry Revenue Share (%), by Deployment 2024 & 2032
- Figure 30: Europe Spend Analytics Technology Industry Revenue (Million), by End-user Industry 2024 & 2032
- Figure 31: Europe Spend Analytics Technology Industry Revenue Share (%), by End-user Industry 2024 & 2032
- Figure 32: Europe Spend Analytics Technology Industry Revenue (Million), by Country 2024 & 2032
- Figure 33: Europe Spend Analytics Technology Industry Revenue Share (%), by Country 2024 & 2032
- Figure 34: Asia Pacific Spend Analytics Technology Industry Revenue (Million), by Type 2024 & 2032
- Figure 35: Asia Pacific Spend Analytics Technology Industry Revenue Share (%), by Type 2024 & 2032
- Figure 36: Asia Pacific Spend Analytics Technology Industry Revenue (Million), by Analysis 2024 & 2032
- Figure 37: Asia Pacific Spend Analytics Technology Industry Revenue Share (%), by Analysis 2024 & 2032
- Figure 38: Asia Pacific Spend Analytics Technology Industry Revenue (Million), by Deployment 2024 & 2032
- Figure 39: Asia Pacific Spend Analytics Technology Industry Revenue Share (%), by Deployment 2024 & 2032
- Figure 40: Asia Pacific Spend Analytics Technology Industry Revenue (Million), by End-user Industry 2024 & 2032
- Figure 41: Asia Pacific Spend Analytics Technology Industry Revenue Share (%), by End-user Industry 2024 & 2032
- Figure 42: Asia Pacific Spend Analytics Technology Industry Revenue (Million), by Country 2024 & 2032
- Figure 43: Asia Pacific Spend Analytics Technology Industry Revenue Share (%), by Country 2024 & 2032
- Figure 44: Latin America Spend Analytics Technology Industry Revenue (Million), by Type 2024 & 2032
- Figure 45: Latin America Spend Analytics Technology Industry Revenue Share (%), by Type 2024 & 2032
- Figure 46: Latin America Spend Analytics Technology Industry Revenue (Million), by Analysis 2024 & 2032
- Figure 47: Latin America Spend Analytics Technology Industry Revenue Share (%), by Analysis 2024 & 2032
- Figure 48: Latin America Spend Analytics Technology Industry Revenue (Million), by Deployment 2024 & 2032
- Figure 49: Latin America Spend Analytics Technology Industry Revenue Share (%), by Deployment 2024 & 2032
- Figure 50: Latin America Spend Analytics Technology Industry Revenue (Million), by End-user Industry 2024 & 2032
- Figure 51: Latin America Spend Analytics Technology Industry Revenue Share (%), by End-user Industry 2024 & 2032
- Figure 52: Latin America Spend Analytics Technology Industry Revenue (Million), by Country 2024 & 2032
- Figure 53: Latin America Spend Analytics Technology Industry Revenue Share (%), by Country 2024 & 2032
- Figure 54: Middle East Spend Analytics Technology Industry Revenue (Million), by Type 2024 & 2032
- Figure 55: Middle East Spend Analytics Technology Industry Revenue Share (%), by Type 2024 & 2032
- Figure 56: Middle East Spend Analytics Technology Industry Revenue (Million), by Analysis 2024 & 2032
- Figure 57: Middle East Spend Analytics Technology Industry Revenue Share (%), by Analysis 2024 & 2032
- Figure 58: Middle East Spend Analytics Technology Industry Revenue (Million), by Deployment 2024 & 2032
- Figure 59: Middle East Spend Analytics Technology Industry Revenue Share (%), by Deployment 2024 & 2032
- Figure 60: Middle East Spend Analytics Technology Industry Revenue (Million), by End-user Industry 2024 & 2032
- Figure 61: Middle East Spend Analytics Technology Industry Revenue Share (%), by End-user Industry 2024 & 2032
- Figure 62: Middle East Spend Analytics Technology Industry Revenue (Million), by Country 2024 & 2032
- Figure 63: Middle East Spend Analytics Technology Industry Revenue Share (%), by Country 2024 & 2032
List of Tables
- Table 1: Global Spend Analytics Technology Industry Revenue Million Forecast, by Region 2019 & 2032
- Table 2: Global Spend Analytics Technology Industry Revenue Million Forecast, by Type 2019 & 2032
- Table 3: Global Spend Analytics Technology Industry Revenue Million Forecast, by Analysis 2019 & 2032
- Table 4: Global Spend Analytics Technology Industry Revenue Million Forecast, by Deployment 2019 & 2032
- Table 5: Global Spend Analytics Technology Industry Revenue Million Forecast, by End-user Industry 2019 & 2032
- Table 6: Global Spend Analytics Technology Industry Revenue Million Forecast, by Region 2019 & 2032
- Table 7: Global Spend Analytics Technology Industry Revenue Million Forecast, by Country 2019 & 2032
- Table 8: United States Spend Analytics Technology Industry Revenue (Million) Forecast, by Application 2019 & 2032
- Table 9: Canada Spend Analytics Technology Industry Revenue (Million) Forecast, by Application 2019 & 2032
- Table 10: Mexico Spend Analytics Technology Industry Revenue (Million) Forecast, by Application 2019 & 2032
- Table 11: Global Spend Analytics Technology Industry Revenue Million Forecast, by Country 2019 & 2032
- Table 12: Germany Spend Analytics Technology Industry Revenue (Million) Forecast, by Application 2019 & 2032
- Table 13: United Kingdom Spend Analytics Technology Industry Revenue (Million) Forecast, by Application 2019 & 2032
- Table 14: France Spend Analytics Technology Industry Revenue (Million) Forecast, by Application 2019 & 2032
- Table 15: Spain Spend Analytics Technology Industry Revenue (Million) Forecast, by Application 2019 & 2032
- Table 16: Italy Spend Analytics Technology Industry Revenue (Million) Forecast, by Application 2019 & 2032
- Table 17: Spain Spend Analytics Technology Industry Revenue (Million) Forecast, by Application 2019 & 2032
- Table 18: Belgium Spend Analytics Technology Industry Revenue (Million) Forecast, by Application 2019 & 2032
- Table 19: Netherland Spend Analytics Technology Industry Revenue (Million) Forecast, by Application 2019 & 2032
- Table 20: Nordics Spend Analytics Technology Industry Revenue (Million) Forecast, by Application 2019 & 2032
- Table 21: Rest of Europe Spend Analytics Technology Industry Revenue (Million) Forecast, by Application 2019 & 2032
- Table 22: Global Spend Analytics Technology Industry Revenue Million Forecast, by Country 2019 & 2032
- Table 23: China Spend Analytics Technology Industry Revenue (Million) Forecast, by Application 2019 & 2032
- Table 24: Japan Spend Analytics Technology Industry Revenue (Million) Forecast, by Application 2019 & 2032
- Table 25: India Spend Analytics Technology Industry Revenue (Million) Forecast, by Application 2019 & 2032
- Table 26: South Korea Spend Analytics Technology Industry Revenue (Million) Forecast, by Application 2019 & 2032
- Table 27: Southeast Asia Spend Analytics Technology Industry Revenue (Million) Forecast, by Application 2019 & 2032
- Table 28: Australia Spend Analytics Technology Industry Revenue (Million) Forecast, by Application 2019 & 2032
- Table 29: Indonesia Spend Analytics Technology Industry Revenue (Million) Forecast, by Application 2019 & 2032
- Table 30: Phillipes Spend Analytics Technology Industry Revenue (Million) Forecast, by Application 2019 & 2032
- Table 31: Singapore Spend Analytics Technology Industry Revenue (Million) Forecast, by Application 2019 & 2032
- Table 32: Thailandc Spend Analytics Technology Industry Revenue (Million) Forecast, by Application 2019 & 2032
- Table 33: Rest of Asia Pacific Spend Analytics Technology Industry Revenue (Million) Forecast, by Application 2019 & 2032
- Table 34: Global Spend Analytics Technology Industry Revenue Million Forecast, by Country 2019 & 2032
- Table 35: Brazil Spend Analytics Technology Industry Revenue (Million) Forecast, by Application 2019 & 2032
- Table 36: Argentina Spend Analytics Technology Industry Revenue (Million) Forecast, by Application 2019 & 2032
- Table 37: Peru Spend Analytics Technology Industry Revenue (Million) Forecast, by Application 2019 & 2032
- Table 38: Chile Spend Analytics Technology Industry Revenue (Million) Forecast, by Application 2019 & 2032
- Table 39: Colombia Spend Analytics Technology Industry Revenue (Million) Forecast, by Application 2019 & 2032
- Table 40: Ecuador Spend Analytics Technology Industry Revenue (Million) Forecast, by Application 2019 & 2032
- Table 41: Venezuela Spend Analytics Technology Industry Revenue (Million) Forecast, by Application 2019 & 2032
- Table 42: Rest of South America Spend Analytics Technology Industry Revenue (Million) Forecast, by Application 2019 & 2032
- Table 43: Global Spend Analytics Technology Industry Revenue Million Forecast, by Country 2019 & 2032
- Table 44: United States Spend Analytics Technology Industry Revenue (Million) Forecast, by Application 2019 & 2032
- Table 45: Canada Spend Analytics Technology Industry Revenue (Million) Forecast, by Application 2019 & 2032
- Table 46: Mexico Spend Analytics Technology Industry Revenue (Million) Forecast, by Application 2019 & 2032
- Table 47: Global Spend Analytics Technology Industry Revenue Million Forecast, by Country 2019 & 2032
- Table 48: United Arab Emirates Spend Analytics Technology Industry Revenue (Million) Forecast, by Application 2019 & 2032
- Table 49: Saudi Arabia Spend Analytics Technology Industry Revenue (Million) Forecast, by Application 2019 & 2032
- Table 50: South Africa Spend Analytics Technology Industry Revenue (Million) Forecast, by Application 2019 & 2032
- Table 51: Rest of Middle East and Africa Spend Analytics Technology Industry Revenue (Million) Forecast, by Application 2019 & 2032
- Table 52: Global Spend Analytics Technology Industry Revenue Million Forecast, by Type 2019 & 2032
- Table 53: Global Spend Analytics Technology Industry Revenue Million Forecast, by Analysis 2019 & 2032
- Table 54: Global Spend Analytics Technology Industry Revenue Million Forecast, by Deployment 2019 & 2032
- Table 55: Global Spend Analytics Technology Industry Revenue Million Forecast, by End-user Industry 2019 & 2032
- Table 56: Global Spend Analytics Technology Industry Revenue Million Forecast, by Country 2019 & 2032
- Table 57: Global Spend Analytics Technology Industry Revenue Million Forecast, by Type 2019 & 2032
- Table 58: Global Spend Analytics Technology Industry Revenue Million Forecast, by Analysis 2019 & 2032
- Table 59: Global Spend Analytics Technology Industry Revenue Million Forecast, by Deployment 2019 & 2032
- Table 60: Global Spend Analytics Technology Industry Revenue Million Forecast, by End-user Industry 2019 & 2032
- Table 61: Global Spend Analytics Technology Industry Revenue Million Forecast, by Country 2019 & 2032
- Table 62: Global Spend Analytics Technology Industry Revenue Million Forecast, by Type 2019 & 2032
- Table 63: Global Spend Analytics Technology Industry Revenue Million Forecast, by Analysis 2019 & 2032
- Table 64: Global Spend Analytics Technology Industry Revenue Million Forecast, by Deployment 2019 & 2032
- Table 65: Global Spend Analytics Technology Industry Revenue Million Forecast, by End-user Industry 2019 & 2032
- Table 66: Global Spend Analytics Technology Industry Revenue Million Forecast, by Country 2019 & 2032
- Table 67: Global Spend Analytics Technology Industry Revenue Million Forecast, by Type 2019 & 2032
- Table 68: Global Spend Analytics Technology Industry Revenue Million Forecast, by Analysis 2019 & 2032
- Table 69: Global Spend Analytics Technology Industry Revenue Million Forecast, by Deployment 2019 & 2032
- Table 70: Global Spend Analytics Technology Industry Revenue Million Forecast, by End-user Industry 2019 & 2032
- Table 71: Global Spend Analytics Technology Industry Revenue Million Forecast, by Country 2019 & 2032
- Table 72: Global Spend Analytics Technology Industry Revenue Million Forecast, by Type 2019 & 2032
- Table 73: Global Spend Analytics Technology Industry Revenue Million Forecast, by Analysis 2019 & 2032
- Table 74: Global Spend Analytics Technology Industry Revenue Million Forecast, by Deployment 2019 & 2032
- Table 75: Global Spend Analytics Technology Industry Revenue Million Forecast, by End-user Industry 2019 & 2032
- Table 76: Global Spend Analytics Technology Industry Revenue Million Forecast, by Country 2019 & 2032
Frequently Asked Questions
1. What is the projected Compound Annual Growth Rate (CAGR) of the Spend Analytics Technology Industry?
The projected CAGR is approximately 17.90%.
2. Which companies are prominent players in the Spend Analytics Technology Industry?
Key companies in the market include SAS Institute Inc, Coupa Software, IBM Corporation, Genpact, Zycus Inc, Oracle Corporation, Empronc Solutions Pvt Ltd, JAGGAER Incorporation, Sievo Oy*List Not Exhaustive, Proactis Inc, SAP SE.
3. What are the main segments of the Spend Analytics Technology Industry?
The market segments include Type, Analysis, Deployment, End-user Industry.
4. Can you provide details about the market size?
The market size is estimated to be USD XX Million as of 2022.
5. What are some drivers contributing to market growth?
Rising Adoption in Procurement Process in Industries; Rising Adoption of Cloud Services and Increasing Penetration of IoT Applications.
6. What are the notable trends driving market growth?
Retail Segment is Expected to Hold Significant Share.
7. Are there any restraints impacting market growth?
Growing Data Breaches Cases.
8. Can you provide examples of recent developments in the market?
July 2022 - SAP SE announced the acquisition of Askdata, a startup specializing in search-driven analytics. SAP increases its capabilities to help enterprises make better-informed decisions by employing AI-driven natural language searches with the purchase of Askdata. Users may search, interact, and collaborate on real data to gain the most business insights.
9. What pricing options are available for accessing the report?
Pricing options include single-user, multi-user, and enterprise licenses priced at USD 4750, USD 5250, and USD 8750 respectively.
10. Is the market size provided in terms of value or volume?
The market size is provided in terms of value, measured in Million.
11. Are there any specific market keywords associated with the report?
Yes, the market keyword associated with the report is "Spend Analytics Technology Industry," which aids in identifying and referencing the specific market segment covered.
12. How do I determine which pricing option suits my needs best?
The pricing options vary based on user requirements and access needs. Individual users may opt for single-user licenses, while businesses requiring broader access may choose multi-user or enterprise licenses for cost-effective access to the report.
13. Are there any additional resources or data provided in the Spend Analytics Technology Industry report?
While the report offers comprehensive insights, it's advisable to review the specific contents or supplementary materials provided to ascertain if additional resources or data are available.
14. How can I stay updated on further developments or reports in the Spend Analytics Technology Industry?
To stay informed about further developments, trends, and reports in the Spend Analytics Technology Industry, consider subscribing to industry newsletters, following relevant companies and organizations, or regularly checking reputable industry news sources and publications.
Methodology
Step 1 - Identification of Relevant Samples Size from Population Database


Step 2 - Approaches for Defining Global Market Size (Value, Volume* & Price*)

Note*: In applicable scenarios
Step 3 - Data Sources
Primary Research
- Web Analytics
- Survey Reports
- Research Institute
- Latest Research Reports
- Opinion Leaders
Secondary Research
- Annual Reports
- White Paper
- Latest Press Release
- Industry Association
- Paid Database
- Investor Presentations

Step 4 - Data Triangulation
Involves using different sources of information in order to increase the validity of a study
These sources are likely to be stakeholders in a program - participants, other researchers, program staff, other community members, and so on.
Then we put all data in single framework & apply various statistical tools to find out the dynamic on the market.
During the analysis stage, feedback from the stakeholder groups would be compared to determine areas of agreement as well as areas of divergence
