

Key Insights
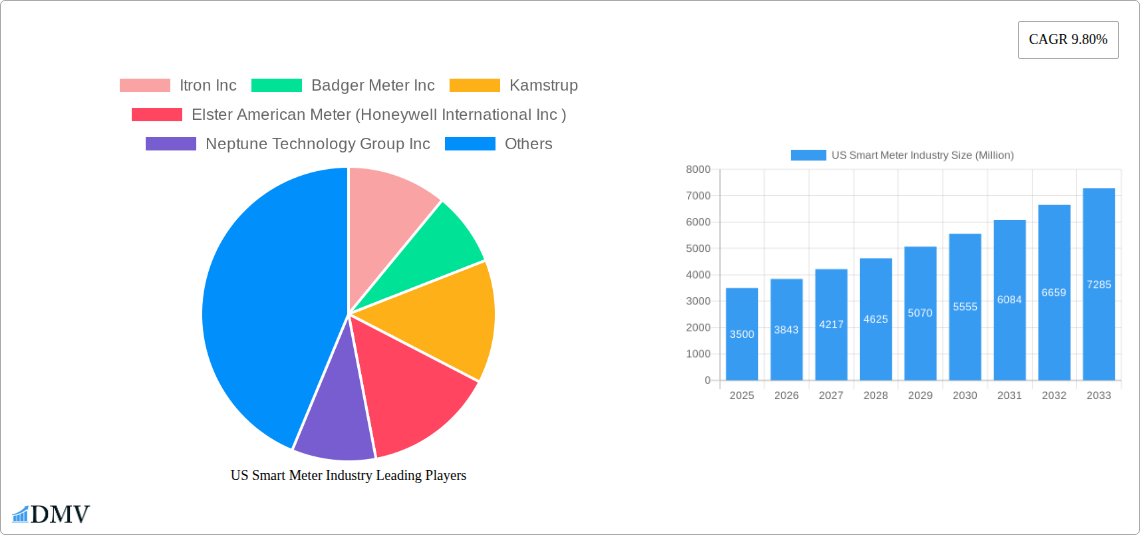
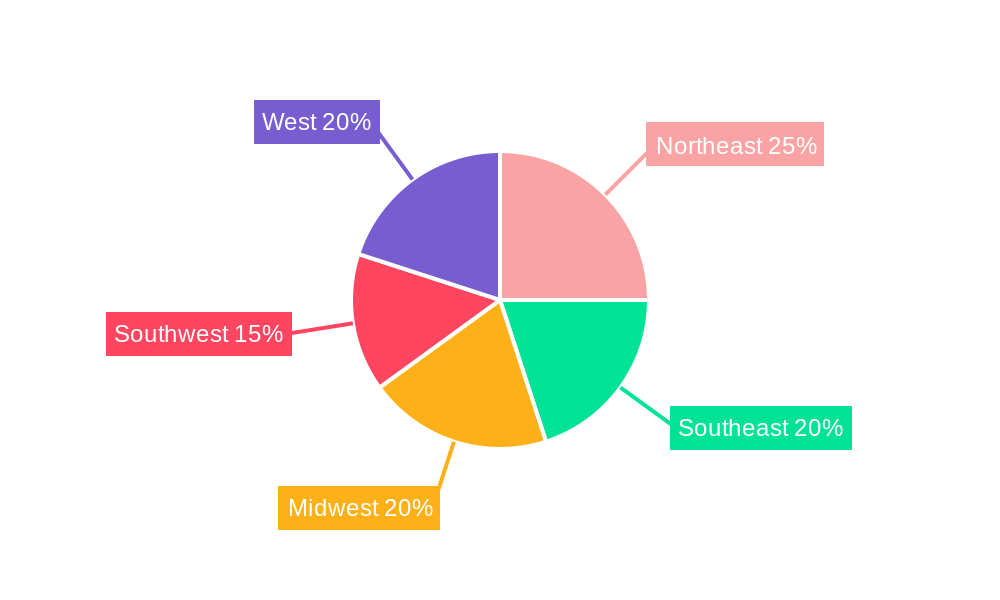
The US smart meter market, encompassing smart gas, water, and electricity meters for residential, commercial, and industrial sectors, is experiencing robust growth. Driven by increasing energy efficiency mandates, the desire for enhanced grid management capabilities, and the rising adoption of smart city initiatives, the market is projected to maintain a significant Compound Annual Growth Rate (CAGR) beyond the historical period (2019-2024). While precise market sizing for 2025 is unavailable, considering the provided 9.80% CAGR and the substantial investment in smart grid infrastructure across the US, we can reasonably estimate the 2025 market value to be in the range of $3 to $4 billion. This estimation is supported by observable trends in other developed nations with similar infrastructure investments. The segment breakdown likely favors electricity meters due to their widespread deployment, followed by gas and then water meters. The residential segment is expected to hold a significant share, but growth in the commercial and industrial sectors is poised to be equally significant, driven by sophisticated energy management needs and cost-saving opportunities. Leading vendors such as Itron, Badger Meter, and others are actively competing through technological innovation and strategic partnerships to capture market share. Regional variations will exist, with states like California and New York potentially leading in adoption due to their aggressive renewable energy targets and regulatory environment. Challenges such as high initial investment costs and potential cybersecurity vulnerabilities remain but are being addressed through technological advancements and robust security protocols.
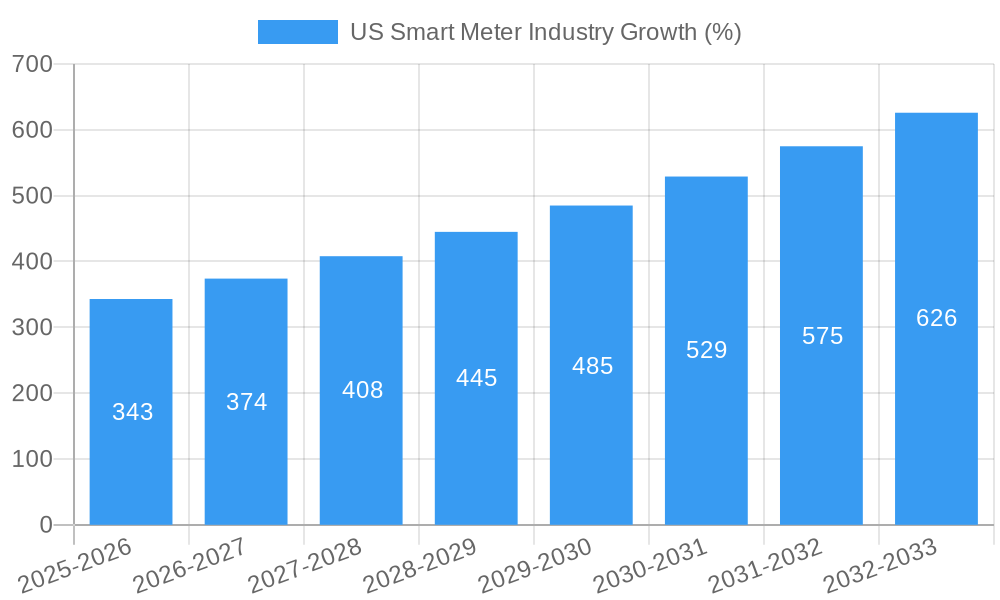
The forecast period (2025-2033) indicates continued expansion of the US smart meter market, likely driven by factors like aging infrastructure upgrades, smart home automation integration, and the development of advanced data analytics capabilities for better grid optimization. The expanding adoption of Advanced Metering Infrastructure (AMI) across utilities will serve as a critical driver. While certain regions may progress faster than others, the overall market is expected to be robust. Given the current trends and projected growth, by 2033 the market size could potentially exceed $8 billion. This expansion will present considerable opportunities for existing and emerging companies within the sector. Continued technological innovation, particularly in areas like low-power wide-area networks (LPWAN) and artificial intelligence (AI)-driven analytics, will be key factors influencing the market's future trajectory.
US Smart Meter Industry Market Report: 2019-2033
This comprehensive report provides a detailed analysis of the US smart meter industry, offering invaluable insights for stakeholders seeking to navigate this rapidly evolving market. Covering the period 2019-2033, with a base year of 2025 and a forecast period of 2025-2033, this report examines market size, growth trajectories, technological advancements, and key players. The total market value in 2025 is estimated at xx Million USD.
US Smart Meter Industry Market Composition & Trends
The US smart meter market is characterized by moderate concentration, with key players like Itron Inc, Badger Meter Inc, and Kamstrup holding significant market share. However, a dynamic competitive landscape exists, fueled by continuous innovation and strategic acquisitions. The regulatory environment, while supportive of smart meter deployment for enhanced grid management and water conservation, presents ongoing challenges related to data privacy and security. Substitute products, such as traditional mechanical meters, are gradually losing ground due to the compelling benefits offered by smart meters, including real-time data analysis, reduced operational costs, and improved customer service.
The residential segment currently dominates the end-user market, driven by increasing consumer awareness and government incentives for energy efficiency. The commercial and industrial sectors are also experiencing growth, albeit at a slower pace, as businesses adopt smart metering solutions to optimize resource utilization and reduce operational expenditures.
Mergers and acquisitions (M&A) are a prominent feature of the market landscape. Examples include:
- January 2021: Badger Meter, Inc. acquired Analytical Technology, Inc. (ATi) for USD 44 Million, strengthening its position in water quality monitoring.
- Other significant M&A deals in the recent past totaled approximately xx Million USD. This reflects the industry’s consolidation trend and the pursuit of enhanced technological capabilities and market reach.
US Smart Meter Industry Industry Evolution
The US smart meter market has witnessed substantial growth over the historical period (2019-2024), with a Compound Annual Growth Rate (CAGR) of xx%. This growth is primarily fueled by the increasing adoption of smart electricity meters, driven by utility companies’ efforts to modernize their infrastructure and improve grid efficiency. Smart water meters are experiencing significant growth as well, supported by water conservation initiatives and the need for improved leak detection. Smart gas meters are growing at a slower rate, primarily due to the lower level of regulatory pressure compared to electricity and water meters.
Technological advancements, such as the integration of advanced communication technologies (e.g., cellular, LoRaWAN), improved data analytics capabilities, and the incorporation of smart grid functionalities, are driving market expansion. Furthermore, evolving consumer demands, including greater transparency and control over energy and water consumption, are creating an environment increasingly conducive to smart meter adoption. The market is estimated to reach xx Million USD in 2025, growing at a CAGR of xx% during the forecast period (2025-2033). Adoption rates are projected to increase significantly during this period, especially in the residential sector, driven by government initiatives and consumer preference for energy management solutions.
Leading Regions, Countries, or Segments in US Smart Meter Industry
Dominant Segment: The residential segment is the largest segment by end-user, accounting for approximately xx% of the market in 2025. This dominance is primarily attributed to the large number of residential customers, coupled with governmental initiatives promoting energy efficiency and smart meter adoption.
Key Drivers for Residential Segment Dominance:
- Government subsidies and rebates aimed at encouraging residential energy efficiency upgrades.
- Increasing consumer awareness about energy conservation and the benefits of real-time energy monitoring.
- Growing availability of consumer-friendly mobile applications and web portals for energy consumption management.
Smart Electricity Meters: This segment holds the largest share within the ‘By Type’ category, primarily because of utility company investments in smart grid infrastructure upgrades and advancements in grid automation technologies.
Growth Drivers:
- Significant investments by utility companies in modernizing their infrastructure.
- Government mandates and regulations promoting smart grid deployment.
- Improved grid management capabilities through real-time data monitoring and analysis.
US Smart Meter Industry Product Innovations
Recent innovations focus on enhancing communication technologies, improving data analytics capabilities, and integrating advanced functionalities such as leak detection and remote meter disconnection. Advanced metering infrastructure (AMI) systems are becoming increasingly sophisticated, incorporating AI-powered predictive maintenance features and advanced data security protocols. This results in improved accuracy, reliability, and enhanced operational efficiency for utility companies and reduced consumer energy waste.
Propelling Factors for US Smart Meter Industry Growth
Technological advancements, particularly in communication technologies and data analytics, are key drivers. The increasing emphasis on energy efficiency and sustainability, coupled with supportive government regulations and incentives, is accelerating adoption. Economic benefits, such as reduced operational costs for utilities and improved energy management for consumers, further stimulate market growth.
Obstacles in the US Smart Meter Industry Market
High initial investment costs for smart meter deployment can be a barrier to entry for smaller utilities. Supply chain disruptions and the availability of skilled labor can impact the speed of installation and implementation. Competition from established players and the emergence of new technologies create a challenging dynamic market. Regulatory hurdles and concerns regarding data privacy and security also pose challenges.
Future Opportunities in US Smart Meter Industry
Emerging opportunities exist in integrating smart meters with renewable energy systems, expanding into newer markets (e.g., smart agriculture), and developing advanced data analytics solutions to optimize energy consumption and grid stability. The increasing adoption of Internet of Things (IoT) technologies will also present opportunities for enhancing functionalities and connectivity.
Major Players in the US Smart Meter Industry Ecosystem
- Itron Inc
- Badger Meter Inc
- Kamstrup
- Elster American Meter (Honeywell International Inc)
- Neptune Technology Group Inc
- Sensus USA Inc (Xylem Inc)
- General Electric Co
- Diehl Metering US
- Mueller Systems LLC
Key Developments in US Smart Meter Industry Industry
- January 2021: Badger Meter, Inc. acquired Analytical Technology, Inc. (ATi) for USD 44 Million, expanding its capabilities in water quality monitoring.
- March 2022: Mueller Systems partnered with Pace Water System in a pilot program implementing advanced features for customer meter control via mobile phones.
Strategic US Smart Meter Industry Market Forecast
The US smart meter market is poised for continued growth, driven by technological advancements, supportive regulatory frameworks, and increasing consumer demand for energy efficiency solutions. The market is projected to experience significant expansion, with substantial opportunities for growth in both the residential and commercial sectors. The integration of smart meters with other IoT devices and the continued development of advanced data analytics capabilities will further enhance market potential.
US Smart Meter Industry Segmentation
-
1. Type
- 1.1. Smart Gas Meters
- 1.2. Smart Water Meters
- 1.3. Smart Electricity Meters
-
2. End-User
- 2.1. Commercial
- 2.2. Industrial
- 2.3. Residential
US Smart Meter Industry Segmentation By Geography
-
1. North America
- 1.1. United States
- 1.2. Canada
- 1.3. Mexico
-
2. South America
- 2.1. Brazil
- 2.2. Argentina
- 2.3. Rest of South America
-
3. Europe
- 3.1. United Kingdom
- 3.2. Germany
- 3.3. France
- 3.4. Italy
- 3.5. Spain
- 3.6. Russia
- 3.7. Benelux
- 3.8. Nordics
- 3.9. Rest of Europe
-
4. Middle East & Africa
- 4.1. Turkey
- 4.2. Israel
- 4.3. GCC
- 4.4. North Africa
- 4.5. South Africa
- 4.6. Rest of Middle East & Africa
-
5. Asia Pacific
- 5.1. China
- 5.2. India
- 5.3. Japan
- 5.4. South Korea
- 5.5. ASEAN
- 5.6. Oceania
- 5.7. Rest of Asia Pacific
US Smart Meter Industry REPORT HIGHLIGHTS
| Aspects | Details |
|---|---|
| Study Period | 2019-2033 |
| Base Year | 2024 |
| Estimated Year | 2025 |
| Forecast Period | 2025-2033 |
| Historical Period | 2019-2024 |
| Growth Rate | CAGR of 9.80% from 2019-2033 |
| Segmentation |
|
Table of Contents
- 1. Introduction
- 1.1. Research Scope
- 1.2. Market Segmentation
- 1.3. Research Methodology
- 1.4. Definitions and Assumptions
- 2. Executive Summary
- 2.1. Introduction
- 3. Market Dynamics
- 3.1. Introduction
- 3.2. Market Drivers
- 3.2.1. Higher Consumer Awareness and Government Regulations Mandating the Installation of Smart Meters; Increased Investments in Smart Grid Projects; Investments in Smart City Developments
- 3.3. Market Restrains
- 3.3.1. High Installation Cost and Longer ROI Period; Longer Replacement Cycle of Water Meters
- 3.4. Market Trends
- 3.4.1. Smart Gas Meter Segment to Grow Significantly
- 4. Market Factor Analysis
- 4.1. Porters Five Forces
- 4.2. Supply/Value Chain
- 4.3. PESTEL analysis
- 4.4. Market Entropy
- 4.5. Patent/Trademark Analysis
- 5. Global US Smart Meter Industry Analysis, Insights and Forecast, 2019-2031
- 5.1. Market Analysis, Insights and Forecast - by Type
- 5.1.1. Smart Gas Meters
- 5.1.2. Smart Water Meters
- 5.1.3. Smart Electricity Meters
- 5.2. Market Analysis, Insights and Forecast - by End-User
- 5.2.1. Commercial
- 5.2.2. Industrial
- 5.2.3. Residential
- 5.3. Market Analysis, Insights and Forecast - by Region
- 5.3.1. North America
- 5.3.2. South America
- 5.3.3. Europe
- 5.3.4. Middle East & Africa
- 5.3.5. Asia Pacific
- 5.1. Market Analysis, Insights and Forecast - by Type
- 6. North America US Smart Meter Industry Analysis, Insights and Forecast, 2019-2031
- 6.1. Market Analysis, Insights and Forecast - by Type
- 6.1.1. Smart Gas Meters
- 6.1.2. Smart Water Meters
- 6.1.3. Smart Electricity Meters
- 6.2. Market Analysis, Insights and Forecast - by End-User
- 6.2.1. Commercial
- 6.2.2. Industrial
- 6.2.3. Residential
- 6.1. Market Analysis, Insights and Forecast - by Type
- 7. South America US Smart Meter Industry Analysis, Insights and Forecast, 2019-2031
- 7.1. Market Analysis, Insights and Forecast - by Type
- 7.1.1. Smart Gas Meters
- 7.1.2. Smart Water Meters
- 7.1.3. Smart Electricity Meters
- 7.2. Market Analysis, Insights and Forecast - by End-User
- 7.2.1. Commercial
- 7.2.2. Industrial
- 7.2.3. Residential
- 7.1. Market Analysis, Insights and Forecast - by Type
- 8. Europe US Smart Meter Industry Analysis, Insights and Forecast, 2019-2031
- 8.1. Market Analysis, Insights and Forecast - by Type
- 8.1.1. Smart Gas Meters
- 8.1.2. Smart Water Meters
- 8.1.3. Smart Electricity Meters
- 8.2. Market Analysis, Insights and Forecast - by End-User
- 8.2.1. Commercial
- 8.2.2. Industrial
- 8.2.3. Residential
- 8.1. Market Analysis, Insights and Forecast - by Type
- 9. Middle East & Africa US Smart Meter Industry Analysis, Insights and Forecast, 2019-2031
- 9.1. Market Analysis, Insights and Forecast - by Type
- 9.1.1. Smart Gas Meters
- 9.1.2. Smart Water Meters
- 9.1.3. Smart Electricity Meters
- 9.2. Market Analysis, Insights and Forecast - by End-User
- 9.2.1. Commercial
- 9.2.2. Industrial
- 9.2.3. Residential
- 9.1. Market Analysis, Insights and Forecast - by Type
- 10. Asia Pacific US Smart Meter Industry Analysis, Insights and Forecast, 2019-2031
- 10.1. Market Analysis, Insights and Forecast - by Type
- 10.1.1. Smart Gas Meters
- 10.1.2. Smart Water Meters
- 10.1.3. Smart Electricity Meters
- 10.2. Market Analysis, Insights and Forecast - by End-User
- 10.2.1. Commercial
- 10.2.2. Industrial
- 10.2.3. Residential
- 10.1. Market Analysis, Insights and Forecast - by Type
- 11. Northeast US Smart Meter Industry Analysis, Insights and Forecast, 2019-2031
- 12. Southeast US Smart Meter Industry Analysis, Insights and Forecast, 2019-2031
- 13. Midwest US Smart Meter Industry Analysis, Insights and Forecast, 2019-2031
- 14. Southwest US Smart Meter Industry Analysis, Insights and Forecast, 2019-2031
- 15. West US Smart Meter Industry Analysis, Insights and Forecast, 2019-2031
- 16. Competitive Analysis
- 16.1. Global Market Share Analysis 2024
- 16.2. Company Profiles
- 16.2.1 Itron Inc
- 16.2.1.1. Overview
- 16.2.1.2. Products
- 16.2.1.3. SWOT Analysis
- 16.2.1.4. Recent Developments
- 16.2.1.5. Financials (Based on Availability)
- 16.2.2 Badger Meter Inc
- 16.2.2.1. Overview
- 16.2.2.2. Products
- 16.2.2.3. SWOT Analysis
- 16.2.2.4. Recent Developments
- 16.2.2.5. Financials (Based on Availability)
- 16.2.3 Kamstrup
- 16.2.3.1. Overview
- 16.2.3.2. Products
- 16.2.3.3. SWOT Analysis
- 16.2.3.4. Recent Developments
- 16.2.3.5. Financials (Based on Availability)
- 16.2.4 Elster American Meter (Honeywell International Inc )
- 16.2.4.1. Overview
- 16.2.4.2. Products
- 16.2.4.3. SWOT Analysis
- 16.2.4.4. Recent Developments
- 16.2.4.5. Financials (Based on Availability)
- 16.2.5 Neptune Technology Group Inc
- 16.2.5.1. Overview
- 16.2.5.2. Products
- 16.2.5.3. SWOT Analysis
- 16.2.5.4. Recent Developments
- 16.2.5.5. Financials (Based on Availability)
- 16.2.6 Sensus USA Inc (Xylem Inc )
- 16.2.6.1. Overview
- 16.2.6.2. Products
- 16.2.6.3. SWOT Analysis
- 16.2.6.4. Recent Developments
- 16.2.6.5. Financials (Based on Availability)
- 16.2.7 General Electric Co
- 16.2.7.1. Overview
- 16.2.7.2. Products
- 16.2.7.3. SWOT Analysis
- 16.2.7.4. Recent Developments
- 16.2.7.5. Financials (Based on Availability)
- 16.2.8 Diehl Metering US
- 16.2.8.1. Overview
- 16.2.8.2. Products
- 16.2.8.3. SWOT Analysis
- 16.2.8.4. Recent Developments
- 16.2.8.5. Financials (Based on Availability)
- 16.2.9 Mueller Systems LLC
- 16.2.9.1. Overview
- 16.2.9.2. Products
- 16.2.9.3. SWOT Analysis
- 16.2.9.4. Recent Developments
- 16.2.9.5. Financials (Based on Availability)
- 16.2.1 Itron Inc
List of Figures
- Figure 1: Global US Smart Meter Industry Revenue Breakdown (Million, %) by Region 2024 & 2032
- Figure 2: Global US Smart Meter Industry Volume Breakdown (K Unit, %) by Region 2024 & 2032
- Figure 3: United states US Smart Meter Industry Revenue (Million), by Country 2024 & 2032
- Figure 4: United states US Smart Meter Industry Volume (K Unit), by Country 2024 & 2032
- Figure 5: United states US Smart Meter Industry Revenue Share (%), by Country 2024 & 2032
- Figure 6: United states US Smart Meter Industry Volume Share (%), by Country 2024 & 2032
- Figure 7: North America US Smart Meter Industry Revenue (Million), by Type 2024 & 2032
- Figure 8: North America US Smart Meter Industry Volume (K Unit), by Type 2024 & 2032
- Figure 9: North America US Smart Meter Industry Revenue Share (%), by Type 2024 & 2032
- Figure 10: North America US Smart Meter Industry Volume Share (%), by Type 2024 & 2032
- Figure 11: North America US Smart Meter Industry Revenue (Million), by End-User 2024 & 2032
- Figure 12: North America US Smart Meter Industry Volume (K Unit), by End-User 2024 & 2032
- Figure 13: North America US Smart Meter Industry Revenue Share (%), by End-User 2024 & 2032
- Figure 14: North America US Smart Meter Industry Volume Share (%), by End-User 2024 & 2032
- Figure 15: North America US Smart Meter Industry Revenue (Million), by Country 2024 & 2032
- Figure 16: North America US Smart Meter Industry Volume (K Unit), by Country 2024 & 2032
- Figure 17: North America US Smart Meter Industry Revenue Share (%), by Country 2024 & 2032
- Figure 18: North America US Smart Meter Industry Volume Share (%), by Country 2024 & 2032
- Figure 19: South America US Smart Meter Industry Revenue (Million), by Type 2024 & 2032
- Figure 20: South America US Smart Meter Industry Volume (K Unit), by Type 2024 & 2032
- Figure 21: South America US Smart Meter Industry Revenue Share (%), by Type 2024 & 2032
- Figure 22: South America US Smart Meter Industry Volume Share (%), by Type 2024 & 2032
- Figure 23: South America US Smart Meter Industry Revenue (Million), by End-User 2024 & 2032
- Figure 24: South America US Smart Meter Industry Volume (K Unit), by End-User 2024 & 2032
- Figure 25: South America US Smart Meter Industry Revenue Share (%), by End-User 2024 & 2032
- Figure 26: South America US Smart Meter Industry Volume Share (%), by End-User 2024 & 2032
- Figure 27: South America US Smart Meter Industry Revenue (Million), by Country 2024 & 2032
- Figure 28: South America US Smart Meter Industry Volume (K Unit), by Country 2024 & 2032
- Figure 29: South America US Smart Meter Industry Revenue Share (%), by Country 2024 & 2032
- Figure 30: South America US Smart Meter Industry Volume Share (%), by Country 2024 & 2032
- Figure 31: Europe US Smart Meter Industry Revenue (Million), by Type 2024 & 2032
- Figure 32: Europe US Smart Meter Industry Volume (K Unit), by Type 2024 & 2032
- Figure 33: Europe US Smart Meter Industry Revenue Share (%), by Type 2024 & 2032
- Figure 34: Europe US Smart Meter Industry Volume Share (%), by Type 2024 & 2032
- Figure 35: Europe US Smart Meter Industry Revenue (Million), by End-User 2024 & 2032
- Figure 36: Europe US Smart Meter Industry Volume (K Unit), by End-User 2024 & 2032
- Figure 37: Europe US Smart Meter Industry Revenue Share (%), by End-User 2024 & 2032
- Figure 38: Europe US Smart Meter Industry Volume Share (%), by End-User 2024 & 2032
- Figure 39: Europe US Smart Meter Industry Revenue (Million), by Country 2024 & 2032
- Figure 40: Europe US Smart Meter Industry Volume (K Unit), by Country 2024 & 2032
- Figure 41: Europe US Smart Meter Industry Revenue Share (%), by Country 2024 & 2032
- Figure 42: Europe US Smart Meter Industry Volume Share (%), by Country 2024 & 2032
- Figure 43: Middle East & Africa US Smart Meter Industry Revenue (Million), by Type 2024 & 2032
- Figure 44: Middle East & Africa US Smart Meter Industry Volume (K Unit), by Type 2024 & 2032
- Figure 45: Middle East & Africa US Smart Meter Industry Revenue Share (%), by Type 2024 & 2032
- Figure 46: Middle East & Africa US Smart Meter Industry Volume Share (%), by Type 2024 & 2032
- Figure 47: Middle East & Africa US Smart Meter Industry Revenue (Million), by End-User 2024 & 2032
- Figure 48: Middle East & Africa US Smart Meter Industry Volume (K Unit), by End-User 2024 & 2032
- Figure 49: Middle East & Africa US Smart Meter Industry Revenue Share (%), by End-User 2024 & 2032
- Figure 50: Middle East & Africa US Smart Meter Industry Volume Share (%), by End-User 2024 & 2032
- Figure 51: Middle East & Africa US Smart Meter Industry Revenue (Million), by Country 2024 & 2032
- Figure 52: Middle East & Africa US Smart Meter Industry Volume (K Unit), by Country 2024 & 2032
- Figure 53: Middle East & Africa US Smart Meter Industry Revenue Share (%), by Country 2024 & 2032
- Figure 54: Middle East & Africa US Smart Meter Industry Volume Share (%), by Country 2024 & 2032
- Figure 55: Asia Pacific US Smart Meter Industry Revenue (Million), by Type 2024 & 2032
- Figure 56: Asia Pacific US Smart Meter Industry Volume (K Unit), by Type 2024 & 2032
- Figure 57: Asia Pacific US Smart Meter Industry Revenue Share (%), by Type 2024 & 2032
- Figure 58: Asia Pacific US Smart Meter Industry Volume Share (%), by Type 2024 & 2032
- Figure 59: Asia Pacific US Smart Meter Industry Revenue (Million), by End-User 2024 & 2032
- Figure 60: Asia Pacific US Smart Meter Industry Volume (K Unit), by End-User 2024 & 2032
- Figure 61: Asia Pacific US Smart Meter Industry Revenue Share (%), by End-User 2024 & 2032
- Figure 62: Asia Pacific US Smart Meter Industry Volume Share (%), by End-User 2024 & 2032
- Figure 63: Asia Pacific US Smart Meter Industry Revenue (Million), by Country 2024 & 2032
- Figure 64: Asia Pacific US Smart Meter Industry Volume (K Unit), by Country 2024 & 2032
- Figure 65: Asia Pacific US Smart Meter Industry Revenue Share (%), by Country 2024 & 2032
- Figure 66: Asia Pacific US Smart Meter Industry Volume Share (%), by Country 2024 & 2032
List of Tables
- Table 1: Global US Smart Meter Industry Revenue Million Forecast, by Region 2019 & 2032
- Table 2: Global US Smart Meter Industry Volume K Unit Forecast, by Region 2019 & 2032
- Table 3: Global US Smart Meter Industry Revenue Million Forecast, by Type 2019 & 2032
- Table 4: Global US Smart Meter Industry Volume K Unit Forecast, by Type 2019 & 2032
- Table 5: Global US Smart Meter Industry Revenue Million Forecast, by End-User 2019 & 2032
- Table 6: Global US Smart Meter Industry Volume K Unit Forecast, by End-User 2019 & 2032
- Table 7: Global US Smart Meter Industry Revenue Million Forecast, by Region 2019 & 2032
- Table 8: Global US Smart Meter Industry Volume K Unit Forecast, by Region 2019 & 2032
- Table 9: Global US Smart Meter Industry Revenue Million Forecast, by Country 2019 & 2032
- Table 10: Global US Smart Meter Industry Volume K Unit Forecast, by Country 2019 & 2032
- Table 11: Northeast US Smart Meter Industry Revenue (Million) Forecast, by Application 2019 & 2032
- Table 12: Northeast US Smart Meter Industry Volume (K Unit) Forecast, by Application 2019 & 2032
- Table 13: Southeast US Smart Meter Industry Revenue (Million) Forecast, by Application 2019 & 2032
- Table 14: Southeast US Smart Meter Industry Volume (K Unit) Forecast, by Application 2019 & 2032
- Table 15: Midwest US Smart Meter Industry Revenue (Million) Forecast, by Application 2019 & 2032
- Table 16: Midwest US Smart Meter Industry Volume (K Unit) Forecast, by Application 2019 & 2032
- Table 17: Southwest US Smart Meter Industry Revenue (Million) Forecast, by Application 2019 & 2032
- Table 18: Southwest US Smart Meter Industry Volume (K Unit) Forecast, by Application 2019 & 2032
- Table 19: West US Smart Meter Industry Revenue (Million) Forecast, by Application 2019 & 2032
- Table 20: West US Smart Meter Industry Volume (K Unit) Forecast, by Application 2019 & 2032
- Table 21: Global US Smart Meter Industry Revenue Million Forecast, by Type 2019 & 2032
- Table 22: Global US Smart Meter Industry Volume K Unit Forecast, by Type 2019 & 2032
- Table 23: Global US Smart Meter Industry Revenue Million Forecast, by End-User 2019 & 2032
- Table 24: Global US Smart Meter Industry Volume K Unit Forecast, by End-User 2019 & 2032
- Table 25: Global US Smart Meter Industry Revenue Million Forecast, by Country 2019 & 2032
- Table 26: Global US Smart Meter Industry Volume K Unit Forecast, by Country 2019 & 2032
- Table 27: United States US Smart Meter Industry Revenue (Million) Forecast, by Application 2019 & 2032
- Table 28: United States US Smart Meter Industry Volume (K Unit) Forecast, by Application 2019 & 2032
- Table 29: Canada US Smart Meter Industry Revenue (Million) Forecast, by Application 2019 & 2032
- Table 30: Canada US Smart Meter Industry Volume (K Unit) Forecast, by Application 2019 & 2032
- Table 31: Mexico US Smart Meter Industry Revenue (Million) Forecast, by Application 2019 & 2032
- Table 32: Mexico US Smart Meter Industry Volume (K Unit) Forecast, by Application 2019 & 2032
- Table 33: Global US Smart Meter Industry Revenue Million Forecast, by Type 2019 & 2032
- Table 34: Global US Smart Meter Industry Volume K Unit Forecast, by Type 2019 & 2032
- Table 35: Global US Smart Meter Industry Revenue Million Forecast, by End-User 2019 & 2032
- Table 36: Global US Smart Meter Industry Volume K Unit Forecast, by End-User 2019 & 2032
- Table 37: Global US Smart Meter Industry Revenue Million Forecast, by Country 2019 & 2032
- Table 38: Global US Smart Meter Industry Volume K Unit Forecast, by Country 2019 & 2032
- Table 39: Brazil US Smart Meter Industry Revenue (Million) Forecast, by Application 2019 & 2032
- Table 40: Brazil US Smart Meter Industry Volume (K Unit) Forecast, by Application 2019 & 2032
- Table 41: Argentina US Smart Meter Industry Revenue (Million) Forecast, by Application 2019 & 2032
- Table 42: Argentina US Smart Meter Industry Volume (K Unit) Forecast, by Application 2019 & 2032
- Table 43: Rest of South America US Smart Meter Industry Revenue (Million) Forecast, by Application 2019 & 2032
- Table 44: Rest of South America US Smart Meter Industry Volume (K Unit) Forecast, by Application 2019 & 2032
- Table 45: Global US Smart Meter Industry Revenue Million Forecast, by Type 2019 & 2032
- Table 46: Global US Smart Meter Industry Volume K Unit Forecast, by Type 2019 & 2032
- Table 47: Global US Smart Meter Industry Revenue Million Forecast, by End-User 2019 & 2032
- Table 48: Global US Smart Meter Industry Volume K Unit Forecast, by End-User 2019 & 2032
- Table 49: Global US Smart Meter Industry Revenue Million Forecast, by Country 2019 & 2032
- Table 50: Global US Smart Meter Industry Volume K Unit Forecast, by Country 2019 & 2032
- Table 51: United Kingdom US Smart Meter Industry Revenue (Million) Forecast, by Application 2019 & 2032
- Table 52: United Kingdom US Smart Meter Industry Volume (K Unit) Forecast, by Application 2019 & 2032
- Table 53: Germany US Smart Meter Industry Revenue (Million) Forecast, by Application 2019 & 2032
- Table 54: Germany US Smart Meter Industry Volume (K Unit) Forecast, by Application 2019 & 2032
- Table 55: France US Smart Meter Industry Revenue (Million) Forecast, by Application 2019 & 2032
- Table 56: France US Smart Meter Industry Volume (K Unit) Forecast, by Application 2019 & 2032
- Table 57: Italy US Smart Meter Industry Revenue (Million) Forecast, by Application 2019 & 2032
- Table 58: Italy US Smart Meter Industry Volume (K Unit) Forecast, by Application 2019 & 2032
- Table 59: Spain US Smart Meter Industry Revenue (Million) Forecast, by Application 2019 & 2032
- Table 60: Spain US Smart Meter Industry Volume (K Unit) Forecast, by Application 2019 & 2032
- Table 61: Russia US Smart Meter Industry Revenue (Million) Forecast, by Application 2019 & 2032
- Table 62: Russia US Smart Meter Industry Volume (K Unit) Forecast, by Application 2019 & 2032
- Table 63: Benelux US Smart Meter Industry Revenue (Million) Forecast, by Application 2019 & 2032
- Table 64: Benelux US Smart Meter Industry Volume (K Unit) Forecast, by Application 2019 & 2032
- Table 65: Nordics US Smart Meter Industry Revenue (Million) Forecast, by Application 2019 & 2032
- Table 66: Nordics US Smart Meter Industry Volume (K Unit) Forecast, by Application 2019 & 2032
- Table 67: Rest of Europe US Smart Meter Industry Revenue (Million) Forecast, by Application 2019 & 2032
- Table 68: Rest of Europe US Smart Meter Industry Volume (K Unit) Forecast, by Application 2019 & 2032
- Table 69: Global US Smart Meter Industry Revenue Million Forecast, by Type 2019 & 2032
- Table 70: Global US Smart Meter Industry Volume K Unit Forecast, by Type 2019 & 2032
- Table 71: Global US Smart Meter Industry Revenue Million Forecast, by End-User 2019 & 2032
- Table 72: Global US Smart Meter Industry Volume K Unit Forecast, by End-User 2019 & 2032
- Table 73: Global US Smart Meter Industry Revenue Million Forecast, by Country 2019 & 2032
- Table 74: Global US Smart Meter Industry Volume K Unit Forecast, by Country 2019 & 2032
- Table 75: Turkey US Smart Meter Industry Revenue (Million) Forecast, by Application 2019 & 2032
- Table 76: Turkey US Smart Meter Industry Volume (K Unit) Forecast, by Application 2019 & 2032
- Table 77: Israel US Smart Meter Industry Revenue (Million) Forecast, by Application 2019 & 2032
- Table 78: Israel US Smart Meter Industry Volume (K Unit) Forecast, by Application 2019 & 2032
- Table 79: GCC US Smart Meter Industry Revenue (Million) Forecast, by Application 2019 & 2032
- Table 80: GCC US Smart Meter Industry Volume (K Unit) Forecast, by Application 2019 & 2032
- Table 81: North Africa US Smart Meter Industry Revenue (Million) Forecast, by Application 2019 & 2032
- Table 82: North Africa US Smart Meter Industry Volume (K Unit) Forecast, by Application 2019 & 2032
- Table 83: South Africa US Smart Meter Industry Revenue (Million) Forecast, by Application 2019 & 2032
- Table 84: South Africa US Smart Meter Industry Volume (K Unit) Forecast, by Application 2019 & 2032
- Table 85: Rest of Middle East & Africa US Smart Meter Industry Revenue (Million) Forecast, by Application 2019 & 2032
- Table 86: Rest of Middle East & Africa US Smart Meter Industry Volume (K Unit) Forecast, by Application 2019 & 2032
- Table 87: Global US Smart Meter Industry Revenue Million Forecast, by Type 2019 & 2032
- Table 88: Global US Smart Meter Industry Volume K Unit Forecast, by Type 2019 & 2032
- Table 89: Global US Smart Meter Industry Revenue Million Forecast, by End-User 2019 & 2032
- Table 90: Global US Smart Meter Industry Volume K Unit Forecast, by End-User 2019 & 2032
- Table 91: Global US Smart Meter Industry Revenue Million Forecast, by Country 2019 & 2032
- Table 92: Global US Smart Meter Industry Volume K Unit Forecast, by Country 2019 & 2032
- Table 93: China US Smart Meter Industry Revenue (Million) Forecast, by Application 2019 & 2032
- Table 94: China US Smart Meter Industry Volume (K Unit) Forecast, by Application 2019 & 2032
- Table 95: India US Smart Meter Industry Revenue (Million) Forecast, by Application 2019 & 2032
- Table 96: India US Smart Meter Industry Volume (K Unit) Forecast, by Application 2019 & 2032
- Table 97: Japan US Smart Meter Industry Revenue (Million) Forecast, by Application 2019 & 2032
- Table 98: Japan US Smart Meter Industry Volume (K Unit) Forecast, by Application 2019 & 2032
- Table 99: South Korea US Smart Meter Industry Revenue (Million) Forecast, by Application 2019 & 2032
- Table 100: South Korea US Smart Meter Industry Volume (K Unit) Forecast, by Application 2019 & 2032
- Table 101: ASEAN US Smart Meter Industry Revenue (Million) Forecast, by Application 2019 & 2032
- Table 102: ASEAN US Smart Meter Industry Volume (K Unit) Forecast, by Application 2019 & 2032
- Table 103: Oceania US Smart Meter Industry Revenue (Million) Forecast, by Application 2019 & 2032
- Table 104: Oceania US Smart Meter Industry Volume (K Unit) Forecast, by Application 2019 & 2032
- Table 105: Rest of Asia Pacific US Smart Meter Industry Revenue (Million) Forecast, by Application 2019 & 2032
- Table 106: Rest of Asia Pacific US Smart Meter Industry Volume (K Unit) Forecast, by Application 2019 & 2032
Frequently Asked Questions
1. What is the projected Compound Annual Growth Rate (CAGR) of the US Smart Meter Industry?
The projected CAGR is approximately 9.80%.
2. Which companies are prominent players in the US Smart Meter Industry?
Key companies in the market include Itron Inc, Badger Meter Inc, Kamstrup, Elster American Meter (Honeywell International Inc ), Neptune Technology Group Inc, Sensus USA Inc (Xylem Inc ), General Electric Co, Diehl Metering US, Mueller Systems LLC.
3. What are the main segments of the US Smart Meter Industry?
The market segments include Type, End-User.
4. Can you provide details about the market size?
The market size is estimated to be USD XX Million as of 2022.
5. What are some drivers contributing to market growth?
Higher Consumer Awareness and Government Regulations Mandating the Installation of Smart Meters; Increased Investments in Smart Grid Projects; Investments in Smart City Developments.
6. What are the notable trends driving market growth?
Smart Gas Meter Segment to Grow Significantly.
7. Are there any restraints impacting market growth?
High Installation Cost and Longer ROI Period; Longer Replacement Cycle of Water Meters.
8. Can you provide examples of recent developments in the market?
January 2021 - Badger Meter, Inc. announced the acquisition of US-based Analytical Technology, Inc. (ATi), a privately held provider of water quality monitoring systems, for USD 44 million. ATi specializes in the design, manufacture and distribution of water quality instruments based on electrochemical and optical sensors.
9. What pricing options are available for accessing the report?
Pricing options include single-user, multi-user, and enterprise licenses priced at USD 3800, USD 4500, and USD 5800 respectively.
10. Is the market size provided in terms of value or volume?
The market size is provided in terms of value, measured in Million and volume, measured in K Unit.
11. Are there any specific market keywords associated with the report?
Yes, the market keyword associated with the report is "US Smart Meter Industry," which aids in identifying and referencing the specific market segment covered.
12. How do I determine which pricing option suits my needs best?
The pricing options vary based on user requirements and access needs. Individual users may opt for single-user licenses, while businesses requiring broader access may choose multi-user or enterprise licenses for cost-effective access to the report.
13. Are there any additional resources or data provided in the US Smart Meter Industry report?
While the report offers comprehensive insights, it's advisable to review the specific contents or supplementary materials provided to ascertain if additional resources or data are available.
14. How can I stay updated on further developments or reports in the US Smart Meter Industry?
To stay informed about further developments, trends, and reports in the US Smart Meter Industry, consider subscribing to industry newsletters, following relevant companies and organizations, or regularly checking reputable industry news sources and publications.
Methodology
Step 1 - Identification of Relevant Samples Size from Population Database


Step 2 - Approaches for Defining Global Market Size (Value, Volume* & Price*)

Note*: In applicable scenarios
Step 3 - Data Sources
Primary Research
- Web Analytics
- Survey Reports
- Research Institute
- Latest Research Reports
- Opinion Leaders
Secondary Research
- Annual Reports
- White Paper
- Latest Press Release
- Industry Association
- Paid Database
- Investor Presentations

Step 4 - Data Triangulation
Involves using different sources of information in order to increase the validity of a study
These sources are likely to be stakeholders in a program - participants, other researchers, program staff, other community members, and so on.
Then we put all data in single framework & apply various statistical tools to find out the dynamic on the market.
During the analysis stage, feedback from the stakeholder groups would be compared to determine areas of agreement as well as areas of divergence
