

Key Insights
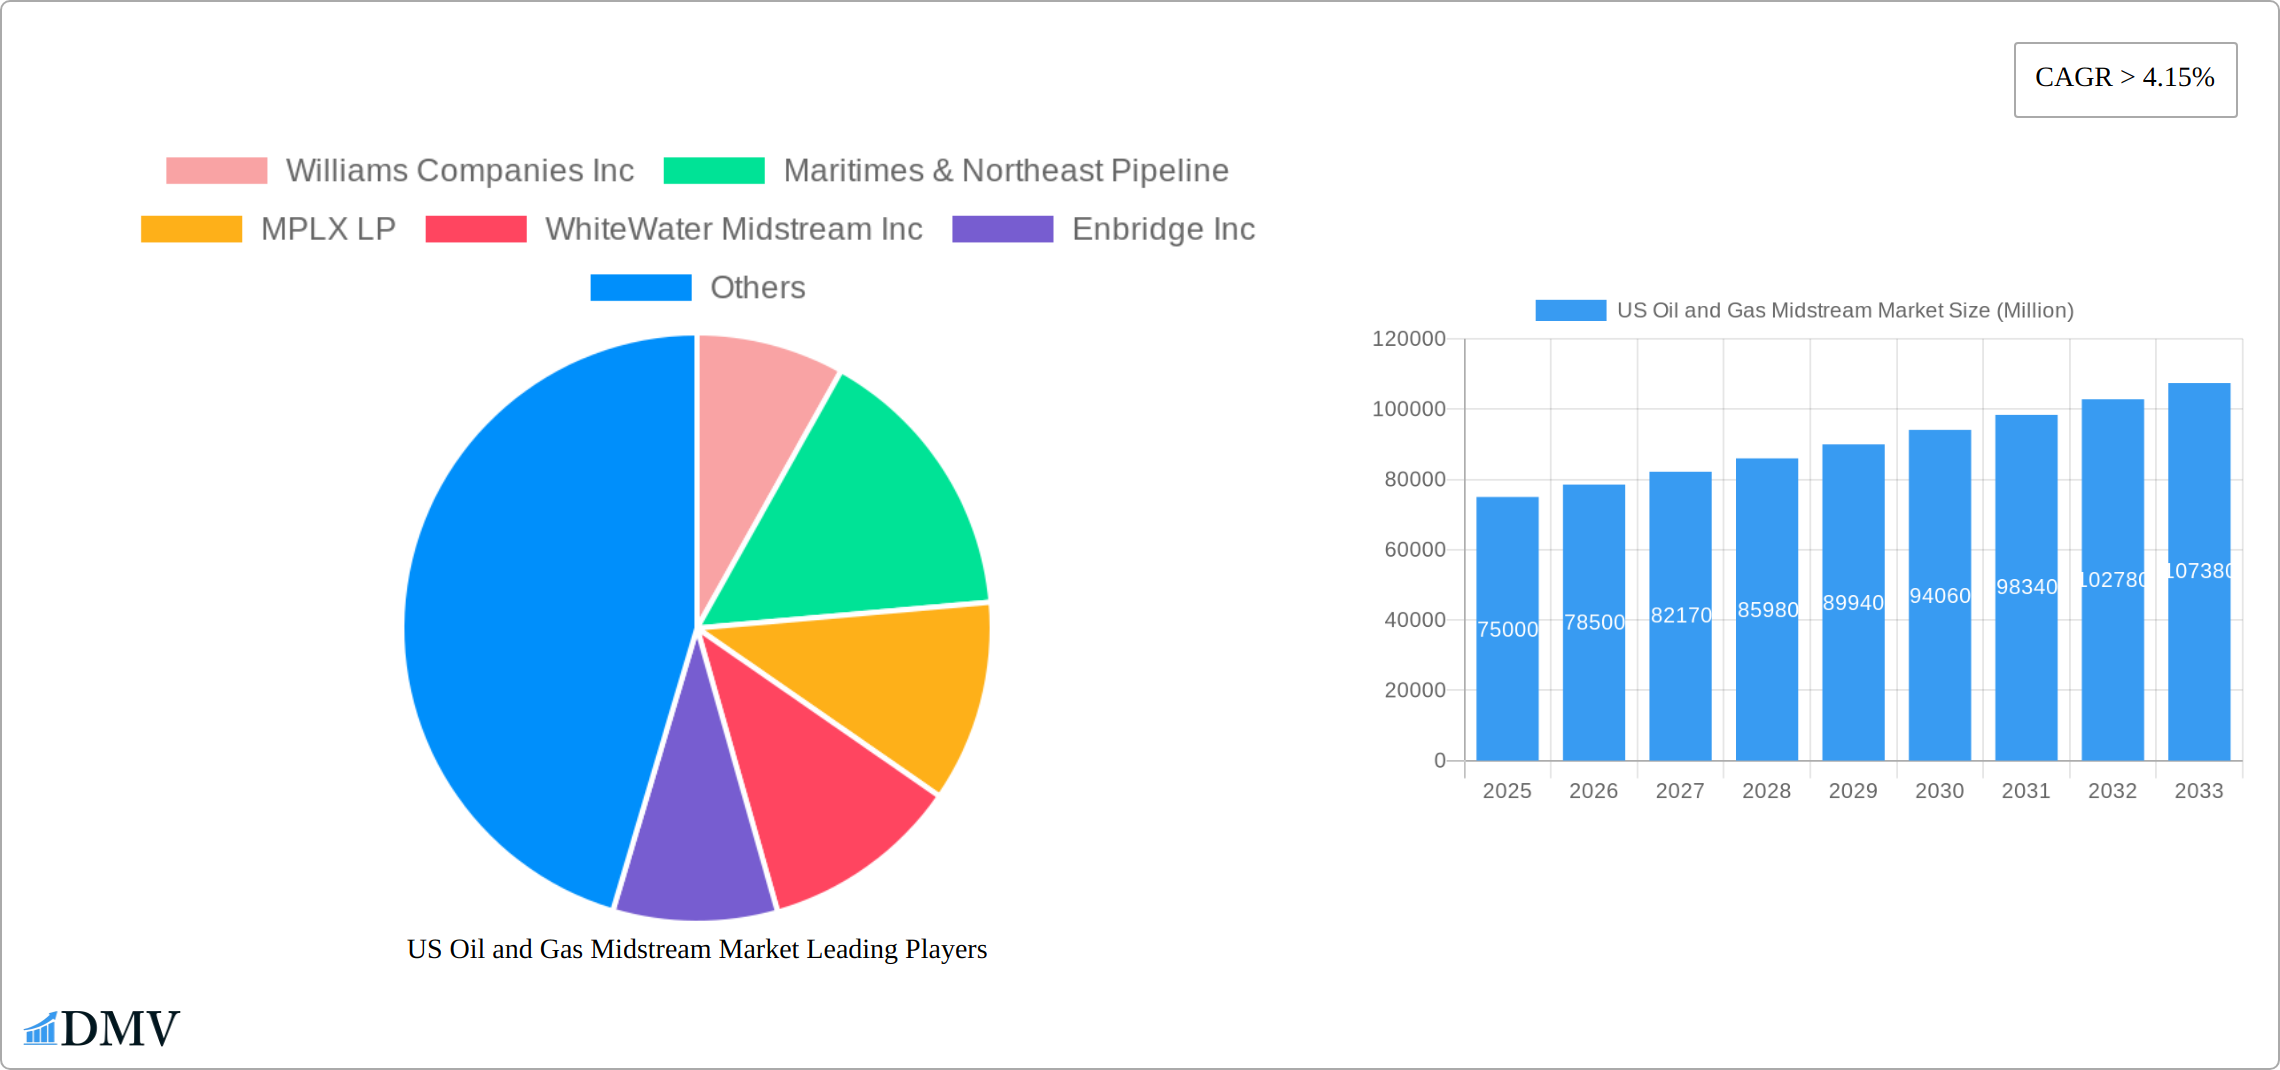
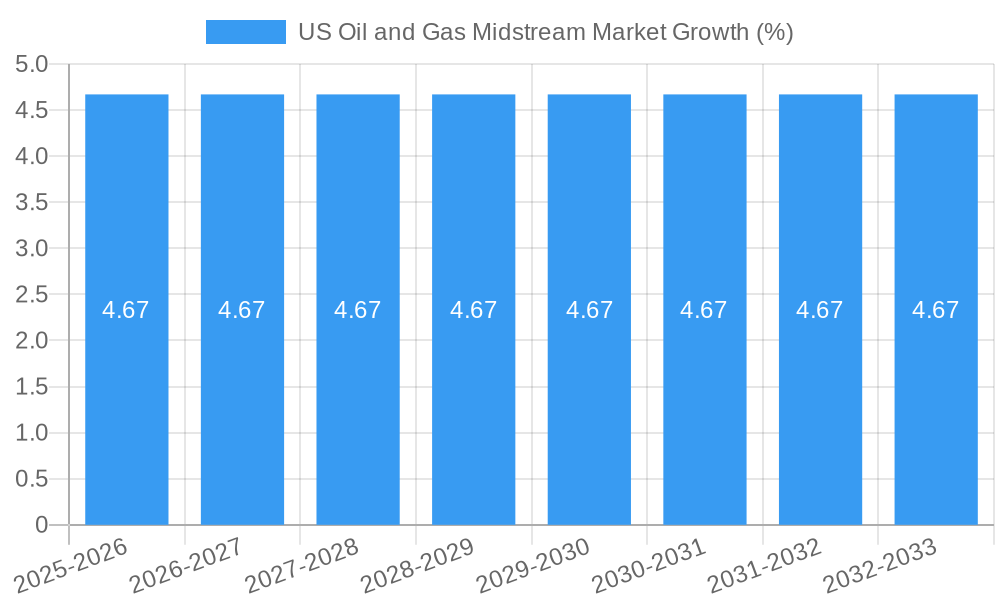
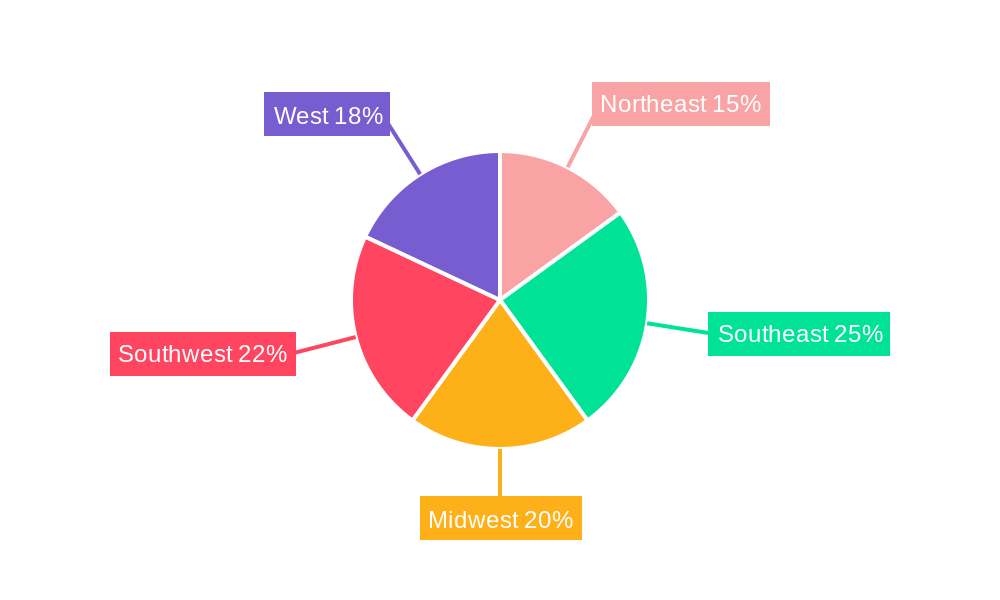
The US oil and gas midstream market, encompassing transportation, storage, and processing of oil, natural gas, and natural gas liquids (NGLs), is experiencing robust growth. Driven by increasing domestic energy production, particularly shale gas, and the ongoing need for efficient infrastructure to transport these resources across the vast US geography, the market is projected to maintain a Compound Annual Growth Rate (CAGR) exceeding 4.15% from 2025 to 2033. Key growth drivers include expanding pipeline networks to serve new production areas, investments in enhanced storage facilities to accommodate fluctuating demand and supply, and technological advancements improving efficiency and safety in processing plants. Regional variations exist, with the Southwest and Southeast benefiting significantly from shale gas development and robust refining activity. However, regulatory hurdles, environmental concerns surrounding pipeline construction, and potential fluctuations in energy prices pose some constraints to the market's growth trajectory. Significant players such as Williams Companies, Enbridge, and Enterprise Products Partners are strategically positioning themselves through mergers, acquisitions, and capacity expansions to capitalize on the expanding market opportunities. The market segmentation, focusing on products (crude oil, natural gas, NGLs) and applications (transportation, storage, processing), provides valuable insights for targeted investment and strategic planning. Competition is intense, with established players vying for market share while smaller, specialized midstream companies seek to carve out niches.
The continued growth of the US oil and gas midstream market is inextricably linked to the overall energy landscape. Future growth hinges on factors including government policies supporting infrastructure development, technological innovation leading to lower operational costs and environmental impact, and sustained domestic and international demand for energy. While challenges exist, the long-term outlook for the US oil and gas midstream sector remains positive, offering attractive prospects for investors and industry participants alike. The forecast for 2033 assumes a conservative estimation based on a projected CAGR, taking into account potential market fluctuations and regulatory changes. A deeper dive into specific regional dynamics and individual company performance is crucial for a comprehensive market understanding.
US Oil and Gas Midstream Market Market Composition & Trends
The US Oil and Gas Midstream Market is characterized by a diverse yet concentrated market structure, where a few key players dominate the landscape. Companies such as Williams Companies Inc, Enbridge Inc, and Kinder Morgan Inc hold significant market shares, often exceeding 10% each, illustrating the high concentration within the sector. Innovation in this market is propelled by the need for efficiency and environmental sustainability, with a focus on developing new technologies for natural gas liquids processing and transportation. The regulatory landscape, influenced by agencies like the Federal Energy Regulatory Commission (FERC), plays a pivotal role in shaping market trends, often driving investments towards safer and greener technologies.
- Market Share Distribution: The top three companies, Williams Companies Inc, Enbridge Inc, and Kinder Morgan Inc, collectively account for around 35% of the market.
- Innovation Catalysts: Advancements in pipeline technology and natural gas liquids processing are key drivers, spurred by environmental regulations and the push for energy efficiency.
- Regulatory Landscape: The FERC's stringent guidelines on infrastructure development and environmental impact assessments influence project timelines and investment decisions.
- Substitute Products: The rise of renewable energy sources poses a potential threat to traditional midstream operations, although midstream services remain critical for the transition phase.
- End-User Profiles: The primary end-users are refineries and petrochemical plants, which rely heavily on the transportation and storage services provided by midstream companies.
- M&A Activities: Recent mergers and acquisitions, such as the $3.2 Million acquisition of a midstream asset by Energy Transfer Operating LP, reflect the strategic consolidation within the industry.
US Oil and Gas Midstream Market Industry Evolution
The US Oil and Gas Midstream Market has undergone significant evolution over the study period of 2019-2033, with notable growth trajectories driven by both technological advancements and shifting consumer demands. The market's growth rate, which stood at a compound annual growth rate (CAGR) of approximately 4.5% from 2019 to 2024, is expected to accelerate to a projected CAGR of 5.2% from 2025 to 2033. This growth is largely attributed to the expansion of shale gas production and the subsequent need for enhanced midstream infrastructure.
Technological advancements have played a crucial role in this evolution. Innovations in pipeline integrity monitoring systems and the adoption of smart technologies for real-time data analysis have improved operational efficiencies and reduced downtime. For instance, the implementation of advanced sensor technologies has led to a 20% reduction in unplanned maintenance events across the sector. Additionally, the rise of liquefied natural gas (LNG) as a cleaner alternative to traditional fuels has spurred investments in LNG processing and transportation facilities, with a notable 30% increase in LNG export capacity planned by 2030.
Consumer demands have also shifted, with a growing emphasis on sustainability and reduced environmental impact. This has led midstream companies to invest in cleaner technologies and to explore carbon capture and storage solutions. The demand for natural gas liquids, driven by their use in petrochemical manufacturing, has also contributed to market growth, with an expected increase in processing capacity by 15% over the forecast period.
Leading Regions, Countries, or Segments in US Oil and Gas Midstream Market
The US Oil and Gas Midstream Market is notably dominated by the natural gas segment, particularly in the application of transportation. This segment's dominance can be attributed to several key drivers and factors:
- Investment Trends: Significant investments in natural gas pipeline infrastructure, with over $50 Million committed in 2024 alone, underscore the sector's growth potential.
- Regulatory Support: Favorable regulatory environments, including tax incentives for natural gas infrastructure development, have bolstered the segment's expansion.
- Technological Advancements: The adoption of advanced pipeline monitoring systems and the development of LNG export facilities have enhanced the efficiency and capacity of natural gas transportation.
The dominance of the natural gas segment in transportation is further solidified by the strategic location of shale gas reserves, particularly in the Permian Basin and Marcellus Shale regions. These areas have seen a surge in midstream infrastructure development, driven by the need to transport the increasing volumes of natural gas to end-users and export markets. The transportation segment's growth is expected to continue, supported by ongoing investments and technological innovations that enhance the safety and efficiency of gas delivery systems.
US Oil and Gas Midstream Market Product Innovations
Innovations in the US Oil and Gas Midstream Market are centered around enhancing the efficiency and environmental sustainability of midstream operations. The development of smart pipeline technologies, which incorporate IoT and AI for real-time monitoring and predictive maintenance, stands out as a key innovation. These technologies reduce operational risks and improve the reliability of oil and gas transportation. Additionally, advancements in natural gas liquids processing have led to the creation of more efficient extraction and purification methods, increasing the yield and quality of products like propane and butane. These innovations not only improve performance metrics but also align with the industry's push towards sustainability.
Propelling Factors for US Oil and Gas Midstream Market Growth
Several factors are propelling the growth of the US Oil and Gas Midstream Market:
- Technological Advancements: The integration of IoT and AI in pipeline monitoring enhances operational efficiency and safety.
- Economic Influences: The increase in shale gas production has heightened the demand for midstream services, driving infrastructure investments.
- Regulatory Environment: Government policies favoring natural gas infrastructure development and LNG exports are key growth drivers.
These factors collectively contribute to the market's robust growth trajectory, with a focus on sustainable and efficient midstream operations.
Obstacles in the US Oil and Gas Midstream Market Market
The US Oil and Gas Midstream Market faces several obstacles that could impede its growth:
- Regulatory Challenges: Stringent environmental regulations increase project costs and timelines, potentially delaying infrastructure development.
- Supply Chain Disruptions: Global supply chain issues, exacerbated by geopolitical tensions, can affect the availability of critical equipment and materials.
- Competitive Pressures: The rise of renewable energy sources poses a competitive threat, with potential market share loss estimated at 5% by 2030.
These barriers necessitate strategic planning and adaptation to maintain market growth and competitiveness.
Future Opportunities in US Oil and Gas Midstream Market
Emerging opportunities in the US Oil and Gas Midstream Market include:
- Expansion into New Markets: Increasing demand for LNG in Asia presents opportunities for midstream companies to expand their export capabilities.
- Technological Innovations: The development of carbon capture and storage technologies offers a pathway to more sustainable operations.
- Consumer Trends: A shift towards cleaner energy sources like natural gas liquids creates new avenues for growth in processing and transportation.
These opportunities are poised to shape the future of the midstream market, driving innovation and expansion.
Major Players in the US Oil and Gas Midstream Market Ecosystem
- Williams Companies Inc
- Maritimes & Northeast Pipeline
- MPLX LP
- WhiteWater Midstream Inc
- Enbridge Inc
- Atlantic Coast Pipeline
- Enterprise Products Partners LP
- Energy Transfer Operating LP
- ONEOK Gas Transportation LLC
- Plains All American Pipeline LP
- Kinder Morgan Inc
Key Developments in US Oil and Gas Midstream Market Industry
- March 2022: New Fortress Energy Inc. announced the execution of two 20-year sale and purchase agreements (SPA) with Venture Global LNG. Under the agreement, Venture Global will supply 2 million tonnes per annum (MTPA) of LNG on a free on board (FOB) basis from its LNG facilities in Louisiana. This development is significant as it strengthens the supply chain for LNG and supports the growth of the midstream market.
- November 2020: The Saginaw Trail Pipeline, a Consumer Energy interstate project replacing and expanding pipelines and other infrastructure, entered service with 200 MMcf/d (5.66 MMcm/d) of capacity in the central Michigan counties of Saginaw, Genesse, and Oakland. This project enhances the transportation capacity of natural gas, contributing to the market's expansion and efficiency.
Strategic US Oil and Gas Midstream Market Market Forecast
The US Oil and Gas Midstream Market is poised for strategic growth over the forecast period of 2025-2033, driven by several key catalysts. The continued expansion of shale gas production will necessitate further investments in midstream infrastructure, particularly in transportation and storage facilities. Additionally, the global demand for LNG, especially from emerging markets in Asia, presents significant opportunities for market expansion. Technological innovations, such as the adoption of AI and IoT for pipeline monitoring, will enhance operational efficiency and safety, further supporting market growth. The market's potential is underscored by the projected CAGR of 5.2%, reflecting a robust future for the US Oil and Gas Midstream Market.
US Oil and Gas Midstream Market Segmentation
- 1. Transportation
- 2. Storage
- 3. LNG Terminals
US Oil and Gas Midstream Market Segmentation By Geography
-
1. North America
- 1.1. United States
- 1.2. Canada
- 1.3. Mexico
-
2. South America
- 2.1. Brazil
- 2.2. Argentina
- 2.3. Rest of South America
-
3. Europe
- 3.1. United Kingdom
- 3.2. Germany
- 3.3. France
- 3.4. Italy
- 3.5. Spain
- 3.6. Russia
- 3.7. Benelux
- 3.8. Nordics
- 3.9. Rest of Europe
-
4. Middle East & Africa
- 4.1. Turkey
- 4.2. Israel
- 4.3. GCC
- 4.4. North Africa
- 4.5. South Africa
- 4.6. Rest of Middle East & Africa
-
5. Asia Pacific
- 5.1. China
- 5.2. India
- 5.3. Japan
- 5.4. South Korea
- 5.5. ASEAN
- 5.6. Oceania
- 5.7. Rest of Asia Pacific
US Oil and Gas Midstream Market REPORT HIGHLIGHTS
| Aspects | Details |
|---|---|
| Study Period | 2019-2033 |
| Base Year | 2024 |
| Estimated Year | 2025 |
| Forecast Period | 2025-2033 |
| Historical Period | 2019-2024 |
| Growth Rate | CAGR of > 4.15% from 2019-2033 |
| Segmentation |
|
Table of Contents
- 1. Introduction
- 1.1. Research Scope
- 1.2. Market Segmentation
- 1.3. Research Methodology
- 1.4. Definitions and Assumptions
- 2. Executive Summary
- 2.1. Introduction
- 3. Market Dynamics
- 3.1. Introduction
- 3.2. Market Drivers
- 3.2.1. An Increase in the Use of LNG as an Energy Source
- 3.3. Market Restrains
- 3.3.1. Increasing Adoption of Solar and Wind Energy
- 3.4. Market Trends
- 3.4.1. The Transportation Segment Expected to Dominate the Market
- 4. Market Factor Analysis
- 4.1. Porters Five Forces
- 4.2. Supply/Value Chain
- 4.3. PESTEL analysis
- 4.4. Market Entropy
- 4.5. Patent/Trademark Analysis
- 5. Global US Oil and Gas Midstream Market Analysis, Insights and Forecast, 2019-2031
- 5.1. Market Analysis, Insights and Forecast - by Transportation
- 5.2. Market Analysis, Insights and Forecast - by Storage
- 5.3. Market Analysis, Insights and Forecast - by LNG Terminals
- 5.4. Market Analysis, Insights and Forecast - by Region
- 5.4.1. North America
- 5.4.2. South America
- 5.4.3. Europe
- 5.4.4. Middle East & Africa
- 5.4.5. Asia Pacific
- 5.1. Market Analysis, Insights and Forecast - by Transportation
- 6. North America US Oil and Gas Midstream Market Analysis, Insights and Forecast, 2019-2031
- 6.1. Market Analysis, Insights and Forecast - by Transportation
- 6.2. Market Analysis, Insights and Forecast - by Storage
- 6.3. Market Analysis, Insights and Forecast - by LNG Terminals
- 6.1. Market Analysis, Insights and Forecast - by Transportation
- 7. South America US Oil and Gas Midstream Market Analysis, Insights and Forecast, 2019-2031
- 7.1. Market Analysis, Insights and Forecast - by Transportation
- 7.2. Market Analysis, Insights and Forecast - by Storage
- 7.3. Market Analysis, Insights and Forecast - by LNG Terminals
- 7.1. Market Analysis, Insights and Forecast - by Transportation
- 8. Europe US Oil and Gas Midstream Market Analysis, Insights and Forecast, 2019-2031
- 8.1. Market Analysis, Insights and Forecast - by Transportation
- 8.2. Market Analysis, Insights and Forecast - by Storage
- 8.3. Market Analysis, Insights and Forecast - by LNG Terminals
- 8.1. Market Analysis, Insights and Forecast - by Transportation
- 9. Middle East & Africa US Oil and Gas Midstream Market Analysis, Insights and Forecast, 2019-2031
- 9.1. Market Analysis, Insights and Forecast - by Transportation
- 9.2. Market Analysis, Insights and Forecast - by Storage
- 9.3. Market Analysis, Insights and Forecast - by LNG Terminals
- 9.1. Market Analysis, Insights and Forecast - by Transportation
- 10. Asia Pacific US Oil and Gas Midstream Market Analysis, Insights and Forecast, 2019-2031
- 10.1. Market Analysis, Insights and Forecast - by Transportation
- 10.2. Market Analysis, Insights and Forecast - by Storage
- 10.3. Market Analysis, Insights and Forecast - by LNG Terminals
- 10.1. Market Analysis, Insights and Forecast - by Transportation
- 11. Northeast US Oil and Gas Midstream Market Analysis, Insights and Forecast, 2019-2031
- 12. Southeast US Oil and Gas Midstream Market Analysis, Insights and Forecast, 2019-2031
- 13. Midwest US Oil and Gas Midstream Market Analysis, Insights and Forecast, 2019-2031
- 14. Southwest US Oil and Gas Midstream Market Analysis, Insights and Forecast, 2019-2031
- 15. West US Oil and Gas Midstream Market Analysis, Insights and Forecast, 2019-2031
- 16. Competitive Analysis
- 16.1. Global Market Share Analysis 2024
- 16.2. Company Profiles
- 16.2.1 Williams Companies Inc
- 16.2.1.1. Overview
- 16.2.1.2. Products
- 16.2.1.3. SWOT Analysis
- 16.2.1.4. Recent Developments
- 16.2.1.5. Financials (Based on Availability)
- 16.2.2 Maritimes & Northeast Pipeline
- 16.2.2.1. Overview
- 16.2.2.2. Products
- 16.2.2.3. SWOT Analysis
- 16.2.2.4. Recent Developments
- 16.2.2.5. Financials (Based on Availability)
- 16.2.3 MPLX LP
- 16.2.3.1. Overview
- 16.2.3.2. Products
- 16.2.3.3. SWOT Analysis
- 16.2.3.4. Recent Developments
- 16.2.3.5. Financials (Based on Availability)
- 16.2.4 WhiteWater Midstream Inc
- 16.2.4.1. Overview
- 16.2.4.2. Products
- 16.2.4.3. SWOT Analysis
- 16.2.4.4. Recent Developments
- 16.2.4.5. Financials (Based on Availability)
- 16.2.5 Enbridge Inc
- 16.2.5.1. Overview
- 16.2.5.2. Products
- 16.2.5.3. SWOT Analysis
- 16.2.5.4. Recent Developments
- 16.2.5.5. Financials (Based on Availability)
- 16.2.6 Atlantic Coast Pipeline
- 16.2.6.1. Overview
- 16.2.6.2. Products
- 16.2.6.3. SWOT Analysis
- 16.2.6.4. Recent Developments
- 16.2.6.5. Financials (Based on Availability)
- 16.2.7 Enterprise Products Partners LP
- 16.2.7.1. Overview
- 16.2.7.2. Products
- 16.2.7.3. SWOT Analysis
- 16.2.7.4. Recent Developments
- 16.2.7.5. Financials (Based on Availability)
- 16.2.8 Energy Transfer Operating LP
- 16.2.8.1. Overview
- 16.2.8.2. Products
- 16.2.8.3. SWOT Analysis
- 16.2.8.4. Recent Developments
- 16.2.8.5. Financials (Based on Availability)
- 16.2.9 ONEOK Gas Transportation LLC
- 16.2.9.1. Overview
- 16.2.9.2. Products
- 16.2.9.3. SWOT Analysis
- 16.2.9.4. Recent Developments
- 16.2.9.5. Financials (Based on Availability)
- 16.2.10 Plains All American Pipeline LP
- 16.2.10.1. Overview
- 16.2.10.2. Products
- 16.2.10.3. SWOT Analysis
- 16.2.10.4. Recent Developments
- 16.2.10.5. Financials (Based on Availability)
- 16.2.11 Kinder Morgan Inc
- 16.2.11.1. Overview
- 16.2.11.2. Products
- 16.2.11.3. SWOT Analysis
- 16.2.11.4. Recent Developments
- 16.2.11.5. Financials (Based on Availability)
- 16.2.1 Williams Companies Inc
List of Figures
- Figure 1: Global US Oil and Gas Midstream Market Revenue Breakdown (Million, %) by Region 2024 & 2032
- Figure 2: United states US Oil and Gas Midstream Market Revenue (Million), by Country 2024 & 2032
- Figure 3: United states US Oil and Gas Midstream Market Revenue Share (%), by Country 2024 & 2032
- Figure 4: North America US Oil and Gas Midstream Market Revenue (Million), by Transportation 2024 & 2032
- Figure 5: North America US Oil and Gas Midstream Market Revenue Share (%), by Transportation 2024 & 2032
- Figure 6: North America US Oil and Gas Midstream Market Revenue (Million), by Storage 2024 & 2032
- Figure 7: North America US Oil and Gas Midstream Market Revenue Share (%), by Storage 2024 & 2032
- Figure 8: North America US Oil and Gas Midstream Market Revenue (Million), by LNG Terminals 2024 & 2032
- Figure 9: North America US Oil and Gas Midstream Market Revenue Share (%), by LNG Terminals 2024 & 2032
- Figure 10: North America US Oil and Gas Midstream Market Revenue (Million), by Country 2024 & 2032
- Figure 11: North America US Oil and Gas Midstream Market Revenue Share (%), by Country 2024 & 2032
- Figure 12: South America US Oil and Gas Midstream Market Revenue (Million), by Transportation 2024 & 2032
- Figure 13: South America US Oil and Gas Midstream Market Revenue Share (%), by Transportation 2024 & 2032
- Figure 14: South America US Oil and Gas Midstream Market Revenue (Million), by Storage 2024 & 2032
- Figure 15: South America US Oil and Gas Midstream Market Revenue Share (%), by Storage 2024 & 2032
- Figure 16: South America US Oil and Gas Midstream Market Revenue (Million), by LNG Terminals 2024 & 2032
- Figure 17: South America US Oil and Gas Midstream Market Revenue Share (%), by LNG Terminals 2024 & 2032
- Figure 18: South America US Oil and Gas Midstream Market Revenue (Million), by Country 2024 & 2032
- Figure 19: South America US Oil and Gas Midstream Market Revenue Share (%), by Country 2024 & 2032
- Figure 20: Europe US Oil and Gas Midstream Market Revenue (Million), by Transportation 2024 & 2032
- Figure 21: Europe US Oil and Gas Midstream Market Revenue Share (%), by Transportation 2024 & 2032
- Figure 22: Europe US Oil and Gas Midstream Market Revenue (Million), by Storage 2024 & 2032
- Figure 23: Europe US Oil and Gas Midstream Market Revenue Share (%), by Storage 2024 & 2032
- Figure 24: Europe US Oil and Gas Midstream Market Revenue (Million), by LNG Terminals 2024 & 2032
- Figure 25: Europe US Oil and Gas Midstream Market Revenue Share (%), by LNG Terminals 2024 & 2032
- Figure 26: Europe US Oil and Gas Midstream Market Revenue (Million), by Country 2024 & 2032
- Figure 27: Europe US Oil and Gas Midstream Market Revenue Share (%), by Country 2024 & 2032
- Figure 28: Middle East & Africa US Oil and Gas Midstream Market Revenue (Million), by Transportation 2024 & 2032
- Figure 29: Middle East & Africa US Oil and Gas Midstream Market Revenue Share (%), by Transportation 2024 & 2032
- Figure 30: Middle East & Africa US Oil and Gas Midstream Market Revenue (Million), by Storage 2024 & 2032
- Figure 31: Middle East & Africa US Oil and Gas Midstream Market Revenue Share (%), by Storage 2024 & 2032
- Figure 32: Middle East & Africa US Oil and Gas Midstream Market Revenue (Million), by LNG Terminals 2024 & 2032
- Figure 33: Middle East & Africa US Oil and Gas Midstream Market Revenue Share (%), by LNG Terminals 2024 & 2032
- Figure 34: Middle East & Africa US Oil and Gas Midstream Market Revenue (Million), by Country 2024 & 2032
- Figure 35: Middle East & Africa US Oil and Gas Midstream Market Revenue Share (%), by Country 2024 & 2032
- Figure 36: Asia Pacific US Oil and Gas Midstream Market Revenue (Million), by Transportation 2024 & 2032
- Figure 37: Asia Pacific US Oil and Gas Midstream Market Revenue Share (%), by Transportation 2024 & 2032
- Figure 38: Asia Pacific US Oil and Gas Midstream Market Revenue (Million), by Storage 2024 & 2032
- Figure 39: Asia Pacific US Oil and Gas Midstream Market Revenue Share (%), by Storage 2024 & 2032
- Figure 40: Asia Pacific US Oil and Gas Midstream Market Revenue (Million), by LNG Terminals 2024 & 2032
- Figure 41: Asia Pacific US Oil and Gas Midstream Market Revenue Share (%), by LNG Terminals 2024 & 2032
- Figure 42: Asia Pacific US Oil and Gas Midstream Market Revenue (Million), by Country 2024 & 2032
- Figure 43: Asia Pacific US Oil and Gas Midstream Market Revenue Share (%), by Country 2024 & 2032
List of Tables
- Table 1: Global US Oil and Gas Midstream Market Revenue Million Forecast, by Region 2019 & 2032
- Table 2: Global US Oil and Gas Midstream Market Revenue Million Forecast, by Transportation 2019 & 2032
- Table 3: Global US Oil and Gas Midstream Market Revenue Million Forecast, by Storage 2019 & 2032
- Table 4: Global US Oil and Gas Midstream Market Revenue Million Forecast, by LNG Terminals 2019 & 2032
- Table 5: Global US Oil and Gas Midstream Market Revenue Million Forecast, by Region 2019 & 2032
- Table 6: Global US Oil and Gas Midstream Market Revenue Million Forecast, by Country 2019 & 2032
- Table 7: Northeast US Oil and Gas Midstream Market Revenue (Million) Forecast, by Application 2019 & 2032
- Table 8: Southeast US Oil and Gas Midstream Market Revenue (Million) Forecast, by Application 2019 & 2032
- Table 9: Midwest US Oil and Gas Midstream Market Revenue (Million) Forecast, by Application 2019 & 2032
- Table 10: Southwest US Oil and Gas Midstream Market Revenue (Million) Forecast, by Application 2019 & 2032
- Table 11: West US Oil and Gas Midstream Market Revenue (Million) Forecast, by Application 2019 & 2032
- Table 12: Global US Oil and Gas Midstream Market Revenue Million Forecast, by Transportation 2019 & 2032
- Table 13: Global US Oil and Gas Midstream Market Revenue Million Forecast, by Storage 2019 & 2032
- Table 14: Global US Oil and Gas Midstream Market Revenue Million Forecast, by LNG Terminals 2019 & 2032
- Table 15: Global US Oil and Gas Midstream Market Revenue Million Forecast, by Country 2019 & 2032
- Table 16: United States US Oil and Gas Midstream Market Revenue (Million) Forecast, by Application 2019 & 2032
- Table 17: Canada US Oil and Gas Midstream Market Revenue (Million) Forecast, by Application 2019 & 2032
- Table 18: Mexico US Oil and Gas Midstream Market Revenue (Million) Forecast, by Application 2019 & 2032
- Table 19: Global US Oil and Gas Midstream Market Revenue Million Forecast, by Transportation 2019 & 2032
- Table 20: Global US Oil and Gas Midstream Market Revenue Million Forecast, by Storage 2019 & 2032
- Table 21: Global US Oil and Gas Midstream Market Revenue Million Forecast, by LNG Terminals 2019 & 2032
- Table 22: Global US Oil and Gas Midstream Market Revenue Million Forecast, by Country 2019 & 2032
- Table 23: Brazil US Oil and Gas Midstream Market Revenue (Million) Forecast, by Application 2019 & 2032
- Table 24: Argentina US Oil and Gas Midstream Market Revenue (Million) Forecast, by Application 2019 & 2032
- Table 25: Rest of South America US Oil and Gas Midstream Market Revenue (Million) Forecast, by Application 2019 & 2032
- Table 26: Global US Oil and Gas Midstream Market Revenue Million Forecast, by Transportation 2019 & 2032
- Table 27: Global US Oil and Gas Midstream Market Revenue Million Forecast, by Storage 2019 & 2032
- Table 28: Global US Oil and Gas Midstream Market Revenue Million Forecast, by LNG Terminals 2019 & 2032
- Table 29: Global US Oil and Gas Midstream Market Revenue Million Forecast, by Country 2019 & 2032
- Table 30: United Kingdom US Oil and Gas Midstream Market Revenue (Million) Forecast, by Application 2019 & 2032
- Table 31: Germany US Oil and Gas Midstream Market Revenue (Million) Forecast, by Application 2019 & 2032
- Table 32: France US Oil and Gas Midstream Market Revenue (Million) Forecast, by Application 2019 & 2032
- Table 33: Italy US Oil and Gas Midstream Market Revenue (Million) Forecast, by Application 2019 & 2032
- Table 34: Spain US Oil and Gas Midstream Market Revenue (Million) Forecast, by Application 2019 & 2032
- Table 35: Russia US Oil and Gas Midstream Market Revenue (Million) Forecast, by Application 2019 & 2032
- Table 36: Benelux US Oil and Gas Midstream Market Revenue (Million) Forecast, by Application 2019 & 2032
- Table 37: Nordics US Oil and Gas Midstream Market Revenue (Million) Forecast, by Application 2019 & 2032
- Table 38: Rest of Europe US Oil and Gas Midstream Market Revenue (Million) Forecast, by Application 2019 & 2032
- Table 39: Global US Oil and Gas Midstream Market Revenue Million Forecast, by Transportation 2019 & 2032
- Table 40: Global US Oil and Gas Midstream Market Revenue Million Forecast, by Storage 2019 & 2032
- Table 41: Global US Oil and Gas Midstream Market Revenue Million Forecast, by LNG Terminals 2019 & 2032
- Table 42: Global US Oil and Gas Midstream Market Revenue Million Forecast, by Country 2019 & 2032
- Table 43: Turkey US Oil and Gas Midstream Market Revenue (Million) Forecast, by Application 2019 & 2032
- Table 44: Israel US Oil and Gas Midstream Market Revenue (Million) Forecast, by Application 2019 & 2032
- Table 45: GCC US Oil and Gas Midstream Market Revenue (Million) Forecast, by Application 2019 & 2032
- Table 46: North Africa US Oil and Gas Midstream Market Revenue (Million) Forecast, by Application 2019 & 2032
- Table 47: South Africa US Oil and Gas Midstream Market Revenue (Million) Forecast, by Application 2019 & 2032
- Table 48: Rest of Middle East & Africa US Oil and Gas Midstream Market Revenue (Million) Forecast, by Application 2019 & 2032
- Table 49: Global US Oil and Gas Midstream Market Revenue Million Forecast, by Transportation 2019 & 2032
- Table 50: Global US Oil and Gas Midstream Market Revenue Million Forecast, by Storage 2019 & 2032
- Table 51: Global US Oil and Gas Midstream Market Revenue Million Forecast, by LNG Terminals 2019 & 2032
- Table 52: Global US Oil and Gas Midstream Market Revenue Million Forecast, by Country 2019 & 2032
- Table 53: China US Oil and Gas Midstream Market Revenue (Million) Forecast, by Application 2019 & 2032
- Table 54: India US Oil and Gas Midstream Market Revenue (Million) Forecast, by Application 2019 & 2032
- Table 55: Japan US Oil and Gas Midstream Market Revenue (Million) Forecast, by Application 2019 & 2032
- Table 56: South Korea US Oil and Gas Midstream Market Revenue (Million) Forecast, by Application 2019 & 2032
- Table 57: ASEAN US Oil and Gas Midstream Market Revenue (Million) Forecast, by Application 2019 & 2032
- Table 58: Oceania US Oil and Gas Midstream Market Revenue (Million) Forecast, by Application 2019 & 2032
- Table 59: Rest of Asia Pacific US Oil and Gas Midstream Market Revenue (Million) Forecast, by Application 2019 & 2032
Frequently Asked Questions
1. What is the projected Compound Annual Growth Rate (CAGR) of the US Oil and Gas Midstream Market?
The projected CAGR is approximately > 4.15%.
2. Which companies are prominent players in the US Oil and Gas Midstream Market?
Key companies in the market include Williams Companies Inc, Maritimes & Northeast Pipeline, MPLX LP, WhiteWater Midstream Inc, Enbridge Inc, Atlantic Coast Pipeline, Enterprise Products Partners LP, Energy Transfer Operating LP, ONEOK Gas Transportation LLC, Plains All American Pipeline LP, Kinder Morgan Inc.
3. What are the main segments of the US Oil and Gas Midstream Market?
The market segments include Transportation, Storage, LNG Terminals.
4. Can you provide details about the market size?
The market size is estimated to be USD XX Million as of 2022.
5. What are some drivers contributing to market growth?
An Increase in the Use of LNG as an Energy Source.
6. What are the notable trends driving market growth?
The Transportation Segment Expected to Dominate the Market.
7. Are there any restraints impacting market growth?
Increasing Adoption of Solar and Wind Energy.
8. Can you provide examples of recent developments in the market?
In March 2022, New Fortress Energy Inc. announced the execution of two 20-year sale and purchase agreements (SPA) with Venture Global LNG. Under the agreement, Venture Global will supply 2 million tonnes per annum (MTPA) of LNG on a free on board (FOB) basis from its LNG facilities in Louisiana.
9. What pricing options are available for accessing the report?
Pricing options include single-user, multi-user, and enterprise licenses priced at USD 3800, USD 4500, and USD 5800 respectively.
10. Is the market size provided in terms of value or volume?
The market size is provided in terms of value, measured in Million.
11. Are there any specific market keywords associated with the report?
Yes, the market keyword associated with the report is "US Oil and Gas Midstream Market," which aids in identifying and referencing the specific market segment covered.
12. How do I determine which pricing option suits my needs best?
The pricing options vary based on user requirements and access needs. Individual users may opt for single-user licenses, while businesses requiring broader access may choose multi-user or enterprise licenses for cost-effective access to the report.
13. Are there any additional resources or data provided in the US Oil and Gas Midstream Market report?
While the report offers comprehensive insights, it's advisable to review the specific contents or supplementary materials provided to ascertain if additional resources or data are available.
14. How can I stay updated on further developments or reports in the US Oil and Gas Midstream Market?
To stay informed about further developments, trends, and reports in the US Oil and Gas Midstream Market, consider subscribing to industry newsletters, following relevant companies and organizations, or regularly checking reputable industry news sources and publications.
Methodology
Step 1 - Identification of Relevant Samples Size from Population Database


Step 2 - Approaches for Defining Global Market Size (Value, Volume* & Price*)

Note*: In applicable scenarios
Step 3 - Data Sources
Primary Research
- Web Analytics
- Survey Reports
- Research Institute
- Latest Research Reports
- Opinion Leaders
Secondary Research
- Annual Reports
- White Paper
- Latest Press Release
- Industry Association
- Paid Database
- Investor Presentations

Step 4 - Data Triangulation
Involves using different sources of information in order to increase the validity of a study
These sources are likely to be stakeholders in a program - participants, other researchers, program staff, other community members, and so on.
Then we put all data in single framework & apply various statistical tools to find out the dynamic on the market.
During the analysis stage, feedback from the stakeholder groups would be compared to determine areas of agreement as well as areas of divergence
