

Key Insights
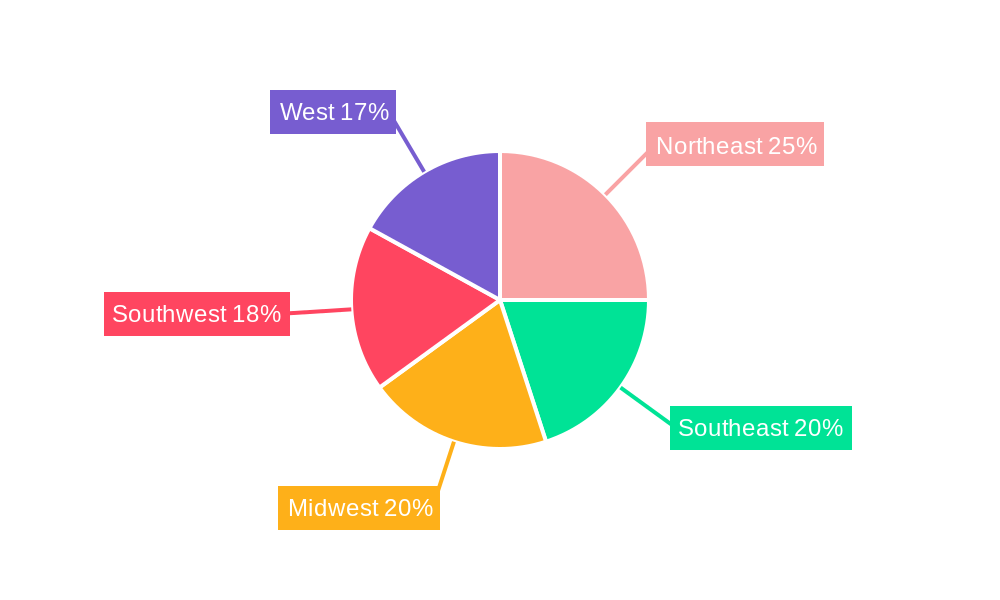
The US oil and gas downstream refining industry, a cornerstone of the nation's energy infrastructure, is projected to experience steady growth over the forecast period (2025-2033). Driven by robust demand from the transportation sector, particularly gasoline and diesel fuel, the market is poised for expansion. Growth will be further fueled by increasing energy consumption in power generation and the manufacturing sector, alongside consistent demand for heating oil in residential and commercial applications. While environmental regulations and fluctuating crude oil prices pose challenges, technological advancements in refining processes and a focus on cleaner fuels are mitigating these restraints. The market's segmentation, encompassing gasoline, diesel, jet fuel, heating oil, and other refined products, caters to a diverse end-user base, ensuring market resilience. Regional variations exist, with the transportation hubs of the Northeast and West likely to show stronger growth than some midwestern states.
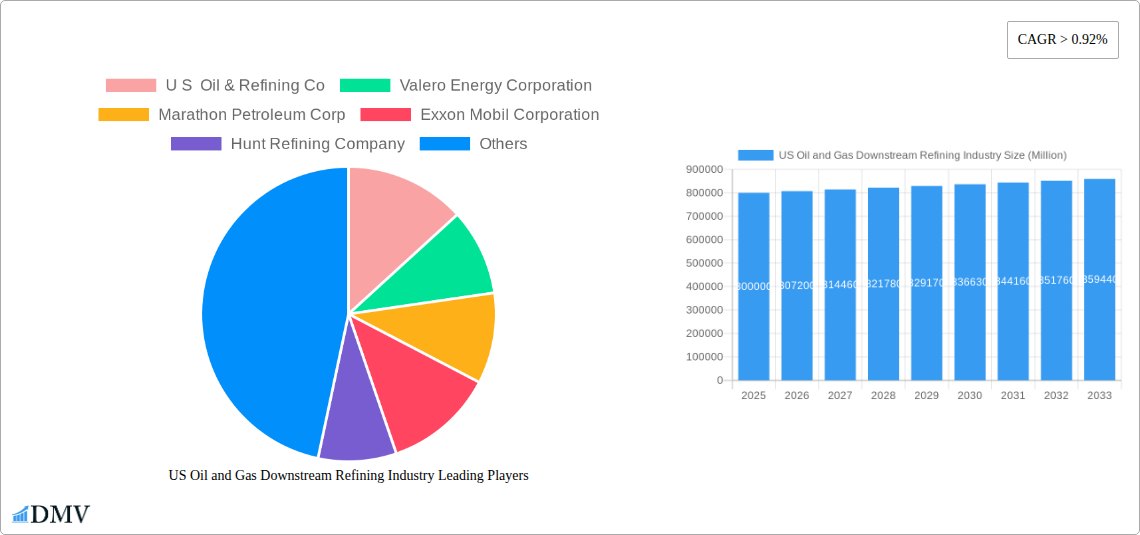
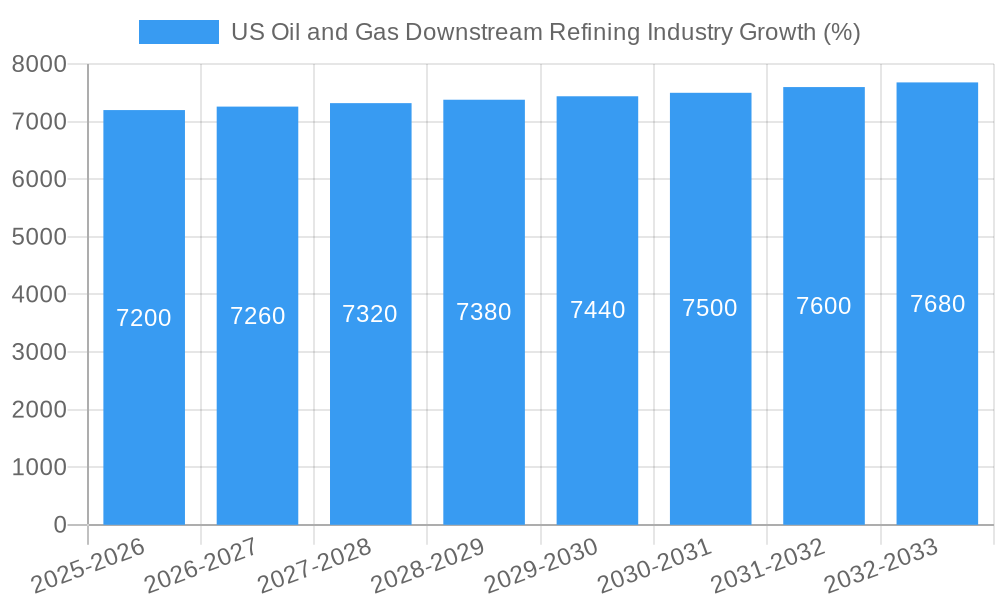
The industry's competitive landscape is dominated by major integrated oil companies like Exxon Mobil, Marathon Petroleum, and Valero Energy, alongside independent refiners contributing significantly to the overall production. These companies are actively investing in capacity upgrades and adopting advanced technologies to improve efficiency and reduce environmental impact. Furthermore, the shift toward biofuels and alternative energy sources presents both opportunities and challenges. While these alternatives could potentially impact demand for traditional refined products in the long term, the industry is adapting by exploring integration and diversification strategies. Given the projected CAGR of 0.92%, the market is expected to witness a gradual, yet consistent, increase in value, reaching significant figures by 2033. Precise projections require further analysis incorporating specific regional data and detailed consumption patterns, but existing data points to a positive outlook for the foreseeable future.
US Oil and Gas Downstream Refining Industry: A Comprehensive Market Report (2019-2033)
This insightful report provides a comprehensive analysis of the US Oil and Gas Downstream Refining Industry, offering a detailed examination of market trends, competitive dynamics, and future growth prospects. Spanning the period from 2019 to 2033, with a focus on the 2025-2033 forecast period, this report is an essential resource for stakeholders seeking to understand and navigate this dynamic sector. The report utilizes a base year of 2025 and includes a historical period review covering 2019-2024. The analysis covers key segments including gasoline, diesel, jet fuel, heating oil, and other refined products, across end-user industries such as transportation, power generation, manufacturing, and residential/commercial sectors. Expect detailed market sizing in Millions (USD).
US Oil and Gas Downstream Refining Industry Market Composition & Trends
This section delves into the intricate structure of the US Oil and Gas Downstream Refining Industry, examining market concentration, innovation drivers, regulatory frameworks, substitute products, end-user profiles, and merger & acquisition (M&A) activities. The highly consolidated nature of the market is analyzed, highlighting the significant market share held by major players like ExxonMobil, Valero, and Marathon Petroleum. The report quantifies market share distribution, providing a detailed breakdown of each major player's position. Furthermore, it explores the impact of regulatory changes, such as emission standards and environmental regulations, on industry dynamics. Innovation within the sector, including advancements in refining technologies and the adoption of biofuels, is also examined. The influence of substitute products, such as electric vehicles and renewable energy sources, is assessed, along with their potential impact on market demand. Finally, a comprehensive overview of recent M&A activities, including deal values and their implications for market consolidation, is presented.
- Market Concentration: High, with the top 5 players controlling approximately xx% of the market.
- Innovation Catalysts: Stringent emission regulations, increasing demand for cleaner fuels, and technological advancements in refining processes.
- Regulatory Landscape: EPA regulations, state-level environmental policies, and fuel quality standards significantly influence industry operations.
- Substitute Products: Growth of electric vehicles and renewable energy sources presents a long-term competitive challenge.
- End-User Profiles: Transportation sector dominates demand, followed by power generation and manufacturing.
- M&A Activities: 2019-2024 witnessed xx billion USD in M&A deals, primarily focused on consolidation and expansion.
US Oil and Gas Downstream Refining Industry Industry Evolution
This section provides a detailed analysis of the evolutionary trajectory of the US Oil and Gas Downstream Refining Industry. It examines market growth trends, charting the expansion and contraction of specific segments. Technological progress, including advancements in refining efficiency and the development of sustainable fuels, are highlighted. Furthermore, this section explores the evolving preferences of consumers and businesses, and their influence on product demand and market dynamics. The report includes specific data points, such as compound annual growth rates (CAGRs) for various segments during the study period. The effects of external factors like global economic shifts, geopolitical events, and energy price fluctuations on industry performance are discussed. The impact of technological advancements like process optimization and automation on efficiency and operational costs is examined, alongside the role of digital transformation in enhancing supply chain management and decision-making within the industry.
Leading Regions, Countries, or Segments in US Oil and Gas Downstream Refining Industry
This section identifies the dominant regions, countries, and segments within the US Oil and Gas Downstream Refining Industry. It pinpoints the leading product segment (e.g., gasoline, diesel) and the primary end-user industry (e.g., transportation). A detailed analysis of factors driving the dominance of these specific segments is provided. Key drivers are explored using bullet points, and the dominance factors are analyzed in depth using comprehensive paragraphs.
- Dominant Product Segment: Gasoline, driven by high vehicle ownership and transportation demand.
- Dominant End-User Industry: Transportation, owing to its significant reliance on refined petroleum products.
- Key Drivers (Gasoline): Strong consumer demand, relatively low price compared to alternatives, established infrastructure.
- Key Drivers (Transportation): High vehicle ownership rates, limited adoption of alternative transportation modes.
- Geographic Dominance: Gulf Coast region, due to its access to crude oil supplies and established refining infrastructure.
US Oil and Gas Downstream Refining Industry Product Innovations
This section showcases the latest product innovations, emphasizing their applications and performance improvements. It highlights unique selling propositions and breakthroughs in refining technology. Examples include the introduction of cleaner-burning fuels, improved fuel efficiency additives, and the development of renewable fuel blends. The environmental impact and consumer benefits of these innovations are also described, highlighting how they meet changing market demands and regulatory requirements.
Propelling Factors for US Oil and Gas Downstream Refining Industry Growth
Several factors contribute to the growth of the US Oil and Gas Downstream Refining Industry. Technological advancements, such as improved refining efficiency and the development of cleaner fuels, play a significant role. Economic growth and rising energy consumption also drive market expansion. Favorable government policies and investments in refining infrastructure further contribute to industry growth.
Obstacles in the US Oil and Gas Downstream Refining Industry Market
The US Oil and Gas Downstream Refining Industry faces challenges such as stringent environmental regulations, increasing operational costs, and fluctuating crude oil prices. Supply chain disruptions and intensifying competition from alternative fuels further constrain market growth. The report quantifies the impact of these barriers on market expansion.
Future Opportunities in US Oil and Gas Downstream Refining Industry
The US Oil and Gas Downstream Refining Industry presents several future opportunities. Growth in renewable fuels, expansion into new markets, and technological advancements in refining processes offer potential for market expansion. The increasing demand for sustainable and cleaner fuels presents a significant opportunity for innovation and growth.
Major Players in the US Oil and Gas Downstream Refining Industry Ecosystem
- U S Oil & Refining Co
- Valero Energy Corporation
- Marathon Petroleum Corp
- Exxon Mobil Corporation
- Hunt Refining Company
- Royal Dutch Shell PLC
- Phillips
Key Developments in US Oil and Gas Downstream Refining Industry Industry
- Nov 2022: Chevron acquired Beyond6 LLC and its 55 CNG stations, expanding its presence in the alternative fuels market. This signals a shift towards diversification and investment in cleaner energy sources within the industry.
- Jan 2022: Airbus commenced manufacturing aircraft using a blend of renewable and conventional jet fuel at its US facility, boosting demand for sustainable aviation fuel. This development indicates a growing focus on reducing carbon emissions within the aviation sector and consequently, increasing the demand for specialized refined products.
Strategic US Oil and Gas Downstream Refining Industry Market Forecast
The future of the US Oil and Gas Downstream Refining Industry is characterized by a complex interplay of challenges and opportunities. While the transition towards cleaner energy sources presents a significant shift, the continued demand for traditional refined products, particularly gasoline and diesel, ensures continued market relevance. Strategic investments in refining infrastructure, technological advancements in producing sustainable fuels, and adaptation to evolving regulatory landscapes will be key determinants of future market growth and overall success within the sector. The forecast period suggests a moderate growth trajectory, driven by the ongoing need for refined petroleum products and the gradual integration of renewable and sustainable fuel alternatives.
US Oil and Gas Downstream Refining Industry Segmentation
- 1. Refining
- 2. Petrochemical
US Oil and Gas Downstream Refining Industry Segmentation By Geography
-
1. North America
- 1.1. United States
- 1.2. Canada
- 1.3. Mexico
-
2. South America
- 2.1. Brazil
- 2.2. Argentina
- 2.3. Rest of South America
-
3. Europe
- 3.1. United Kingdom
- 3.2. Germany
- 3.3. France
- 3.4. Italy
- 3.5. Spain
- 3.6. Russia
- 3.7. Benelux
- 3.8. Nordics
- 3.9. Rest of Europe
-
4. Middle East & Africa
- 4.1. Turkey
- 4.2. Israel
- 4.3. GCC
- 4.4. North Africa
- 4.5. South Africa
- 4.6. Rest of Middle East & Africa
-
5. Asia Pacific
- 5.1. China
- 5.2. India
- 5.3. Japan
- 5.4. South Korea
- 5.5. ASEAN
- 5.6. Oceania
- 5.7. Rest of Asia Pacific
US Oil and Gas Downstream Refining Industry REPORT HIGHLIGHTS
| Aspects | Details |
|---|---|
| Study Period | 2019-2033 |
| Base Year | 2024 |
| Estimated Year | 2025 |
| Forecast Period | 2025-2033 |
| Historical Period | 2019-2024 |
| Growth Rate | CAGR of > 0.92% from 2019-2033 |
| Segmentation |
|
Table of Contents
- 1. Introduction
- 1.1. Research Scope
- 1.2. Market Segmentation
- 1.3. Research Methodology
- 1.4. Definitions and Assumptions
- 2. Executive Summary
- 2.1. Introduction
- 3. Market Dynamics
- 3.1. Introduction
- 3.2. Market Drivers
- 3.2.1. Increasing Demand from Various End-user Industries
- 3.3. Market Restrains
- 3.3.1. Higher Capital and Operational Cost
- 3.4. Market Trends
- 3.4.1. Refining Sector to Register a Modest Growth
- 4. Market Factor Analysis
- 4.1. Porters Five Forces
- 4.2. Supply/Value Chain
- 4.3. PESTEL analysis
- 4.4. Market Entropy
- 4.5. Patent/Trademark Analysis
- 5. Global US Oil and Gas Downstream Refining Industry Analysis, Insights and Forecast, 2019-2031
- 5.1. Market Analysis, Insights and Forecast - by Refining
- 5.2. Market Analysis, Insights and Forecast - by Petrochemical
- 5.3. Market Analysis, Insights and Forecast - by Region
- 5.3.1. North America
- 5.3.2. South America
- 5.3.3. Europe
- 5.3.4. Middle East & Africa
- 5.3.5. Asia Pacific
- 5.1. Market Analysis, Insights and Forecast - by Refining
- 6. North America US Oil and Gas Downstream Refining Industry Analysis, Insights and Forecast, 2019-2031
- 6.1. Market Analysis, Insights and Forecast - by Refining
- 6.2. Market Analysis, Insights and Forecast - by Petrochemical
- 6.1. Market Analysis, Insights and Forecast - by Refining
- 7. South America US Oil and Gas Downstream Refining Industry Analysis, Insights and Forecast, 2019-2031
- 7.1. Market Analysis, Insights and Forecast - by Refining
- 7.2. Market Analysis, Insights and Forecast - by Petrochemical
- 7.1. Market Analysis, Insights and Forecast - by Refining
- 8. Europe US Oil and Gas Downstream Refining Industry Analysis, Insights and Forecast, 2019-2031
- 8.1. Market Analysis, Insights and Forecast - by Refining
- 8.2. Market Analysis, Insights and Forecast - by Petrochemical
- 8.1. Market Analysis, Insights and Forecast - by Refining
- 9. Middle East & Africa US Oil and Gas Downstream Refining Industry Analysis, Insights and Forecast, 2019-2031
- 9.1. Market Analysis, Insights and Forecast - by Refining
- 9.2. Market Analysis, Insights and Forecast - by Petrochemical
- 9.1. Market Analysis, Insights and Forecast - by Refining
- 10. Asia Pacific US Oil and Gas Downstream Refining Industry Analysis, Insights and Forecast, 2019-2031
- 10.1. Market Analysis, Insights and Forecast - by Refining
- 10.2. Market Analysis, Insights and Forecast - by Petrochemical
- 10.1. Market Analysis, Insights and Forecast - by Refining
- 11. Northeast US Oil and Gas Downstream Refining Industry Analysis, Insights and Forecast, 2019-2031
- 12. Southeast US Oil and Gas Downstream Refining Industry Analysis, Insights and Forecast, 2019-2031
- 13. Midwest US Oil and Gas Downstream Refining Industry Analysis, Insights and Forecast, 2019-2031
- 14. Southwest US Oil and Gas Downstream Refining Industry Analysis, Insights and Forecast, 2019-2031
- 15. West US Oil and Gas Downstream Refining Industry Analysis, Insights and Forecast, 2019-2031
- 16. Competitive Analysis
- 16.1. Global Market Share Analysis 2024
- 16.2. Company Profiles
- 16.2.1 U S Oil & Refining Co
- 16.2.1.1. Overview
- 16.2.1.2. Products
- 16.2.1.3. SWOT Analysis
- 16.2.1.4. Recent Developments
- 16.2.1.5. Financials (Based on Availability)
- 16.2.2 Valero Energy Corporation
- 16.2.2.1. Overview
- 16.2.2.2. Products
- 16.2.2.3. SWOT Analysis
- 16.2.2.4. Recent Developments
- 16.2.2.5. Financials (Based on Availability)
- 16.2.3 Marathon Petroleum Corp
- 16.2.3.1. Overview
- 16.2.3.2. Products
- 16.2.3.3. SWOT Analysis
- 16.2.3.4. Recent Developments
- 16.2.3.5. Financials (Based on Availability)
- 16.2.4 Exxon Mobil Corporation
- 16.2.4.1. Overview
- 16.2.4.2. Products
- 16.2.4.3. SWOT Analysis
- 16.2.4.4. Recent Developments
- 16.2.4.5. Financials (Based on Availability)
- 16.2.5 Hunt Refining Company
- 16.2.5.1. Overview
- 16.2.5.2. Products
- 16.2.5.3. SWOT Analysis
- 16.2.5.4. Recent Developments
- 16.2.5.5. Financials (Based on Availability)
- 16.2.6 Royal Dutch Shell PLC
- 16.2.6.1. Overview
- 16.2.6.2. Products
- 16.2.6.3. SWOT Analysis
- 16.2.6.4. Recent Developments
- 16.2.6.5. Financials (Based on Availability)
- 16.2.7 Phillips
- 16.2.7.1. Overview
- 16.2.7.2. Products
- 16.2.7.3. SWOT Analysis
- 16.2.7.4. Recent Developments
- 16.2.7.5. Financials (Based on Availability)
- 16.2.1 U S Oil & Refining Co
List of Figures
- Figure 1: Global US Oil and Gas Downstream Refining Industry Revenue Breakdown (Million, %) by Region 2024 & 2032
- Figure 2: Global US Oil and Gas Downstream Refining Industry Volume Breakdown (N, %) by Region 2024 & 2032
- Figure 3: United states US Oil and Gas Downstream Refining Industry Revenue (Million), by Country 2024 & 2032
- Figure 4: United states US Oil and Gas Downstream Refining Industry Volume (N), by Country 2024 & 2032
- Figure 5: United states US Oil and Gas Downstream Refining Industry Revenue Share (%), by Country 2024 & 2032
- Figure 6: United states US Oil and Gas Downstream Refining Industry Volume Share (%), by Country 2024 & 2032
- Figure 7: North America US Oil and Gas Downstream Refining Industry Revenue (Million), by Refining 2024 & 2032
- Figure 8: North America US Oil and Gas Downstream Refining Industry Volume (N), by Refining 2024 & 2032
- Figure 9: North America US Oil and Gas Downstream Refining Industry Revenue Share (%), by Refining 2024 & 2032
- Figure 10: North America US Oil and Gas Downstream Refining Industry Volume Share (%), by Refining 2024 & 2032
- Figure 11: North America US Oil and Gas Downstream Refining Industry Revenue (Million), by Petrochemical 2024 & 2032
- Figure 12: North America US Oil and Gas Downstream Refining Industry Volume (N), by Petrochemical 2024 & 2032
- Figure 13: North America US Oil and Gas Downstream Refining Industry Revenue Share (%), by Petrochemical 2024 & 2032
- Figure 14: North America US Oil and Gas Downstream Refining Industry Volume Share (%), by Petrochemical 2024 & 2032
- Figure 15: North America US Oil and Gas Downstream Refining Industry Revenue (Million), by Country 2024 & 2032
- Figure 16: North America US Oil and Gas Downstream Refining Industry Volume (N), by Country 2024 & 2032
- Figure 17: North America US Oil and Gas Downstream Refining Industry Revenue Share (%), by Country 2024 & 2032
- Figure 18: North America US Oil and Gas Downstream Refining Industry Volume Share (%), by Country 2024 & 2032
- Figure 19: South America US Oil and Gas Downstream Refining Industry Revenue (Million), by Refining 2024 & 2032
- Figure 20: South America US Oil and Gas Downstream Refining Industry Volume (N), by Refining 2024 & 2032
- Figure 21: South America US Oil and Gas Downstream Refining Industry Revenue Share (%), by Refining 2024 & 2032
- Figure 22: South America US Oil and Gas Downstream Refining Industry Volume Share (%), by Refining 2024 & 2032
- Figure 23: South America US Oil and Gas Downstream Refining Industry Revenue (Million), by Petrochemical 2024 & 2032
- Figure 24: South America US Oil and Gas Downstream Refining Industry Volume (N), by Petrochemical 2024 & 2032
- Figure 25: South America US Oil and Gas Downstream Refining Industry Revenue Share (%), by Petrochemical 2024 & 2032
- Figure 26: South America US Oil and Gas Downstream Refining Industry Volume Share (%), by Petrochemical 2024 & 2032
- Figure 27: South America US Oil and Gas Downstream Refining Industry Revenue (Million), by Country 2024 & 2032
- Figure 28: South America US Oil and Gas Downstream Refining Industry Volume (N), by Country 2024 & 2032
- Figure 29: South America US Oil and Gas Downstream Refining Industry Revenue Share (%), by Country 2024 & 2032
- Figure 30: South America US Oil and Gas Downstream Refining Industry Volume Share (%), by Country 2024 & 2032
- Figure 31: Europe US Oil and Gas Downstream Refining Industry Revenue (Million), by Refining 2024 & 2032
- Figure 32: Europe US Oil and Gas Downstream Refining Industry Volume (N), by Refining 2024 & 2032
- Figure 33: Europe US Oil and Gas Downstream Refining Industry Revenue Share (%), by Refining 2024 & 2032
- Figure 34: Europe US Oil and Gas Downstream Refining Industry Volume Share (%), by Refining 2024 & 2032
- Figure 35: Europe US Oil and Gas Downstream Refining Industry Revenue (Million), by Petrochemical 2024 & 2032
- Figure 36: Europe US Oil and Gas Downstream Refining Industry Volume (N), by Petrochemical 2024 & 2032
- Figure 37: Europe US Oil and Gas Downstream Refining Industry Revenue Share (%), by Petrochemical 2024 & 2032
- Figure 38: Europe US Oil and Gas Downstream Refining Industry Volume Share (%), by Petrochemical 2024 & 2032
- Figure 39: Europe US Oil and Gas Downstream Refining Industry Revenue (Million), by Country 2024 & 2032
- Figure 40: Europe US Oil and Gas Downstream Refining Industry Volume (N), by Country 2024 & 2032
- Figure 41: Europe US Oil and Gas Downstream Refining Industry Revenue Share (%), by Country 2024 & 2032
- Figure 42: Europe US Oil and Gas Downstream Refining Industry Volume Share (%), by Country 2024 & 2032
- Figure 43: Middle East & Africa US Oil and Gas Downstream Refining Industry Revenue (Million), by Refining 2024 & 2032
- Figure 44: Middle East & Africa US Oil and Gas Downstream Refining Industry Volume (N), by Refining 2024 & 2032
- Figure 45: Middle East & Africa US Oil and Gas Downstream Refining Industry Revenue Share (%), by Refining 2024 & 2032
- Figure 46: Middle East & Africa US Oil and Gas Downstream Refining Industry Volume Share (%), by Refining 2024 & 2032
- Figure 47: Middle East & Africa US Oil and Gas Downstream Refining Industry Revenue (Million), by Petrochemical 2024 & 2032
- Figure 48: Middle East & Africa US Oil and Gas Downstream Refining Industry Volume (N), by Petrochemical 2024 & 2032
- Figure 49: Middle East & Africa US Oil and Gas Downstream Refining Industry Revenue Share (%), by Petrochemical 2024 & 2032
- Figure 50: Middle East & Africa US Oil and Gas Downstream Refining Industry Volume Share (%), by Petrochemical 2024 & 2032
- Figure 51: Middle East & Africa US Oil and Gas Downstream Refining Industry Revenue (Million), by Country 2024 & 2032
- Figure 52: Middle East & Africa US Oil and Gas Downstream Refining Industry Volume (N), by Country 2024 & 2032
- Figure 53: Middle East & Africa US Oil and Gas Downstream Refining Industry Revenue Share (%), by Country 2024 & 2032
- Figure 54: Middle East & Africa US Oil and Gas Downstream Refining Industry Volume Share (%), by Country 2024 & 2032
- Figure 55: Asia Pacific US Oil and Gas Downstream Refining Industry Revenue (Million), by Refining 2024 & 2032
- Figure 56: Asia Pacific US Oil and Gas Downstream Refining Industry Volume (N), by Refining 2024 & 2032
- Figure 57: Asia Pacific US Oil and Gas Downstream Refining Industry Revenue Share (%), by Refining 2024 & 2032
- Figure 58: Asia Pacific US Oil and Gas Downstream Refining Industry Volume Share (%), by Refining 2024 & 2032
- Figure 59: Asia Pacific US Oil and Gas Downstream Refining Industry Revenue (Million), by Petrochemical 2024 & 2032
- Figure 60: Asia Pacific US Oil and Gas Downstream Refining Industry Volume (N), by Petrochemical 2024 & 2032
- Figure 61: Asia Pacific US Oil and Gas Downstream Refining Industry Revenue Share (%), by Petrochemical 2024 & 2032
- Figure 62: Asia Pacific US Oil and Gas Downstream Refining Industry Volume Share (%), by Petrochemical 2024 & 2032
- Figure 63: Asia Pacific US Oil and Gas Downstream Refining Industry Revenue (Million), by Country 2024 & 2032
- Figure 64: Asia Pacific US Oil and Gas Downstream Refining Industry Volume (N), by Country 2024 & 2032
- Figure 65: Asia Pacific US Oil and Gas Downstream Refining Industry Revenue Share (%), by Country 2024 & 2032
- Figure 66: Asia Pacific US Oil and Gas Downstream Refining Industry Volume Share (%), by Country 2024 & 2032
List of Tables
- Table 1: Global US Oil and Gas Downstream Refining Industry Revenue Million Forecast, by Region 2019 & 2032
- Table 2: Global US Oil and Gas Downstream Refining Industry Volume N Forecast, by Region 2019 & 2032
- Table 3: Global US Oil and Gas Downstream Refining Industry Revenue Million Forecast, by Refining 2019 & 2032
- Table 4: Global US Oil and Gas Downstream Refining Industry Volume N Forecast, by Refining 2019 & 2032
- Table 5: Global US Oil and Gas Downstream Refining Industry Revenue Million Forecast, by Petrochemical 2019 & 2032
- Table 6: Global US Oil and Gas Downstream Refining Industry Volume N Forecast, by Petrochemical 2019 & 2032
- Table 7: Global US Oil and Gas Downstream Refining Industry Revenue Million Forecast, by Region 2019 & 2032
- Table 8: Global US Oil and Gas Downstream Refining Industry Volume N Forecast, by Region 2019 & 2032
- Table 9: Global US Oil and Gas Downstream Refining Industry Revenue Million Forecast, by Country 2019 & 2032
- Table 10: Global US Oil and Gas Downstream Refining Industry Volume N Forecast, by Country 2019 & 2032
- Table 11: Northeast US Oil and Gas Downstream Refining Industry Revenue (Million) Forecast, by Application 2019 & 2032
- Table 12: Northeast US Oil and Gas Downstream Refining Industry Volume (N) Forecast, by Application 2019 & 2032
- Table 13: Southeast US Oil and Gas Downstream Refining Industry Revenue (Million) Forecast, by Application 2019 & 2032
- Table 14: Southeast US Oil and Gas Downstream Refining Industry Volume (N) Forecast, by Application 2019 & 2032
- Table 15: Midwest US Oil and Gas Downstream Refining Industry Revenue (Million) Forecast, by Application 2019 & 2032
- Table 16: Midwest US Oil and Gas Downstream Refining Industry Volume (N) Forecast, by Application 2019 & 2032
- Table 17: Southwest US Oil and Gas Downstream Refining Industry Revenue (Million) Forecast, by Application 2019 & 2032
- Table 18: Southwest US Oil and Gas Downstream Refining Industry Volume (N) Forecast, by Application 2019 & 2032
- Table 19: West US Oil and Gas Downstream Refining Industry Revenue (Million) Forecast, by Application 2019 & 2032
- Table 20: West US Oil and Gas Downstream Refining Industry Volume (N) Forecast, by Application 2019 & 2032
- Table 21: Global US Oil and Gas Downstream Refining Industry Revenue Million Forecast, by Refining 2019 & 2032
- Table 22: Global US Oil and Gas Downstream Refining Industry Volume N Forecast, by Refining 2019 & 2032
- Table 23: Global US Oil and Gas Downstream Refining Industry Revenue Million Forecast, by Petrochemical 2019 & 2032
- Table 24: Global US Oil and Gas Downstream Refining Industry Volume N Forecast, by Petrochemical 2019 & 2032
- Table 25: Global US Oil and Gas Downstream Refining Industry Revenue Million Forecast, by Country 2019 & 2032
- Table 26: Global US Oil and Gas Downstream Refining Industry Volume N Forecast, by Country 2019 & 2032
- Table 27: United States US Oil and Gas Downstream Refining Industry Revenue (Million) Forecast, by Application 2019 & 2032
- Table 28: United States US Oil and Gas Downstream Refining Industry Volume (N) Forecast, by Application 2019 & 2032
- Table 29: Canada US Oil and Gas Downstream Refining Industry Revenue (Million) Forecast, by Application 2019 & 2032
- Table 30: Canada US Oil and Gas Downstream Refining Industry Volume (N) Forecast, by Application 2019 & 2032
- Table 31: Mexico US Oil and Gas Downstream Refining Industry Revenue (Million) Forecast, by Application 2019 & 2032
- Table 32: Mexico US Oil and Gas Downstream Refining Industry Volume (N) Forecast, by Application 2019 & 2032
- Table 33: Global US Oil and Gas Downstream Refining Industry Revenue Million Forecast, by Refining 2019 & 2032
- Table 34: Global US Oil and Gas Downstream Refining Industry Volume N Forecast, by Refining 2019 & 2032
- Table 35: Global US Oil and Gas Downstream Refining Industry Revenue Million Forecast, by Petrochemical 2019 & 2032
- Table 36: Global US Oil and Gas Downstream Refining Industry Volume N Forecast, by Petrochemical 2019 & 2032
- Table 37: Global US Oil and Gas Downstream Refining Industry Revenue Million Forecast, by Country 2019 & 2032
- Table 38: Global US Oil and Gas Downstream Refining Industry Volume N Forecast, by Country 2019 & 2032
- Table 39: Brazil US Oil and Gas Downstream Refining Industry Revenue (Million) Forecast, by Application 2019 & 2032
- Table 40: Brazil US Oil and Gas Downstream Refining Industry Volume (N) Forecast, by Application 2019 & 2032
- Table 41: Argentina US Oil and Gas Downstream Refining Industry Revenue (Million) Forecast, by Application 2019 & 2032
- Table 42: Argentina US Oil and Gas Downstream Refining Industry Volume (N) Forecast, by Application 2019 & 2032
- Table 43: Rest of South America US Oil and Gas Downstream Refining Industry Revenue (Million) Forecast, by Application 2019 & 2032
- Table 44: Rest of South America US Oil and Gas Downstream Refining Industry Volume (N) Forecast, by Application 2019 & 2032
- Table 45: Global US Oil and Gas Downstream Refining Industry Revenue Million Forecast, by Refining 2019 & 2032
- Table 46: Global US Oil and Gas Downstream Refining Industry Volume N Forecast, by Refining 2019 & 2032
- Table 47: Global US Oil and Gas Downstream Refining Industry Revenue Million Forecast, by Petrochemical 2019 & 2032
- Table 48: Global US Oil and Gas Downstream Refining Industry Volume N Forecast, by Petrochemical 2019 & 2032
- Table 49: Global US Oil and Gas Downstream Refining Industry Revenue Million Forecast, by Country 2019 & 2032
- Table 50: Global US Oil and Gas Downstream Refining Industry Volume N Forecast, by Country 2019 & 2032
- Table 51: United Kingdom US Oil and Gas Downstream Refining Industry Revenue (Million) Forecast, by Application 2019 & 2032
- Table 52: United Kingdom US Oil and Gas Downstream Refining Industry Volume (N) Forecast, by Application 2019 & 2032
- Table 53: Germany US Oil and Gas Downstream Refining Industry Revenue (Million) Forecast, by Application 2019 & 2032
- Table 54: Germany US Oil and Gas Downstream Refining Industry Volume (N) Forecast, by Application 2019 & 2032
- Table 55: France US Oil and Gas Downstream Refining Industry Revenue (Million) Forecast, by Application 2019 & 2032
- Table 56: France US Oil and Gas Downstream Refining Industry Volume (N) Forecast, by Application 2019 & 2032
- Table 57: Italy US Oil and Gas Downstream Refining Industry Revenue (Million) Forecast, by Application 2019 & 2032
- Table 58: Italy US Oil and Gas Downstream Refining Industry Volume (N) Forecast, by Application 2019 & 2032
- Table 59: Spain US Oil and Gas Downstream Refining Industry Revenue (Million) Forecast, by Application 2019 & 2032
- Table 60: Spain US Oil and Gas Downstream Refining Industry Volume (N) Forecast, by Application 2019 & 2032
- Table 61: Russia US Oil and Gas Downstream Refining Industry Revenue (Million) Forecast, by Application 2019 & 2032
- Table 62: Russia US Oil and Gas Downstream Refining Industry Volume (N) Forecast, by Application 2019 & 2032
- Table 63: Benelux US Oil and Gas Downstream Refining Industry Revenue (Million) Forecast, by Application 2019 & 2032
- Table 64: Benelux US Oil and Gas Downstream Refining Industry Volume (N) Forecast, by Application 2019 & 2032
- Table 65: Nordics US Oil and Gas Downstream Refining Industry Revenue (Million) Forecast, by Application 2019 & 2032
- Table 66: Nordics US Oil and Gas Downstream Refining Industry Volume (N) Forecast, by Application 2019 & 2032
- Table 67: Rest of Europe US Oil and Gas Downstream Refining Industry Revenue (Million) Forecast, by Application 2019 & 2032
- Table 68: Rest of Europe US Oil and Gas Downstream Refining Industry Volume (N) Forecast, by Application 2019 & 2032
- Table 69: Global US Oil and Gas Downstream Refining Industry Revenue Million Forecast, by Refining 2019 & 2032
- Table 70: Global US Oil and Gas Downstream Refining Industry Volume N Forecast, by Refining 2019 & 2032
- Table 71: Global US Oil and Gas Downstream Refining Industry Revenue Million Forecast, by Petrochemical 2019 & 2032
- Table 72: Global US Oil and Gas Downstream Refining Industry Volume N Forecast, by Petrochemical 2019 & 2032
- Table 73: Global US Oil and Gas Downstream Refining Industry Revenue Million Forecast, by Country 2019 & 2032
- Table 74: Global US Oil and Gas Downstream Refining Industry Volume N Forecast, by Country 2019 & 2032
- Table 75: Turkey US Oil and Gas Downstream Refining Industry Revenue (Million) Forecast, by Application 2019 & 2032
- Table 76: Turkey US Oil and Gas Downstream Refining Industry Volume (N) Forecast, by Application 2019 & 2032
- Table 77: Israel US Oil and Gas Downstream Refining Industry Revenue (Million) Forecast, by Application 2019 & 2032
- Table 78: Israel US Oil and Gas Downstream Refining Industry Volume (N) Forecast, by Application 2019 & 2032
- Table 79: GCC US Oil and Gas Downstream Refining Industry Revenue (Million) Forecast, by Application 2019 & 2032
- Table 80: GCC US Oil and Gas Downstream Refining Industry Volume (N) Forecast, by Application 2019 & 2032
- Table 81: North Africa US Oil and Gas Downstream Refining Industry Revenue (Million) Forecast, by Application 2019 & 2032
- Table 82: North Africa US Oil and Gas Downstream Refining Industry Volume (N) Forecast, by Application 2019 & 2032
- Table 83: South Africa US Oil and Gas Downstream Refining Industry Revenue (Million) Forecast, by Application 2019 & 2032
- Table 84: South Africa US Oil and Gas Downstream Refining Industry Volume (N) Forecast, by Application 2019 & 2032
- Table 85: Rest of Middle East & Africa US Oil and Gas Downstream Refining Industry Revenue (Million) Forecast, by Application 2019 & 2032
- Table 86: Rest of Middle East & Africa US Oil and Gas Downstream Refining Industry Volume (N) Forecast, by Application 2019 & 2032
- Table 87: Global US Oil and Gas Downstream Refining Industry Revenue Million Forecast, by Refining 2019 & 2032
- Table 88: Global US Oil and Gas Downstream Refining Industry Volume N Forecast, by Refining 2019 & 2032
- Table 89: Global US Oil and Gas Downstream Refining Industry Revenue Million Forecast, by Petrochemical 2019 & 2032
- Table 90: Global US Oil and Gas Downstream Refining Industry Volume N Forecast, by Petrochemical 2019 & 2032
- Table 91: Global US Oil and Gas Downstream Refining Industry Revenue Million Forecast, by Country 2019 & 2032
- Table 92: Global US Oil and Gas Downstream Refining Industry Volume N Forecast, by Country 2019 & 2032
- Table 93: China US Oil and Gas Downstream Refining Industry Revenue (Million) Forecast, by Application 2019 & 2032
- Table 94: China US Oil and Gas Downstream Refining Industry Volume (N) Forecast, by Application 2019 & 2032
- Table 95: India US Oil and Gas Downstream Refining Industry Revenue (Million) Forecast, by Application 2019 & 2032
- Table 96: India US Oil and Gas Downstream Refining Industry Volume (N) Forecast, by Application 2019 & 2032
- Table 97: Japan US Oil and Gas Downstream Refining Industry Revenue (Million) Forecast, by Application 2019 & 2032
- Table 98: Japan US Oil and Gas Downstream Refining Industry Volume (N) Forecast, by Application 2019 & 2032
- Table 99: South Korea US Oil and Gas Downstream Refining Industry Revenue (Million) Forecast, by Application 2019 & 2032
- Table 100: South Korea US Oil and Gas Downstream Refining Industry Volume (N) Forecast, by Application 2019 & 2032
- Table 101: ASEAN US Oil and Gas Downstream Refining Industry Revenue (Million) Forecast, by Application 2019 & 2032
- Table 102: ASEAN US Oil and Gas Downstream Refining Industry Volume (N) Forecast, by Application 2019 & 2032
- Table 103: Oceania US Oil and Gas Downstream Refining Industry Revenue (Million) Forecast, by Application 2019 & 2032
- Table 104: Oceania US Oil and Gas Downstream Refining Industry Volume (N) Forecast, by Application 2019 & 2032
- Table 105: Rest of Asia Pacific US Oil and Gas Downstream Refining Industry Revenue (Million) Forecast, by Application 2019 & 2032
- Table 106: Rest of Asia Pacific US Oil and Gas Downstream Refining Industry Volume (N) Forecast, by Application 2019 & 2032
Frequently Asked Questions
1. What is the projected Compound Annual Growth Rate (CAGR) of the US Oil and Gas Downstream Refining Industry?
The projected CAGR is approximately > 0.92%.
2. Which companies are prominent players in the US Oil and Gas Downstream Refining Industry?
Key companies in the market include U S Oil & Refining Co, Valero Energy Corporation, Marathon Petroleum Corp, Exxon Mobil Corporation, Hunt Refining Company, Royal Dutch Shell PLC, Phillips.
3. What are the main segments of the US Oil and Gas Downstream Refining Industry?
The market segments include Refining, Petrochemical.
4. Can you provide details about the market size?
The market size is estimated to be USD XX Million as of 2022.
5. What are some drivers contributing to market growth?
Increasing Demand from Various End-user Industries.
6. What are the notable trends driving market growth?
Refining Sector to Register a Modest Growth.
7. Are there any restraints impacting market growth?
Higher Capital and Operational Cost.
8. Can you provide examples of recent developments in the market?
Nov 2022: Chevron U.S.A. Inc., a subsidiary of Chevron Corporation, announced it had signed an agreement to acquire full ownership of Beyond6 LLC (B6) and its network of 55 compressed natural gas (CNG) stations across the United States from Chevron's current B6 co-owners, a subsidiary of Mercuria Energy Trading and B6 CEO Andrew West.
9. What pricing options are available for accessing the report?
Pricing options include single-user, multi-user, and enterprise licenses priced at USD 3800, USD 4500, and USD 5800 respectively.
10. Is the market size provided in terms of value or volume?
The market size is provided in terms of value, measured in Million and volume, measured in N.
11. Are there any specific market keywords associated with the report?
Yes, the market keyword associated with the report is "US Oil and Gas Downstream Refining Industry," which aids in identifying and referencing the specific market segment covered.
12. How do I determine which pricing option suits my needs best?
The pricing options vary based on user requirements and access needs. Individual users may opt for single-user licenses, while businesses requiring broader access may choose multi-user or enterprise licenses for cost-effective access to the report.
13. Are there any additional resources or data provided in the US Oil and Gas Downstream Refining Industry report?
While the report offers comprehensive insights, it's advisable to review the specific contents or supplementary materials provided to ascertain if additional resources or data are available.
14. How can I stay updated on further developments or reports in the US Oil and Gas Downstream Refining Industry?
To stay informed about further developments, trends, and reports in the US Oil and Gas Downstream Refining Industry, consider subscribing to industry newsletters, following relevant companies and organizations, or regularly checking reputable industry news sources and publications.
Methodology
Step 1 - Identification of Relevant Samples Size from Population Database


Step 2 - Approaches for Defining Global Market Size (Value, Volume* & Price*)

Note*: In applicable scenarios
Step 3 - Data Sources
Primary Research
- Web Analytics
- Survey Reports
- Research Institute
- Latest Research Reports
- Opinion Leaders
Secondary Research
- Annual Reports
- White Paper
- Latest Press Release
- Industry Association
- Paid Database
- Investor Presentations

Step 4 - Data Triangulation
Involves using different sources of information in order to increase the validity of a study
These sources are likely to be stakeholders in a program - participants, other researchers, program staff, other community members, and so on.
Then we put all data in single framework & apply various statistical tools to find out the dynamic on the market.
During the analysis stage, feedback from the stakeholder groups would be compared to determine areas of agreement as well as areas of divergence
