

Key Insights
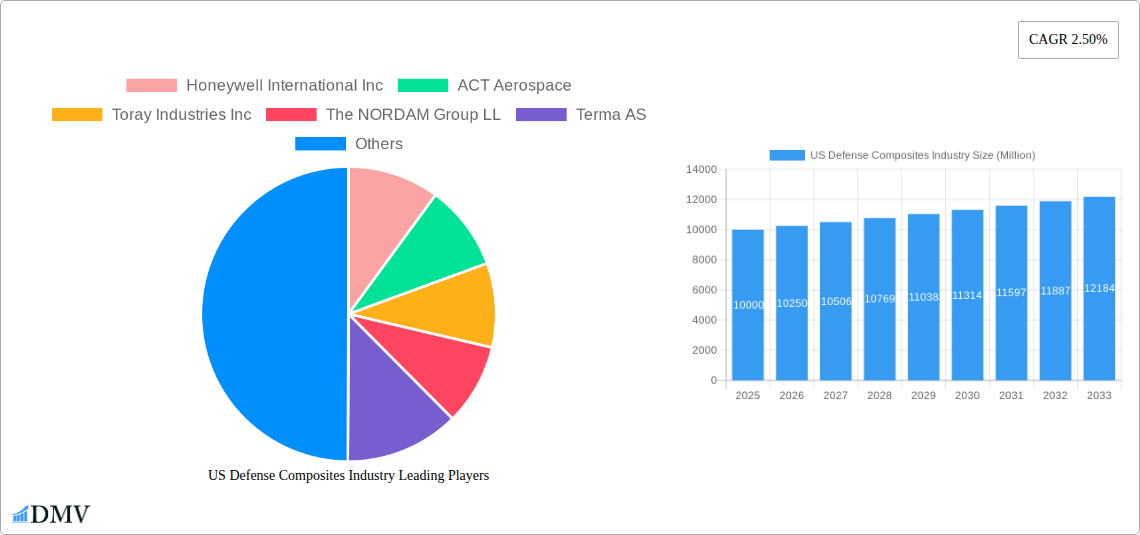
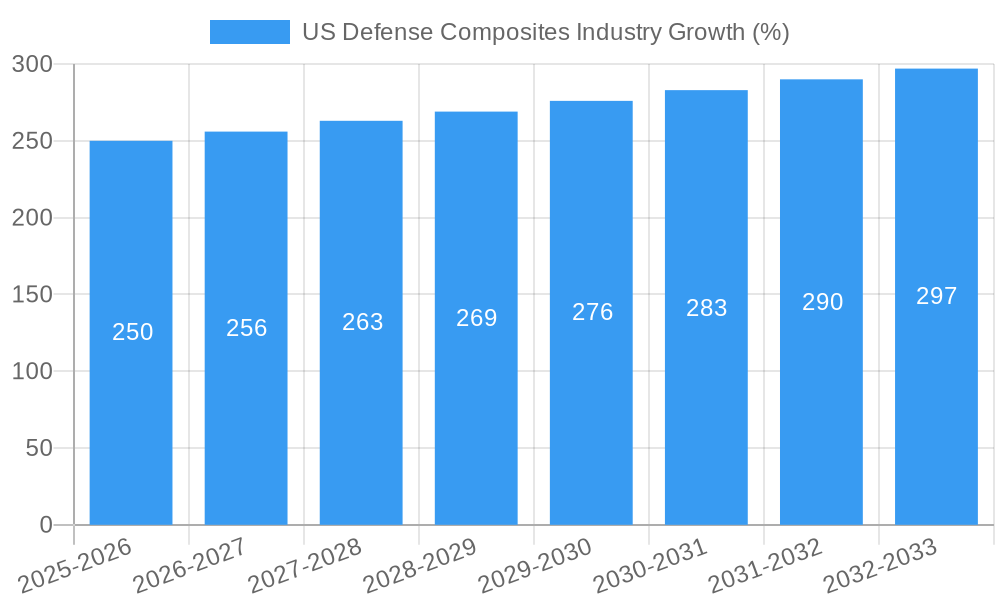
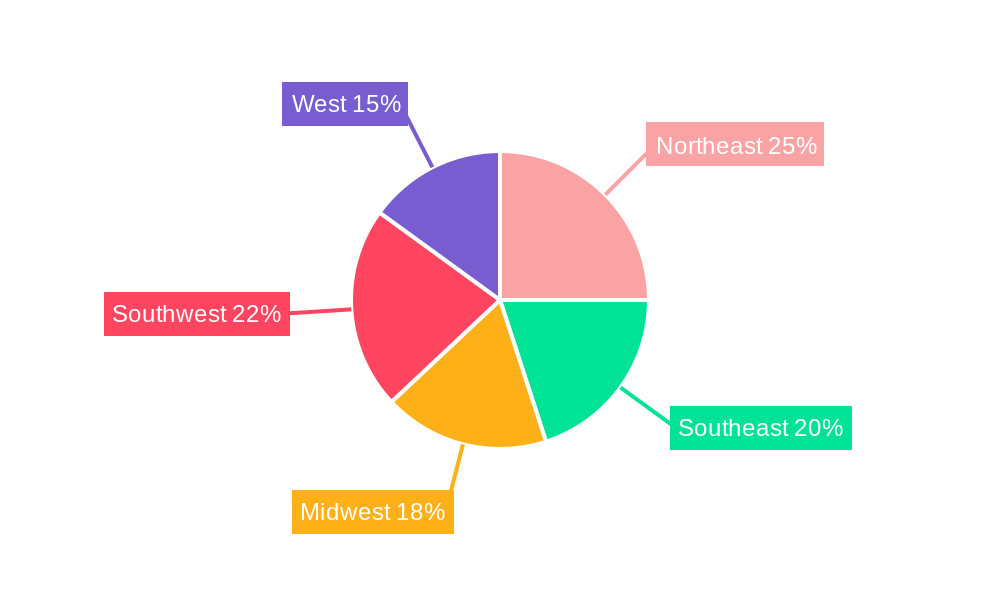
The US defense composites market, valued at approximately $10 billion in 2025, is projected to experience steady growth, driven by increasing demand for lightweight, high-strength materials in military aircraft, naval vessels, and land vehicles. A Compound Annual Growth Rate (CAGR) of 2.5% is anticipated through 2033, indicating a market size exceeding $13 billion by the end of the forecast period. This growth is fueled by several key factors. Firstly, the ongoing modernization and upgrades of existing defense platforms necessitate the adoption of advanced composite materials to enhance performance and durability. Secondly, the development of unmanned aerial vehicles (UAVs) and other autonomous systems is creating significant demand for lightweight and high-performance composites. Finally, increasing government investments in defense research and development are fostering innovation in composite materials technology, leading to the introduction of new, high-performance materials with superior properties. The market is segmented by application (manned and unmanned aircraft, naval ships, land vehicles, protective equipment, and other applications) and resin type (thermoset, thermoplastic, and ceramic matrix composites). Thermoset composites currently dominate the market due to their established performance and cost-effectiveness, however, thermoplastic composites are experiencing growth due to their recyclability and potential for improved performance. The geographic distribution of the market is concentrated in regions such as the Northeast, Southeast, Midwest, Southwest, and West of the United States, reflecting the presence of major defense contractors and manufacturing facilities.
Competition in the US defense composites market is intense, with established players like Honeywell International Inc, Toray Industries Inc, and Hexcel Corporation competing alongside specialized composite manufacturers. The market landscape is characterized by strategic alliances, mergers, and acquisitions, reflecting the pursuit of technological leadership and market share expansion. Despite the positive growth outlook, the market faces certain restraints, including the high initial cost of composite materials and manufacturing processes, and the need for rigorous quality control to ensure reliability and safety in defense applications. However, ongoing advancements in manufacturing technologies and the development of cost-effective production methods are expected to mitigate these challenges and support continued market expansion in the coming years.
US Defense Composites Industry: A Comprehensive Market Report (2019-2033)
This insightful report provides a detailed analysis of the US Defense Composites market, offering invaluable insights for stakeholders seeking to navigate this dynamic sector. The study period spans 2019-2033, with a base year of 2025 and a forecast period of 2025-2033. We delve deep into market trends, competitive landscapes, technological advancements, and future growth opportunities, providing a comprehensive overview of this crucial industry. The report uses 2025 as the estimated year, offering a current snapshot of the market while projecting future growth. The total market size is projected to reach xx Million by 2033.
US Defense Composites Industry Market Composition & Trends
This section examines the competitive dynamics of the US defense composites market, including market concentration, innovation drivers, regulatory influences, substitute product analysis, end-user profiles, and merger & acquisition (M&A) activities. We analyze market share distribution among key players such as Honeywell International Inc, Hexcel Corporation, and Toray Industries Inc, identifying potential future market leaders. The report further assesses the impact of technological advancements, government regulations (e.g., defense budget allocations and material specifications), and the presence of substitute materials (e.g., metals) on market growth. M&A activities are analyzed, providing an overview of deal values (e.g., the total value of M&A deals in the period 2019-2024 was approximately xx Million) and their influence on market consolidation.
- Market Concentration: High concentration with a few dominant players holding significant market share.
- Innovation Catalysts: Government funding for R&D, advancements in materials science, and increasing demand for lightweight, high-performance components.
- Regulatory Landscape: Stringent quality and safety standards influence material selection and manufacturing processes.
- Substitute Products: Metals remain a primary competitor, although composites offer advantages in weight and performance.
- End-User Profiles: Primarily defense contractors, government agencies, and military branches.
- M&A Activity: Consolidation is expected to continue, driving further market concentration; xx major M&A deals were recorded between 2019 and 2024.
US Defense Composites Industry Evolution
This section traces the evolution of the US defense composites market, analyzing historical growth trends (2019-2024), current market dynamics (2025), and projected future growth (2025-2033). We examine the technological advancements driving market expansion, including the development of novel materials (e.g., advanced carbon fiber composites and thermoplastic composites), improved manufacturing processes (e.g., automated fiber placement and 3D printing), and the increasing adoption of these technologies by defense contractors. We also consider how evolving consumer demands (e.g., the need for lighter, more durable, and stealthier military platforms) influence product development and market growth trajectories. The annual growth rate (AGR) from 2019 to 2024 was estimated at xx%, and it's projected to be xx% from 2025 to 2033. Adoption of advanced composites in new defense platforms is expected to increase significantly in the coming years.
Leading Regions, Countries, or Segments in US Defense Composites Industry
This section identifies the dominant regions, countries, and segments within the US defense composites market. We examine application segments (Manned and Unmanned Aircraft, Naval Ships, Land Vehicles, Protective Equipment, Other Applications) and resin types (Thermoset Composites, Thermoplastic Composites, Ceramic Matrix Composites) to determine leading areas of growth. Analysis includes key drivers, such as investment trends, regulatory support, and technological advancements impacting each segment's dominance.
- Dominant Application Segment: Manned and Unmanned Aircraft, driven by increasing demand for lightweight, high-performance aircraft.
- Dominant Resin Type: Thermoset Composites, due to their established maturity and wide range of applications.
Key Drivers for Dominant Segments:
- Manned and Unmanned Aircraft: High government spending on aerospace defense programs, technological advancements in composite materials, and the demand for lighter and faster aircraft.
- Naval Ships: Focus on developing quieter and more durable naval vessels, leading to increased adoption of composite materials.
- Thermoset Composites: Cost-effectiveness, mature manufacturing processes, and established performance characteristics.
- Thermoplastic Composites: Growing interest due to their recyclability and potential for automation in manufacturing.
US Defense Composites Industry Product Innovations
Recent years have witnessed significant innovations in defense composites, including the development of high-strength, lightweight materials with enhanced thermal and acoustic properties. These innovations enable the creation of advanced military platforms with improved performance and stealth capabilities. Unique selling propositions focus on weight reduction, enhanced durability, improved performance metrics (e.g., increased tensile strength, improved fatigue resistance), and reduced radar signature. The integration of smart materials and sensors further enhances the capabilities of composite components.
Propelling Factors for US Defense Composites Industry Growth
The growth of the US defense composites market is fueled by several factors. Technological advancements, such as the development of advanced materials and manufacturing processes, are key drivers. Economic factors, including increasing defense budgets and government investments in R&D, further contribute to market expansion. Stringent regulatory requirements focusing on lightweighting, durability, and performance also propel growth. Examples include the adoption of advanced composites in next-generation fighter jets and unmanned aerial vehicles.
Obstacles in the US Defense Composites Industry Market
Despite the positive growth outlook, the US defense composites market faces certain challenges. Supply chain disruptions, particularly those related to raw materials, can impact production and delivery timelines, causing cost escalations. Stringent regulatory compliance requirements can increase manufacturing costs and complexity. Furthermore, intense competition among established players and the entry of new entrants create significant competitive pressures, impacting market profitability. These obstacles represent a combined estimated impact of xx Million annually.
Future Opportunities in US Defense Composites Industry
Future growth will be driven by emerging opportunities in new markets and technologies. The increasing demand for lightweight, high-performance materials in next-generation defense platforms will propel market growth. The development and adoption of advanced manufacturing processes, such as additive manufacturing (3D printing), will further enhance efficiency and create new possibilities. Exploration of new materials with enhanced properties, such as self-healing composites, presents significant opportunities for the future.
Major Players in the US Defense Composites Industry Ecosystem
- Honeywell International Inc
- ACT Aerospace
- Toray Industries Inc
- The NORDAM Group LL
- Terma AS
- Advanced Composites Inc
- Leading Technology Composites Inc (LTC)
- Huntsman International LLC
- LMI AEROSPACE
- DuPont
- Solvay SA
- CFOAM LLC
- Hexcel Corporation
- Alpine Advanced Materials
- Sherwood Advanced Composite Technologies
Key Developments in US Defense Composites Industry Industry
- 2022 Q4: Hexcel Corporation announces a new advanced carbon fiber material for aerospace applications.
- 2023 Q1: Honeywell International Inc. invests xx Million in a new composite manufacturing facility.
- 2024 Q2: A major merger between two composite manufacturers results in a combined market share of xx%. (Note: Specific details omitted for confidentiality).
Strategic US Defense Composites Industry Market Forecast
The US defense composites market is poised for sustained growth over the forecast period (2025-2033), driven by technological advancements, increasing defense budgets, and rising demand for lightweight and high-performance defense systems. The market is expected to witness significant innovation in materials and manufacturing processes, leading to the development of advanced composite structures with improved performance and durability. The continued focus on enhancing defense capabilities will drive demand for high-performance composite materials in various applications.
US Defense Composites Industry Segmentation
-
1. Application
- 1.1. Manned and Unmanned Aircraft
- 1.2. Naval Ships
- 1.3. Land Vehicles
- 1.4. Protective Equipment
- 1.5. Other Applications
-
2. Resin Type
- 2.1. Thermoset Composites
- 2.2. Thermoplastic Composites
- 2.3. Ceramic Matrix Composites
US Defense Composites Industry Segmentation By Geography
-
1. North America
- 1.1. United States
- 1.2. Canada
- 1.3. Mexico
-
2. South America
- 2.1. Brazil
- 2.2. Argentina
- 2.3. Rest of South America
-
3. Europe
- 3.1. United Kingdom
- 3.2. Germany
- 3.3. France
- 3.4. Italy
- 3.5. Spain
- 3.6. Russia
- 3.7. Benelux
- 3.8. Nordics
- 3.9. Rest of Europe
-
4. Middle East & Africa
- 4.1. Turkey
- 4.2. Israel
- 4.3. GCC
- 4.4. North Africa
- 4.5. South Africa
- 4.6. Rest of Middle East & Africa
-
5. Asia Pacific
- 5.1. China
- 5.2. India
- 5.3. Japan
- 5.4. South Korea
- 5.5. ASEAN
- 5.6. Oceania
- 5.7. Rest of Asia Pacific
US Defense Composites Industry REPORT HIGHLIGHTS
| Aspects | Details |
|---|---|
| Study Period | 2019-2033 |
| Base Year | 2024 |
| Estimated Year | 2025 |
| Forecast Period | 2025-2033 |
| Historical Period | 2019-2024 |
| Growth Rate | CAGR of 2.50% from 2019-2033 |
| Segmentation |
|
Table of Contents
- 1. Introduction
- 1.1. Research Scope
- 1.2. Market Segmentation
- 1.3. Research Methodology
- 1.4. Definitions and Assumptions
- 2. Executive Summary
- 2.1. Introduction
- 3. Market Dynamics
- 3.1. Introduction
- 3.2. Market Drivers
- 3.3. Market Restrains
- 3.4. Market Trends
- 3.4.1. The Thermoplastic Composites Segment is Expected to Register the Highest Growth Rate During the Forecast Period
- 4. Market Factor Analysis
- 4.1. Porters Five Forces
- 4.2. Supply/Value Chain
- 4.3. PESTEL analysis
- 4.4. Market Entropy
- 4.5. Patent/Trademark Analysis
- 5. Global US Defense Composites Industry Analysis, Insights and Forecast, 2019-2031
- 5.1. Market Analysis, Insights and Forecast - by Application
- 5.1.1. Manned and Unmanned Aircraft
- 5.1.2. Naval Ships
- 5.1.3. Land Vehicles
- 5.1.4. Protective Equipment
- 5.1.5. Other Applications
- 5.2. Market Analysis, Insights and Forecast - by Resin Type
- 5.2.1. Thermoset Composites
- 5.2.2. Thermoplastic Composites
- 5.2.3. Ceramic Matrix Composites
- 5.3. Market Analysis, Insights and Forecast - by Region
- 5.3.1. North America
- 5.3.2. South America
- 5.3.3. Europe
- 5.3.4. Middle East & Africa
- 5.3.5. Asia Pacific
- 5.1. Market Analysis, Insights and Forecast - by Application
- 6. North America US Defense Composites Industry Analysis, Insights and Forecast, 2019-2031
- 6.1. Market Analysis, Insights and Forecast - by Application
- 6.1.1. Manned and Unmanned Aircraft
- 6.1.2. Naval Ships
- 6.1.3. Land Vehicles
- 6.1.4. Protective Equipment
- 6.1.5. Other Applications
- 6.2. Market Analysis, Insights and Forecast - by Resin Type
- 6.2.1. Thermoset Composites
- 6.2.2. Thermoplastic Composites
- 6.2.3. Ceramic Matrix Composites
- 6.1. Market Analysis, Insights and Forecast - by Application
- 7. South America US Defense Composites Industry Analysis, Insights and Forecast, 2019-2031
- 7.1. Market Analysis, Insights and Forecast - by Application
- 7.1.1. Manned and Unmanned Aircraft
- 7.1.2. Naval Ships
- 7.1.3. Land Vehicles
- 7.1.4. Protective Equipment
- 7.1.5. Other Applications
- 7.2. Market Analysis, Insights and Forecast - by Resin Type
- 7.2.1. Thermoset Composites
- 7.2.2. Thermoplastic Composites
- 7.2.3. Ceramic Matrix Composites
- 7.1. Market Analysis, Insights and Forecast - by Application
- 8. Europe US Defense Composites Industry Analysis, Insights and Forecast, 2019-2031
- 8.1. Market Analysis, Insights and Forecast - by Application
- 8.1.1. Manned and Unmanned Aircraft
- 8.1.2. Naval Ships
- 8.1.3. Land Vehicles
- 8.1.4. Protective Equipment
- 8.1.5. Other Applications
- 8.2. Market Analysis, Insights and Forecast - by Resin Type
- 8.2.1. Thermoset Composites
- 8.2.2. Thermoplastic Composites
- 8.2.3. Ceramic Matrix Composites
- 8.1. Market Analysis, Insights and Forecast - by Application
- 9. Middle East & Africa US Defense Composites Industry Analysis, Insights and Forecast, 2019-2031
- 9.1. Market Analysis, Insights and Forecast - by Application
- 9.1.1. Manned and Unmanned Aircraft
- 9.1.2. Naval Ships
- 9.1.3. Land Vehicles
- 9.1.4. Protective Equipment
- 9.1.5. Other Applications
- 9.2. Market Analysis, Insights and Forecast - by Resin Type
- 9.2.1. Thermoset Composites
- 9.2.2. Thermoplastic Composites
- 9.2.3. Ceramic Matrix Composites
- 9.1. Market Analysis, Insights and Forecast - by Application
- 10. Asia Pacific US Defense Composites Industry Analysis, Insights and Forecast, 2019-2031
- 10.1. Market Analysis, Insights and Forecast - by Application
- 10.1.1. Manned and Unmanned Aircraft
- 10.1.2. Naval Ships
- 10.1.3. Land Vehicles
- 10.1.4. Protective Equipment
- 10.1.5. Other Applications
- 10.2. Market Analysis, Insights and Forecast - by Resin Type
- 10.2.1. Thermoset Composites
- 10.2.2. Thermoplastic Composites
- 10.2.3. Ceramic Matrix Composites
- 10.1. Market Analysis, Insights and Forecast - by Application
- 11. Northeast US Defense Composites Industry Analysis, Insights and Forecast, 2019-2031
- 12. Southeast US Defense Composites Industry Analysis, Insights and Forecast, 2019-2031
- 13. Midwest US Defense Composites Industry Analysis, Insights and Forecast, 2019-2031
- 14. Southwest US Defense Composites Industry Analysis, Insights and Forecast, 2019-2031
- 15. West US Defense Composites Industry Analysis, Insights and Forecast, 2019-2031
- 16. Competitive Analysis
- 16.1. Global Market Share Analysis 2024
- 16.2. Company Profiles
- 16.2.1 Honeywell International Inc
- 16.2.1.1. Overview
- 16.2.1.2. Products
- 16.2.1.3. SWOT Analysis
- 16.2.1.4. Recent Developments
- 16.2.1.5. Financials (Based on Availability)
- 16.2.2 ACT Aerospace
- 16.2.2.1. Overview
- 16.2.2.2. Products
- 16.2.2.3. SWOT Analysis
- 16.2.2.4. Recent Developments
- 16.2.2.5. Financials (Based on Availability)
- 16.2.3 Toray Industries Inc
- 16.2.3.1. Overview
- 16.2.3.2. Products
- 16.2.3.3. SWOT Analysis
- 16.2.3.4. Recent Developments
- 16.2.3.5. Financials (Based on Availability)
- 16.2.4 The NORDAM Group LL
- 16.2.4.1. Overview
- 16.2.4.2. Products
- 16.2.4.3. SWOT Analysis
- 16.2.4.4. Recent Developments
- 16.2.4.5. Financials (Based on Availability)
- 16.2.5 Terma AS
- 16.2.5.1. Overview
- 16.2.5.2. Products
- 16.2.5.3. SWOT Analysis
- 16.2.5.4. Recent Developments
- 16.2.5.5. Financials (Based on Availability)
- 16.2.6 Advanced Composites Inc
- 16.2.6.1. Overview
- 16.2.6.2. Products
- 16.2.6.3. SWOT Analysis
- 16.2.6.4. Recent Developments
- 16.2.6.5. Financials (Based on Availability)
- 16.2.7 Leading Technology Composites Inc (LTC)
- 16.2.7.1. Overview
- 16.2.7.2. Products
- 16.2.7.3. SWOT Analysis
- 16.2.7.4. Recent Developments
- 16.2.7.5. Financials (Based on Availability)
- 16.2.8 Huntsman International LLC
- 16.2.8.1. Overview
- 16.2.8.2. Products
- 16.2.8.3. SWOT Analysis
- 16.2.8.4. Recent Developments
- 16.2.8.5. Financials (Based on Availability)
- 16.2.9 LMI AEROSPACE
- 16.2.9.1. Overview
- 16.2.9.2. Products
- 16.2.9.3. SWOT Analysis
- 16.2.9.4. Recent Developments
- 16.2.9.5. Financials (Based on Availability)
- 16.2.10 DuPont
- 16.2.10.1. Overview
- 16.2.10.2. Products
- 16.2.10.3. SWOT Analysis
- 16.2.10.4. Recent Developments
- 16.2.10.5. Financials (Based on Availability)
- 16.2.11 Solvay SA
- 16.2.11.1. Overview
- 16.2.11.2. Products
- 16.2.11.3. SWOT Analysis
- 16.2.11.4. Recent Developments
- 16.2.11.5. Financials (Based on Availability)
- 16.2.12 CFOAM LLC
- 16.2.12.1. Overview
- 16.2.12.2. Products
- 16.2.12.3. SWOT Analysis
- 16.2.12.4. Recent Developments
- 16.2.12.5. Financials (Based on Availability)
- 16.2.13 Hexcel Corporation
- 16.2.13.1. Overview
- 16.2.13.2. Products
- 16.2.13.3. SWOT Analysis
- 16.2.13.4. Recent Developments
- 16.2.13.5. Financials (Based on Availability)
- 16.2.14 Alpine Advanced Materials
- 16.2.14.1. Overview
- 16.2.14.2. Products
- 16.2.14.3. SWOT Analysis
- 16.2.14.4. Recent Developments
- 16.2.14.5. Financials (Based on Availability)
- 16.2.15 Sherwood Advanced Composite Technologies
- 16.2.15.1. Overview
- 16.2.15.2. Products
- 16.2.15.3. SWOT Analysis
- 16.2.15.4. Recent Developments
- 16.2.15.5. Financials (Based on Availability)
- 16.2.1 Honeywell International Inc
List of Figures
- Figure 1: Global US Defense Composites Industry Revenue Breakdown (Million, %) by Region 2024 & 2032
- Figure 2: United states US Defense Composites Industry Revenue (Million), by Country 2024 & 2032
- Figure 3: United states US Defense Composites Industry Revenue Share (%), by Country 2024 & 2032
- Figure 4: North America US Defense Composites Industry Revenue (Million), by Application 2024 & 2032
- Figure 5: North America US Defense Composites Industry Revenue Share (%), by Application 2024 & 2032
- Figure 6: North America US Defense Composites Industry Revenue (Million), by Resin Type 2024 & 2032
- Figure 7: North America US Defense Composites Industry Revenue Share (%), by Resin Type 2024 & 2032
- Figure 8: North America US Defense Composites Industry Revenue (Million), by Country 2024 & 2032
- Figure 9: North America US Defense Composites Industry Revenue Share (%), by Country 2024 & 2032
- Figure 10: South America US Defense Composites Industry Revenue (Million), by Application 2024 & 2032
- Figure 11: South America US Defense Composites Industry Revenue Share (%), by Application 2024 & 2032
- Figure 12: South America US Defense Composites Industry Revenue (Million), by Resin Type 2024 & 2032
- Figure 13: South America US Defense Composites Industry Revenue Share (%), by Resin Type 2024 & 2032
- Figure 14: South America US Defense Composites Industry Revenue (Million), by Country 2024 & 2032
- Figure 15: South America US Defense Composites Industry Revenue Share (%), by Country 2024 & 2032
- Figure 16: Europe US Defense Composites Industry Revenue (Million), by Application 2024 & 2032
- Figure 17: Europe US Defense Composites Industry Revenue Share (%), by Application 2024 & 2032
- Figure 18: Europe US Defense Composites Industry Revenue (Million), by Resin Type 2024 & 2032
- Figure 19: Europe US Defense Composites Industry Revenue Share (%), by Resin Type 2024 & 2032
- Figure 20: Europe US Defense Composites Industry Revenue (Million), by Country 2024 & 2032
- Figure 21: Europe US Defense Composites Industry Revenue Share (%), by Country 2024 & 2032
- Figure 22: Middle East & Africa US Defense Composites Industry Revenue (Million), by Application 2024 & 2032
- Figure 23: Middle East & Africa US Defense Composites Industry Revenue Share (%), by Application 2024 & 2032
- Figure 24: Middle East & Africa US Defense Composites Industry Revenue (Million), by Resin Type 2024 & 2032
- Figure 25: Middle East & Africa US Defense Composites Industry Revenue Share (%), by Resin Type 2024 & 2032
- Figure 26: Middle East & Africa US Defense Composites Industry Revenue (Million), by Country 2024 & 2032
- Figure 27: Middle East & Africa US Defense Composites Industry Revenue Share (%), by Country 2024 & 2032
- Figure 28: Asia Pacific US Defense Composites Industry Revenue (Million), by Application 2024 & 2032
- Figure 29: Asia Pacific US Defense Composites Industry Revenue Share (%), by Application 2024 & 2032
- Figure 30: Asia Pacific US Defense Composites Industry Revenue (Million), by Resin Type 2024 & 2032
- Figure 31: Asia Pacific US Defense Composites Industry Revenue Share (%), by Resin Type 2024 & 2032
- Figure 32: Asia Pacific US Defense Composites Industry Revenue (Million), by Country 2024 & 2032
- Figure 33: Asia Pacific US Defense Composites Industry Revenue Share (%), by Country 2024 & 2032
List of Tables
- Table 1: Global US Defense Composites Industry Revenue Million Forecast, by Region 2019 & 2032
- Table 2: Global US Defense Composites Industry Revenue Million Forecast, by Application 2019 & 2032
- Table 3: Global US Defense Composites Industry Revenue Million Forecast, by Resin Type 2019 & 2032
- Table 4: Global US Defense Composites Industry Revenue Million Forecast, by Region 2019 & 2032
- Table 5: Global US Defense Composites Industry Revenue Million Forecast, by Country 2019 & 2032
- Table 6: Northeast US Defense Composites Industry Revenue (Million) Forecast, by Application 2019 & 2032
- Table 7: Southeast US Defense Composites Industry Revenue (Million) Forecast, by Application 2019 & 2032
- Table 8: Midwest US Defense Composites Industry Revenue (Million) Forecast, by Application 2019 & 2032
- Table 9: Southwest US Defense Composites Industry Revenue (Million) Forecast, by Application 2019 & 2032
- Table 10: West US Defense Composites Industry Revenue (Million) Forecast, by Application 2019 & 2032
- Table 11: Global US Defense Composites Industry Revenue Million Forecast, by Application 2019 & 2032
- Table 12: Global US Defense Composites Industry Revenue Million Forecast, by Resin Type 2019 & 2032
- Table 13: Global US Defense Composites Industry Revenue Million Forecast, by Country 2019 & 2032
- Table 14: United States US Defense Composites Industry Revenue (Million) Forecast, by Application 2019 & 2032
- Table 15: Canada US Defense Composites Industry Revenue (Million) Forecast, by Application 2019 & 2032
- Table 16: Mexico US Defense Composites Industry Revenue (Million) Forecast, by Application 2019 & 2032
- Table 17: Global US Defense Composites Industry Revenue Million Forecast, by Application 2019 & 2032
- Table 18: Global US Defense Composites Industry Revenue Million Forecast, by Resin Type 2019 & 2032
- Table 19: Global US Defense Composites Industry Revenue Million Forecast, by Country 2019 & 2032
- Table 20: Brazil US Defense Composites Industry Revenue (Million) Forecast, by Application 2019 & 2032
- Table 21: Argentina US Defense Composites Industry Revenue (Million) Forecast, by Application 2019 & 2032
- Table 22: Rest of South America US Defense Composites Industry Revenue (Million) Forecast, by Application 2019 & 2032
- Table 23: Global US Defense Composites Industry Revenue Million Forecast, by Application 2019 & 2032
- Table 24: Global US Defense Composites Industry Revenue Million Forecast, by Resin Type 2019 & 2032
- Table 25: Global US Defense Composites Industry Revenue Million Forecast, by Country 2019 & 2032
- Table 26: United Kingdom US Defense Composites Industry Revenue (Million) Forecast, by Application 2019 & 2032
- Table 27: Germany US Defense Composites Industry Revenue (Million) Forecast, by Application 2019 & 2032
- Table 28: France US Defense Composites Industry Revenue (Million) Forecast, by Application 2019 & 2032
- Table 29: Italy US Defense Composites Industry Revenue (Million) Forecast, by Application 2019 & 2032
- Table 30: Spain US Defense Composites Industry Revenue (Million) Forecast, by Application 2019 & 2032
- Table 31: Russia US Defense Composites Industry Revenue (Million) Forecast, by Application 2019 & 2032
- Table 32: Benelux US Defense Composites Industry Revenue (Million) Forecast, by Application 2019 & 2032
- Table 33: Nordics US Defense Composites Industry Revenue (Million) Forecast, by Application 2019 & 2032
- Table 34: Rest of Europe US Defense Composites Industry Revenue (Million) Forecast, by Application 2019 & 2032
- Table 35: Global US Defense Composites Industry Revenue Million Forecast, by Application 2019 & 2032
- Table 36: Global US Defense Composites Industry Revenue Million Forecast, by Resin Type 2019 & 2032
- Table 37: Global US Defense Composites Industry Revenue Million Forecast, by Country 2019 & 2032
- Table 38: Turkey US Defense Composites Industry Revenue (Million) Forecast, by Application 2019 & 2032
- Table 39: Israel US Defense Composites Industry Revenue (Million) Forecast, by Application 2019 & 2032
- Table 40: GCC US Defense Composites Industry Revenue (Million) Forecast, by Application 2019 & 2032
- Table 41: North Africa US Defense Composites Industry Revenue (Million) Forecast, by Application 2019 & 2032
- Table 42: South Africa US Defense Composites Industry Revenue (Million) Forecast, by Application 2019 & 2032
- Table 43: Rest of Middle East & Africa US Defense Composites Industry Revenue (Million) Forecast, by Application 2019 & 2032
- Table 44: Global US Defense Composites Industry Revenue Million Forecast, by Application 2019 & 2032
- Table 45: Global US Defense Composites Industry Revenue Million Forecast, by Resin Type 2019 & 2032
- Table 46: Global US Defense Composites Industry Revenue Million Forecast, by Country 2019 & 2032
- Table 47: China US Defense Composites Industry Revenue (Million) Forecast, by Application 2019 & 2032
- Table 48: India US Defense Composites Industry Revenue (Million) Forecast, by Application 2019 & 2032
- Table 49: Japan US Defense Composites Industry Revenue (Million) Forecast, by Application 2019 & 2032
- Table 50: South Korea US Defense Composites Industry Revenue (Million) Forecast, by Application 2019 & 2032
- Table 51: ASEAN US Defense Composites Industry Revenue (Million) Forecast, by Application 2019 & 2032
- Table 52: Oceania US Defense Composites Industry Revenue (Million) Forecast, by Application 2019 & 2032
- Table 53: Rest of Asia Pacific US Defense Composites Industry Revenue (Million) Forecast, by Application 2019 & 2032
Frequently Asked Questions
1. What is the projected Compound Annual Growth Rate (CAGR) of the US Defense Composites Industry?
The projected CAGR is approximately 2.50%.
2. Which companies are prominent players in the US Defense Composites Industry?
Key companies in the market include Honeywell International Inc, ACT Aerospace, Toray Industries Inc, The NORDAM Group LL, Terma AS, Advanced Composites Inc, Leading Technology Composites Inc (LTC), Huntsman International LLC, LMI AEROSPACE, DuPont, Solvay SA, CFOAM LLC, Hexcel Corporation, Alpine Advanced Materials, Sherwood Advanced Composite Technologies.
3. What are the main segments of the US Defense Composites Industry?
The market segments include Application, Resin Type.
4. Can you provide details about the market size?
The market size is estimated to be USD XX Million as of 2022.
5. What are some drivers contributing to market growth?
N/A
6. What are the notable trends driving market growth?
The Thermoplastic Composites Segment is Expected to Register the Highest Growth Rate During the Forecast Period.
7. Are there any restraints impacting market growth?
N/A
8. Can you provide examples of recent developments in the market?
N/A
9. What pricing options are available for accessing the report?
Pricing options include single-user, multi-user, and enterprise licenses priced at USD 3800, USD 4500, and USD 5800 respectively.
10. Is the market size provided in terms of value or volume?
The market size is provided in terms of value, measured in Million.
11. Are there any specific market keywords associated with the report?
Yes, the market keyword associated with the report is "US Defense Composites Industry," which aids in identifying and referencing the specific market segment covered.
12. How do I determine which pricing option suits my needs best?
The pricing options vary based on user requirements and access needs. Individual users may opt for single-user licenses, while businesses requiring broader access may choose multi-user or enterprise licenses for cost-effective access to the report.
13. Are there any additional resources or data provided in the US Defense Composites Industry report?
While the report offers comprehensive insights, it's advisable to review the specific contents or supplementary materials provided to ascertain if additional resources or data are available.
14. How can I stay updated on further developments or reports in the US Defense Composites Industry?
To stay informed about further developments, trends, and reports in the US Defense Composites Industry, consider subscribing to industry newsletters, following relevant companies and organizations, or regularly checking reputable industry news sources and publications.
Methodology
Step 1 - Identification of Relevant Samples Size from Population Database


Step 2 - Approaches for Defining Global Market Size (Value, Volume* & Price*)

Note*: In applicable scenarios
Step 3 - Data Sources
Primary Research
- Web Analytics
- Survey Reports
- Research Institute
- Latest Research Reports
- Opinion Leaders
Secondary Research
- Annual Reports
- White Paper
- Latest Press Release
- Industry Association
- Paid Database
- Investor Presentations

Step 4 - Data Triangulation
Involves using different sources of information in order to increase the validity of a study
These sources are likely to be stakeholders in a program - participants, other researchers, program staff, other community members, and so on.
Then we put all data in single framework & apply various statistical tools to find out the dynamic on the market.
During the analysis stage, feedback from the stakeholder groups would be compared to determine areas of agreement as well as areas of divergence
