

Key Insights
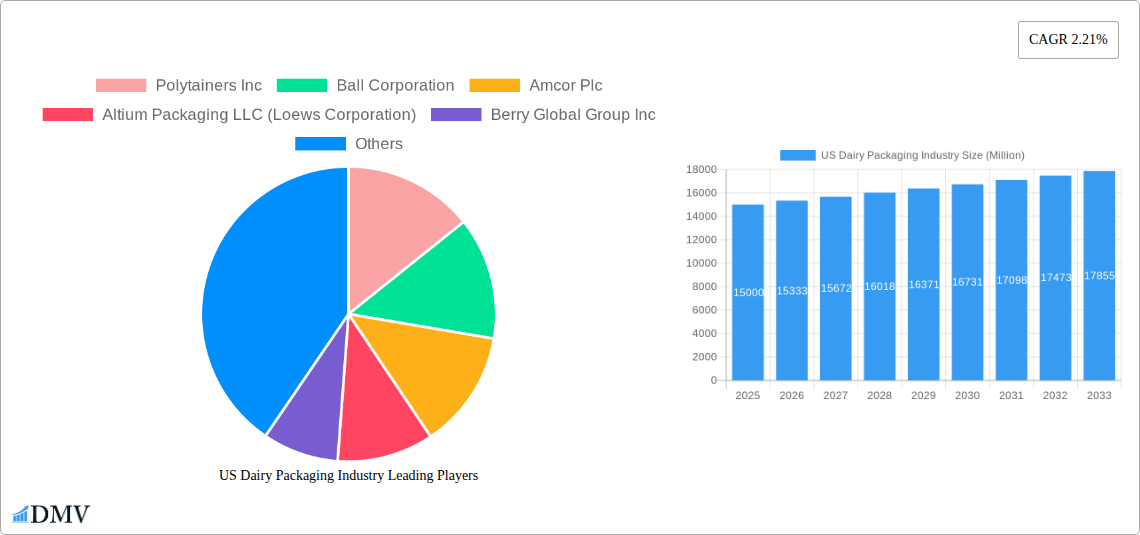
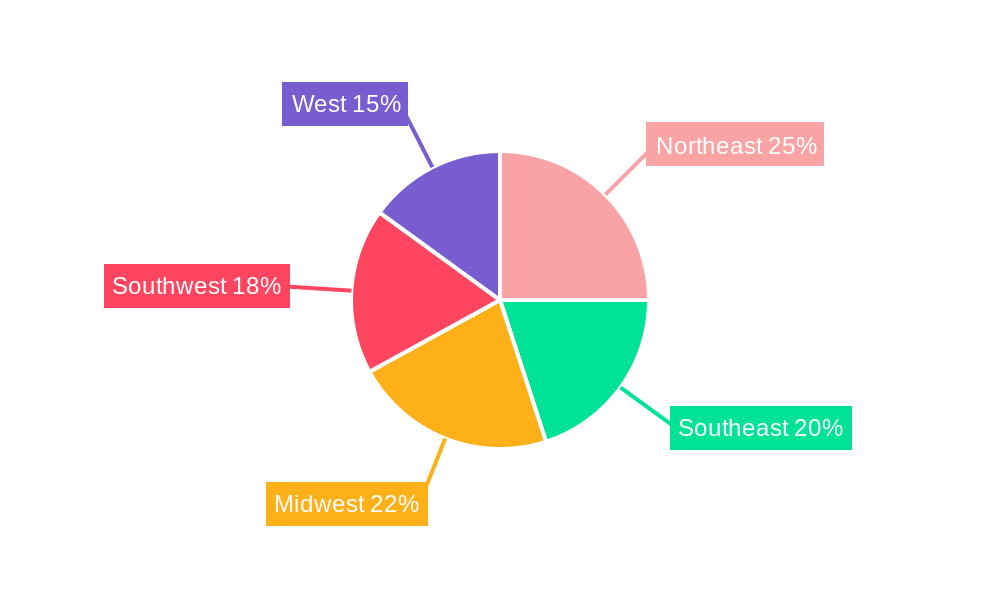
The US dairy packaging market, valued at approximately $15 billion in 2025, is projected to experience steady growth, driven by increasing consumer demand for convenient and shelf-stable dairy products. A Compound Annual Growth Rate (CAGR) of 2.21% from 2025 to 2033 indicates a market poised for continued expansion. This growth is fueled by several key factors. The rising popularity of single-serve and ready-to-drink dairy products necessitates innovative and efficient packaging solutions. Furthermore, the increasing focus on sustainability within the dairy industry is driving adoption of eco-friendly packaging materials like recycled paperboard and plant-based plastics. This shift is particularly evident in the segments for milk and cultured products, which are experiencing higher growth rates compared to cheese and frozen products. The demand for tamper-evident and extended-shelf-life packaging is also significantly influencing the market. Conversely, fluctuating raw material prices and stringent regulatory requirements concerning material safety and recyclability pose challenges to market expansion. Geographic distribution reveals strong performance across all US regions, with the Northeast and West showing slightly higher demand due to larger populations and higher per capita dairy consumption. Competition is intense, with major players like Amcor, Berry Global, and Tetra Pak leading the innovation in sustainable and efficient packaging solutions.
The segmentation analysis highlights the significant role of packaging type. Cartons and boxes remain dominant for milk and cultured products, while pouches offer convenience for single-serve options. The material type segment shows a dynamic shift, with a gradual increase in demand for sustainable alternatives such as paperboard and recycled plastics, although plastic continues to hold a significant market share due to its cost-effectiveness and versatility. The market's evolution will be shaped by continued innovation in sustainable materials, advancements in packaging technology to extend shelf life and improve product preservation, and the ongoing focus on reducing the environmental impact of dairy packaging. Companies are increasingly investing in research and development to meet the evolving consumer preferences and regulatory standards. This trend is expected to further drive the growth of the US dairy packaging market in the coming years.
US Dairy Packaging Industry Market Report: 2019-2033
This comprehensive report provides an in-depth analysis of the US dairy packaging industry, offering invaluable insights for stakeholders seeking to navigate this dynamic market. With a focus on market trends, leading players, and future opportunities, this report covers the period from 2019 to 2033, utilizing 2025 as the base and estimated year. The report leverages extensive market research to provide a robust forecast for 2025-2033, building upon historical data from 2019-2024. The market size is estimated to be xx Million in 2025 and is expected to reach xx Million by 2033.
US Dairy Packaging Industry Market Composition & Trends
The US dairy packaging market is characterized by a moderately concentrated landscape, with key players like Amcor Plc, Berry Global Group Inc, and Sealed Air Corporation holding significant market share. However, a diverse range of smaller players also contribute significantly, leading to competitive dynamics. Market share distribution in 2025 is estimated as follows: Amcor Plc (xx%), Berry Global Group Inc (xx%), Sealed Air Corporation (xx%), Others (xx%). Innovation is primarily driven by consumer demand for sustainable and convenient packaging solutions, necessitating advancements in materials and technologies. Stringent regulations regarding food safety and environmental sustainability shape the industry's trajectory. Substitute products, such as alternative packaging materials (e.g., bioplastics), pose a moderate threat, influencing material selection and industry strategy. End-users include dairy processors of varying sizes, from large multinational corporations to smaller regional producers. M&A activity has been moderate in recent years, with deal values typically ranging from xx Million to xx Million, reflecting consolidation efforts within the sector.
- Market Concentration: Moderately concentrated, with key players holding significant but not dominant shares.
- Innovation Catalysts: Consumer demand for sustainable and convenient packaging; stringent regulations.
- Regulatory Landscape: Stringent food safety and environmental regulations are key drivers.
- Substitute Products: Bioplastics and other alternative materials pose a growing competitive threat.
- End-User Profile: Diverse, ranging from large corporations to small regional processors.
- M&A Activity: Moderate activity with deal values between xx Million and xx Million.
US Dairy Packaging Industry Industry Evolution
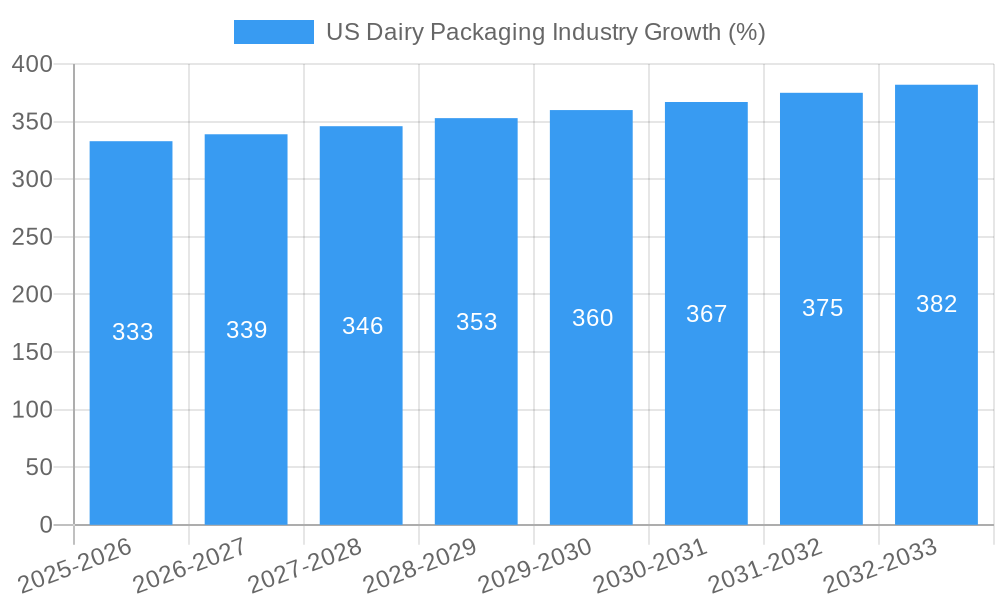
The US dairy packaging industry has witnessed consistent growth over the historical period (2019-2024), primarily fueled by increasing dairy consumption and changing consumer preferences. The market is projected to continue its growth trajectory during the forecast period (2025-2033), with an estimated CAGR of xx%. Technological advancements, particularly in barrier technologies and sustainable materials, have significantly influenced packaging design and functionality. The adoption of advanced barrier films and coatings is estimated to reach xx% by 2033. Consumer demand for eco-friendly packaging is a major catalyst, driving the adoption of recyclable and compostable materials. This trend is further reinforced by increasing regulatory pressures, leading to innovations in recycled content incorporation and reduced reliance on virgin plastics. Growth in the e-commerce sector has also contributed to the industry's expansion, necessitating packaging solutions suitable for online distribution and home delivery.
Leading Regions, Countries, or Segments in US Dairy Packaging Industry
The US dairy packaging market is geographically diverse, with significant activity across various regions. However, the Northeast and West Coast regions exhibit stronger growth due to higher dairy production and consumption. The dominant segment by material type is Plastic, driven by its versatility, cost-effectiveness, and barrier properties. Within product types, Milk packaging holds the largest market share, followed by Cheese and Cultured Products. Bottles and Cartons and Boxes are the leading packaging types, reflecting their widespread use in dairy product distribution.
- Key Drivers by Segment:
- Plastic: Versatility, cost-effectiveness, and advanced barrier technologies.
- Milk: Highest volume consumption.
- Bottles and Cartons & Boxes: Established and widely accepted packaging formats.
- Regional Dominance: Northeast and West Coast regions lead due to high dairy production and consumption.
US Dairy Packaging Industry Product Innovations
Recent innovations focus on sustainable and convenient packaging solutions. Amcor's DairySeal range, featuring ClearCor technology, exemplifies advancements in PET barrier packaging, incorporating up to 80% recycled materials while maintaining product quality. Other innovations include lightweighting initiatives to reduce material usage and improve transportation efficiency, as well as advancements in closures and dispensing systems for improved convenience. These innovations cater to rising consumer demands for sustainability and convenience, creating unique selling propositions for dairy processors.
Propelling Factors for US Dairy Packaging Industry Growth
Growth is propelled by several key factors. Firstly, increasing consumer demand for dairy products, coupled with changing consumption patterns (e.g., convenience formats), drives the need for efficient and attractive packaging. Secondly, technological advancements in materials and processing technologies facilitate the creation of more sustainable and functional packaging options. Finally, regulatory pressures towards environmentally friendly materials accelerate the adoption of recyclable and compostable alternatives, further stimulating innovation and growth.
Obstacles in the US Dairy Packaging Industry Market
Challenges include fluctuating raw material costs, particularly for plastics and paperboard, impacting overall packaging costs. Supply chain disruptions, exacerbated by global events, can lead to production delays and increased costs. Intense competition, with numerous established players and emerging entrants, puts pressure on pricing and profitability. Furthermore, adapting to evolving regulatory requirements and meeting sustainability targets can represent significant investments for companies. These challenges can cumulatively impact market growth and profitability.
Future Opportunities in US Dairy Packaging Industry
Future growth lies in sustainable packaging solutions, with increased demand for recyclable, compostable, and bio-based materials. Innovations in active and intelligent packaging technologies, enhancing product shelf life and providing real-time information, present significant opportunities. Expanding into new markets, such as ready-to-drink dairy beverages and value-added dairy products, offer further potential. Finally, catering to the growing demand for convenient and portable formats aligns with changing consumer lifestyles and preferences.
Major Players in the US Dairy Packaging Industry Ecosystem
- Polytainers Inc
- Ball Corporation
- Amcor Plc
- Altium Packaging LLC (Loews Corporation)
- Berry Global Group Inc
- Winpak Ltd
- International Paper Company
- Smurfit Kappa Group PLC
- Tetra Pak International SA
- Sealed Air Corporation
- Huhtamaki Oyj
Key Developments in US Dairy Packaging Industry Industry
- September 2022: Amcor launches DairySeal range with ClearCor technology, enabling up to 80% recycled content in PET bottles. This development enhances sustainability while improving product functionality and expanding distribution channels.
- August 2022: The Northeast Dairy Business Innovation Center (NE-DBIC) awards USD 1.1 Million in grants for dairy product packaging innovation, focusing on sustainable alternatives and reducing virgin plastic usage. This signifies a significant push towards environmentally friendly packaging solutions within the industry.
Strategic US Dairy Packaging Industry Market Forecast
The US dairy packaging market is poised for continued growth driven by increasing consumer demand, technological advancements, and sustainability initiatives. The focus on eco-friendly materials and packaging designs will be key to future success. The market's expansion will be significantly influenced by innovations in sustainable packaging materials and the adoption of advanced technologies. The forecast suggests substantial growth opportunities for companies that prioritize sustainability, convenience, and innovative solutions.
US Dairy Packaging Industry Segmentation
-
1. Material Type
- 1.1. Plastic
- 1.2. Paper and Paperboard
- 1.3. Glass
- 1.4. Metal
-
2. Product Type
- 2.1. Milk
- 2.2. Cheese
- 2.3. Frozen Products
- 2.4. Cultured Products
- 2.5. Other Product Types
-
3. Packaging Type
- 3.1. Bottles
- 3.2. Pouches
- 3.3. Cartons and Boxes
- 3.4. Bags and Wraps
- 3.5. Other Packaging Types
US Dairy Packaging Industry Segmentation By Geography
-
1. North America
- 1.1. United States
- 1.2. Canada
- 1.3. Mexico
-
2. South America
- 2.1. Brazil
- 2.2. Argentina
- 2.3. Rest of South America
-
3. Europe
- 3.1. United Kingdom
- 3.2. Germany
- 3.3. France
- 3.4. Italy
- 3.5. Spain
- 3.6. Russia
- 3.7. Benelux
- 3.8. Nordics
- 3.9. Rest of Europe
-
4. Middle East & Africa
- 4.1. Turkey
- 4.2. Israel
- 4.3. GCC
- 4.4. North Africa
- 4.5. South Africa
- 4.6. Rest of Middle East & Africa
-
5. Asia Pacific
- 5.1. China
- 5.2. India
- 5.3. Japan
- 5.4. South Korea
- 5.5. ASEAN
- 5.6. Oceania
- 5.7. Rest of Asia Pacific
US Dairy Packaging Industry REPORT HIGHLIGHTS
| Aspects | Details |
|---|---|
| Study Period | 2019-2033 |
| Base Year | 2024 |
| Estimated Year | 2025 |
| Forecast Period | 2025-2033 |
| Historical Period | 2019-2024 |
| Growth Rate | CAGR of 2.21% from 2019-2033 |
| Segmentation |
|
Table of Contents
- 1. Introduction
- 1.1. Research Scope
- 1.2. Market Segmentation
- 1.3. Research Methodology
- 1.4. Definitions and Assumptions
- 2. Executive Summary
- 2.1. Introduction
- 3. Market Dynamics
- 3.1. Introduction
- 3.2. Market Drivers
- 3.2.1. Increasing Consumer Preference Toward Protein-based Products; Increasing Adoption of In-house Packaging Methods; Increasing Adoption of Packages Incorporating Small Portion Size
- 3.3. Market Restrains
- 3.3.1. Greenhouse Gas Emission due to Dairy Activities Leading to Legislative Issues
- 3.4. Market Trends
- 3.4.1. Increasing Consumer Preference Toward Protein-based Products
- 4. Market Factor Analysis
- 4.1. Porters Five Forces
- 4.2. Supply/Value Chain
- 4.3. PESTEL analysis
- 4.4. Market Entropy
- 4.5. Patent/Trademark Analysis
- 5. Global US Dairy Packaging Industry Analysis, Insights and Forecast, 2019-2031
- 5.1. Market Analysis, Insights and Forecast - by Material Type
- 5.1.1. Plastic
- 5.1.2. Paper and Paperboard
- 5.1.3. Glass
- 5.1.4. Metal
- 5.2. Market Analysis, Insights and Forecast - by Product Type
- 5.2.1. Milk
- 5.2.2. Cheese
- 5.2.3. Frozen Products
- 5.2.4. Cultured Products
- 5.2.5. Other Product Types
- 5.3. Market Analysis, Insights and Forecast - by Packaging Type
- 5.3.1. Bottles
- 5.3.2. Pouches
- 5.3.3. Cartons and Boxes
- 5.3.4. Bags and Wraps
- 5.3.5. Other Packaging Types
- 5.4. Market Analysis, Insights and Forecast - by Region
- 5.4.1. North America
- 5.4.2. South America
- 5.4.3. Europe
- 5.4.4. Middle East & Africa
- 5.4.5. Asia Pacific
- 5.1. Market Analysis, Insights and Forecast - by Material Type
- 6. North America US Dairy Packaging Industry Analysis, Insights and Forecast, 2019-2031
- 6.1. Market Analysis, Insights and Forecast - by Material Type
- 6.1.1. Plastic
- 6.1.2. Paper and Paperboard
- 6.1.3. Glass
- 6.1.4. Metal
- 6.2. Market Analysis, Insights and Forecast - by Product Type
- 6.2.1. Milk
- 6.2.2. Cheese
- 6.2.3. Frozen Products
- 6.2.4. Cultured Products
- 6.2.5. Other Product Types
- 6.3. Market Analysis, Insights and Forecast - by Packaging Type
- 6.3.1. Bottles
- 6.3.2. Pouches
- 6.3.3. Cartons and Boxes
- 6.3.4. Bags and Wraps
- 6.3.5. Other Packaging Types
- 6.1. Market Analysis, Insights and Forecast - by Material Type
- 7. South America US Dairy Packaging Industry Analysis, Insights and Forecast, 2019-2031
- 7.1. Market Analysis, Insights and Forecast - by Material Type
- 7.1.1. Plastic
- 7.1.2. Paper and Paperboard
- 7.1.3. Glass
- 7.1.4. Metal
- 7.2. Market Analysis, Insights and Forecast - by Product Type
- 7.2.1. Milk
- 7.2.2. Cheese
- 7.2.3. Frozen Products
- 7.2.4. Cultured Products
- 7.2.5. Other Product Types
- 7.3. Market Analysis, Insights and Forecast - by Packaging Type
- 7.3.1. Bottles
- 7.3.2. Pouches
- 7.3.3. Cartons and Boxes
- 7.3.4. Bags and Wraps
- 7.3.5. Other Packaging Types
- 7.1. Market Analysis, Insights and Forecast - by Material Type
- 8. Europe US Dairy Packaging Industry Analysis, Insights and Forecast, 2019-2031
- 8.1. Market Analysis, Insights and Forecast - by Material Type
- 8.1.1. Plastic
- 8.1.2. Paper and Paperboard
- 8.1.3. Glass
- 8.1.4. Metal
- 8.2. Market Analysis, Insights and Forecast - by Product Type
- 8.2.1. Milk
- 8.2.2. Cheese
- 8.2.3. Frozen Products
- 8.2.4. Cultured Products
- 8.2.5. Other Product Types
- 8.3. Market Analysis, Insights and Forecast - by Packaging Type
- 8.3.1. Bottles
- 8.3.2. Pouches
- 8.3.3. Cartons and Boxes
- 8.3.4. Bags and Wraps
- 8.3.5. Other Packaging Types
- 8.1. Market Analysis, Insights and Forecast - by Material Type
- 9. Middle East & Africa US Dairy Packaging Industry Analysis, Insights and Forecast, 2019-2031
- 9.1. Market Analysis, Insights and Forecast - by Material Type
- 9.1.1. Plastic
- 9.1.2. Paper and Paperboard
- 9.1.3. Glass
- 9.1.4. Metal
- 9.2. Market Analysis, Insights and Forecast - by Product Type
- 9.2.1. Milk
- 9.2.2. Cheese
- 9.2.3. Frozen Products
- 9.2.4. Cultured Products
- 9.2.5. Other Product Types
- 9.3. Market Analysis, Insights and Forecast - by Packaging Type
- 9.3.1. Bottles
- 9.3.2. Pouches
- 9.3.3. Cartons and Boxes
- 9.3.4. Bags and Wraps
- 9.3.5. Other Packaging Types
- 9.1. Market Analysis, Insights and Forecast - by Material Type
- 10. Asia Pacific US Dairy Packaging Industry Analysis, Insights and Forecast, 2019-2031
- 10.1. Market Analysis, Insights and Forecast - by Material Type
- 10.1.1. Plastic
- 10.1.2. Paper and Paperboard
- 10.1.3. Glass
- 10.1.4. Metal
- 10.2. Market Analysis, Insights and Forecast - by Product Type
- 10.2.1. Milk
- 10.2.2. Cheese
- 10.2.3. Frozen Products
- 10.2.4. Cultured Products
- 10.2.5. Other Product Types
- 10.3. Market Analysis, Insights and Forecast - by Packaging Type
- 10.3.1. Bottles
- 10.3.2. Pouches
- 10.3.3. Cartons and Boxes
- 10.3.4. Bags and Wraps
- 10.3.5. Other Packaging Types
- 10.1. Market Analysis, Insights and Forecast - by Material Type
- 11. Northeast US Dairy Packaging Industry Analysis, Insights and Forecast, 2019-2031
- 12. Southeast US Dairy Packaging Industry Analysis, Insights and Forecast, 2019-2031
- 13. Midwest US Dairy Packaging Industry Analysis, Insights and Forecast, 2019-2031
- 14. Southwest US Dairy Packaging Industry Analysis, Insights and Forecast, 2019-2031
- 15. West US Dairy Packaging Industry Analysis, Insights and Forecast, 2019-2031
- 16. Competitive Analysis
- 16.1. Global Market Share Analysis 2024
- 16.2. Company Profiles
- 16.2.1 Polytainers Inc
- 16.2.1.1. Overview
- 16.2.1.2. Products
- 16.2.1.3. SWOT Analysis
- 16.2.1.4. Recent Developments
- 16.2.1.5. Financials (Based on Availability)
- 16.2.2 Ball Corporation
- 16.2.2.1. Overview
- 16.2.2.2. Products
- 16.2.2.3. SWOT Analysis
- 16.2.2.4. Recent Developments
- 16.2.2.5. Financials (Based on Availability)
- 16.2.3 Amcor Plc
- 16.2.3.1. Overview
- 16.2.3.2. Products
- 16.2.3.3. SWOT Analysis
- 16.2.3.4. Recent Developments
- 16.2.3.5. Financials (Based on Availability)
- 16.2.4 Altium Packaging LLC (Loews Corporation)
- 16.2.4.1. Overview
- 16.2.4.2. Products
- 16.2.4.3. SWOT Analysis
- 16.2.4.4. Recent Developments
- 16.2.4.5. Financials (Based on Availability)
- 16.2.5 Berry Global Group Inc
- 16.2.5.1. Overview
- 16.2.5.2. Products
- 16.2.5.3. SWOT Analysis
- 16.2.5.4. Recent Developments
- 16.2.5.5. Financials (Based on Availability)
- 16.2.6 Winpak Ltd
- 16.2.6.1. Overview
- 16.2.6.2. Products
- 16.2.6.3. SWOT Analysis
- 16.2.6.4. Recent Developments
- 16.2.6.5. Financials (Based on Availability)
- 16.2.7 International Paper Company
- 16.2.7.1. Overview
- 16.2.7.2. Products
- 16.2.7.3. SWOT Analysis
- 16.2.7.4. Recent Developments
- 16.2.7.5. Financials (Based on Availability)
- 16.2.8 Smurfit Kappa Group PLC
- 16.2.8.1. Overview
- 16.2.8.2. Products
- 16.2.8.3. SWOT Analysis
- 16.2.8.4. Recent Developments
- 16.2.8.5. Financials (Based on Availability)
- 16.2.9 Tetra Pak International SA*List Not Exhaustive
- 16.2.9.1. Overview
- 16.2.9.2. Products
- 16.2.9.3. SWOT Analysis
- 16.2.9.4. Recent Developments
- 16.2.9.5. Financials (Based on Availability)
- 16.2.10 Sealed Air Corporation
- 16.2.10.1. Overview
- 16.2.10.2. Products
- 16.2.10.3. SWOT Analysis
- 16.2.10.4. Recent Developments
- 16.2.10.5. Financials (Based on Availability)
- 16.2.11 Huhtamaki Oyj
- 16.2.11.1. Overview
- 16.2.11.2. Products
- 16.2.11.3. SWOT Analysis
- 16.2.11.4. Recent Developments
- 16.2.11.5. Financials (Based on Availability)
- 16.2.1 Polytainers Inc
List of Figures
- Figure 1: Global US Dairy Packaging Industry Revenue Breakdown (Million, %) by Region 2024 & 2032
- Figure 2: United states US Dairy Packaging Industry Revenue (Million), by Country 2024 & 2032
- Figure 3: United states US Dairy Packaging Industry Revenue Share (%), by Country 2024 & 2032
- Figure 4: North America US Dairy Packaging Industry Revenue (Million), by Material Type 2024 & 2032
- Figure 5: North America US Dairy Packaging Industry Revenue Share (%), by Material Type 2024 & 2032
- Figure 6: North America US Dairy Packaging Industry Revenue (Million), by Product Type 2024 & 2032
- Figure 7: North America US Dairy Packaging Industry Revenue Share (%), by Product Type 2024 & 2032
- Figure 8: North America US Dairy Packaging Industry Revenue (Million), by Packaging Type 2024 & 2032
- Figure 9: North America US Dairy Packaging Industry Revenue Share (%), by Packaging Type 2024 & 2032
- Figure 10: North America US Dairy Packaging Industry Revenue (Million), by Country 2024 & 2032
- Figure 11: North America US Dairy Packaging Industry Revenue Share (%), by Country 2024 & 2032
- Figure 12: South America US Dairy Packaging Industry Revenue (Million), by Material Type 2024 & 2032
- Figure 13: South America US Dairy Packaging Industry Revenue Share (%), by Material Type 2024 & 2032
- Figure 14: South America US Dairy Packaging Industry Revenue (Million), by Product Type 2024 & 2032
- Figure 15: South America US Dairy Packaging Industry Revenue Share (%), by Product Type 2024 & 2032
- Figure 16: South America US Dairy Packaging Industry Revenue (Million), by Packaging Type 2024 & 2032
- Figure 17: South America US Dairy Packaging Industry Revenue Share (%), by Packaging Type 2024 & 2032
- Figure 18: South America US Dairy Packaging Industry Revenue (Million), by Country 2024 & 2032
- Figure 19: South America US Dairy Packaging Industry Revenue Share (%), by Country 2024 & 2032
- Figure 20: Europe US Dairy Packaging Industry Revenue (Million), by Material Type 2024 & 2032
- Figure 21: Europe US Dairy Packaging Industry Revenue Share (%), by Material Type 2024 & 2032
- Figure 22: Europe US Dairy Packaging Industry Revenue (Million), by Product Type 2024 & 2032
- Figure 23: Europe US Dairy Packaging Industry Revenue Share (%), by Product Type 2024 & 2032
- Figure 24: Europe US Dairy Packaging Industry Revenue (Million), by Packaging Type 2024 & 2032
- Figure 25: Europe US Dairy Packaging Industry Revenue Share (%), by Packaging Type 2024 & 2032
- Figure 26: Europe US Dairy Packaging Industry Revenue (Million), by Country 2024 & 2032
- Figure 27: Europe US Dairy Packaging Industry Revenue Share (%), by Country 2024 & 2032
- Figure 28: Middle East & Africa US Dairy Packaging Industry Revenue (Million), by Material Type 2024 & 2032
- Figure 29: Middle East & Africa US Dairy Packaging Industry Revenue Share (%), by Material Type 2024 & 2032
- Figure 30: Middle East & Africa US Dairy Packaging Industry Revenue (Million), by Product Type 2024 & 2032
- Figure 31: Middle East & Africa US Dairy Packaging Industry Revenue Share (%), by Product Type 2024 & 2032
- Figure 32: Middle East & Africa US Dairy Packaging Industry Revenue (Million), by Packaging Type 2024 & 2032
- Figure 33: Middle East & Africa US Dairy Packaging Industry Revenue Share (%), by Packaging Type 2024 & 2032
- Figure 34: Middle East & Africa US Dairy Packaging Industry Revenue (Million), by Country 2024 & 2032
- Figure 35: Middle East & Africa US Dairy Packaging Industry Revenue Share (%), by Country 2024 & 2032
- Figure 36: Asia Pacific US Dairy Packaging Industry Revenue (Million), by Material Type 2024 & 2032
- Figure 37: Asia Pacific US Dairy Packaging Industry Revenue Share (%), by Material Type 2024 & 2032
- Figure 38: Asia Pacific US Dairy Packaging Industry Revenue (Million), by Product Type 2024 & 2032
- Figure 39: Asia Pacific US Dairy Packaging Industry Revenue Share (%), by Product Type 2024 & 2032
- Figure 40: Asia Pacific US Dairy Packaging Industry Revenue (Million), by Packaging Type 2024 & 2032
- Figure 41: Asia Pacific US Dairy Packaging Industry Revenue Share (%), by Packaging Type 2024 & 2032
- Figure 42: Asia Pacific US Dairy Packaging Industry Revenue (Million), by Country 2024 & 2032
- Figure 43: Asia Pacific US Dairy Packaging Industry Revenue Share (%), by Country 2024 & 2032
List of Tables
- Table 1: Global US Dairy Packaging Industry Revenue Million Forecast, by Region 2019 & 2032
- Table 2: Global US Dairy Packaging Industry Revenue Million Forecast, by Material Type 2019 & 2032
- Table 3: Global US Dairy Packaging Industry Revenue Million Forecast, by Product Type 2019 & 2032
- Table 4: Global US Dairy Packaging Industry Revenue Million Forecast, by Packaging Type 2019 & 2032
- Table 5: Global US Dairy Packaging Industry Revenue Million Forecast, by Region 2019 & 2032
- Table 6: Global US Dairy Packaging Industry Revenue Million Forecast, by Country 2019 & 2032
- Table 7: Northeast US Dairy Packaging Industry Revenue (Million) Forecast, by Application 2019 & 2032
- Table 8: Southeast US Dairy Packaging Industry Revenue (Million) Forecast, by Application 2019 & 2032
- Table 9: Midwest US Dairy Packaging Industry Revenue (Million) Forecast, by Application 2019 & 2032
- Table 10: Southwest US Dairy Packaging Industry Revenue (Million) Forecast, by Application 2019 & 2032
- Table 11: West US Dairy Packaging Industry Revenue (Million) Forecast, by Application 2019 & 2032
- Table 12: Global US Dairy Packaging Industry Revenue Million Forecast, by Material Type 2019 & 2032
- Table 13: Global US Dairy Packaging Industry Revenue Million Forecast, by Product Type 2019 & 2032
- Table 14: Global US Dairy Packaging Industry Revenue Million Forecast, by Packaging Type 2019 & 2032
- Table 15: Global US Dairy Packaging Industry Revenue Million Forecast, by Country 2019 & 2032
- Table 16: United States US Dairy Packaging Industry Revenue (Million) Forecast, by Application 2019 & 2032
- Table 17: Canada US Dairy Packaging Industry Revenue (Million) Forecast, by Application 2019 & 2032
- Table 18: Mexico US Dairy Packaging Industry Revenue (Million) Forecast, by Application 2019 & 2032
- Table 19: Global US Dairy Packaging Industry Revenue Million Forecast, by Material Type 2019 & 2032
- Table 20: Global US Dairy Packaging Industry Revenue Million Forecast, by Product Type 2019 & 2032
- Table 21: Global US Dairy Packaging Industry Revenue Million Forecast, by Packaging Type 2019 & 2032
- Table 22: Global US Dairy Packaging Industry Revenue Million Forecast, by Country 2019 & 2032
- Table 23: Brazil US Dairy Packaging Industry Revenue (Million) Forecast, by Application 2019 & 2032
- Table 24: Argentina US Dairy Packaging Industry Revenue (Million) Forecast, by Application 2019 & 2032
- Table 25: Rest of South America US Dairy Packaging Industry Revenue (Million) Forecast, by Application 2019 & 2032
- Table 26: Global US Dairy Packaging Industry Revenue Million Forecast, by Material Type 2019 & 2032
- Table 27: Global US Dairy Packaging Industry Revenue Million Forecast, by Product Type 2019 & 2032
- Table 28: Global US Dairy Packaging Industry Revenue Million Forecast, by Packaging Type 2019 & 2032
- Table 29: Global US Dairy Packaging Industry Revenue Million Forecast, by Country 2019 & 2032
- Table 30: United Kingdom US Dairy Packaging Industry Revenue (Million) Forecast, by Application 2019 & 2032
- Table 31: Germany US Dairy Packaging Industry Revenue (Million) Forecast, by Application 2019 & 2032
- Table 32: France US Dairy Packaging Industry Revenue (Million) Forecast, by Application 2019 & 2032
- Table 33: Italy US Dairy Packaging Industry Revenue (Million) Forecast, by Application 2019 & 2032
- Table 34: Spain US Dairy Packaging Industry Revenue (Million) Forecast, by Application 2019 & 2032
- Table 35: Russia US Dairy Packaging Industry Revenue (Million) Forecast, by Application 2019 & 2032
- Table 36: Benelux US Dairy Packaging Industry Revenue (Million) Forecast, by Application 2019 & 2032
- Table 37: Nordics US Dairy Packaging Industry Revenue (Million) Forecast, by Application 2019 & 2032
- Table 38: Rest of Europe US Dairy Packaging Industry Revenue (Million) Forecast, by Application 2019 & 2032
- Table 39: Global US Dairy Packaging Industry Revenue Million Forecast, by Material Type 2019 & 2032
- Table 40: Global US Dairy Packaging Industry Revenue Million Forecast, by Product Type 2019 & 2032
- Table 41: Global US Dairy Packaging Industry Revenue Million Forecast, by Packaging Type 2019 & 2032
- Table 42: Global US Dairy Packaging Industry Revenue Million Forecast, by Country 2019 & 2032
- Table 43: Turkey US Dairy Packaging Industry Revenue (Million) Forecast, by Application 2019 & 2032
- Table 44: Israel US Dairy Packaging Industry Revenue (Million) Forecast, by Application 2019 & 2032
- Table 45: GCC US Dairy Packaging Industry Revenue (Million) Forecast, by Application 2019 & 2032
- Table 46: North Africa US Dairy Packaging Industry Revenue (Million) Forecast, by Application 2019 & 2032
- Table 47: South Africa US Dairy Packaging Industry Revenue (Million) Forecast, by Application 2019 & 2032
- Table 48: Rest of Middle East & Africa US Dairy Packaging Industry Revenue (Million) Forecast, by Application 2019 & 2032
- Table 49: Global US Dairy Packaging Industry Revenue Million Forecast, by Material Type 2019 & 2032
- Table 50: Global US Dairy Packaging Industry Revenue Million Forecast, by Product Type 2019 & 2032
- Table 51: Global US Dairy Packaging Industry Revenue Million Forecast, by Packaging Type 2019 & 2032
- Table 52: Global US Dairy Packaging Industry Revenue Million Forecast, by Country 2019 & 2032
- Table 53: China US Dairy Packaging Industry Revenue (Million) Forecast, by Application 2019 & 2032
- Table 54: India US Dairy Packaging Industry Revenue (Million) Forecast, by Application 2019 & 2032
- Table 55: Japan US Dairy Packaging Industry Revenue (Million) Forecast, by Application 2019 & 2032
- Table 56: South Korea US Dairy Packaging Industry Revenue (Million) Forecast, by Application 2019 & 2032
- Table 57: ASEAN US Dairy Packaging Industry Revenue (Million) Forecast, by Application 2019 & 2032
- Table 58: Oceania US Dairy Packaging Industry Revenue (Million) Forecast, by Application 2019 & 2032
- Table 59: Rest of Asia Pacific US Dairy Packaging Industry Revenue (Million) Forecast, by Application 2019 & 2032
Frequently Asked Questions
1. What is the projected Compound Annual Growth Rate (CAGR) of the US Dairy Packaging Industry?
The projected CAGR is approximately 2.21%.
2. Which companies are prominent players in the US Dairy Packaging Industry?
Key companies in the market include Polytainers Inc, Ball Corporation, Amcor Plc, Altium Packaging LLC (Loews Corporation), Berry Global Group Inc, Winpak Ltd, International Paper Company, Smurfit Kappa Group PLC, Tetra Pak International SA*List Not Exhaustive, Sealed Air Corporation, Huhtamaki Oyj.
3. What are the main segments of the US Dairy Packaging Industry?
The market segments include Material Type, Product Type, Packaging Type.
4. Can you provide details about the market size?
The market size is estimated to be USD XX Million as of 2022.
5. What are some drivers contributing to market growth?
Increasing Consumer Preference Toward Protein-based Products; Increasing Adoption of In-house Packaging Methods; Increasing Adoption of Packages Incorporating Small Portion Size.
6. What are the notable trends driving market growth?
Increasing Consumer Preference Toward Protein-based Products.
7. Are there any restraints impacting market growth?
Greenhouse Gas Emission due to Dairy Activities Leading to Legislative Issues.
8. Can you provide examples of recent developments in the market?
September 2022: The DairySeal range from Amcor Rigid Packaging (ARP) contains ClearCor, an advanced PET barrier. The DairySeal series of packaging may be produced using up to 80% recyclable materials while still providing the brand with better flavor and function. The DairySeal line in PET provides businesses with simple access to e-commerce and convenience store distribution channels, where round, firm plastic bottles are intended to fit on refrigerator shelves.
9. What pricing options are available for accessing the report?
Pricing options include single-user, multi-user, and enterprise licenses priced at USD 3800, USD 4500, and USD 5800 respectively.
10. Is the market size provided in terms of value or volume?
The market size is provided in terms of value, measured in Million.
11. Are there any specific market keywords associated with the report?
Yes, the market keyword associated with the report is "US Dairy Packaging Industry," which aids in identifying and referencing the specific market segment covered.
12. How do I determine which pricing option suits my needs best?
The pricing options vary based on user requirements and access needs. Individual users may opt for single-user licenses, while businesses requiring broader access may choose multi-user or enterprise licenses for cost-effective access to the report.
13. Are there any additional resources or data provided in the US Dairy Packaging Industry report?
While the report offers comprehensive insights, it's advisable to review the specific contents or supplementary materials provided to ascertain if additional resources or data are available.
14. How can I stay updated on further developments or reports in the US Dairy Packaging Industry?
To stay informed about further developments, trends, and reports in the US Dairy Packaging Industry, consider subscribing to industry newsletters, following relevant companies and organizations, or regularly checking reputable industry news sources and publications.
Methodology
Step 1 - Identification of Relevant Samples Size from Population Database


Step 2 - Approaches for Defining Global Market Size (Value, Volume* & Price*)

Note*: In applicable scenarios
Step 3 - Data Sources
Primary Research
- Web Analytics
- Survey Reports
- Research Institute
- Latest Research Reports
- Opinion Leaders
Secondary Research
- Annual Reports
- White Paper
- Latest Press Release
- Industry Association
- Paid Database
- Investor Presentations

Step 4 - Data Triangulation
Involves using different sources of information in order to increase the validity of a study
These sources are likely to be stakeholders in a program - participants, other researchers, program staff, other community members, and so on.
Then we put all data in single framework & apply various statistical tools to find out the dynamic on the market.
During the analysis stage, feedback from the stakeholder groups would be compared to determine areas of agreement as well as areas of divergence
