

Key Insights
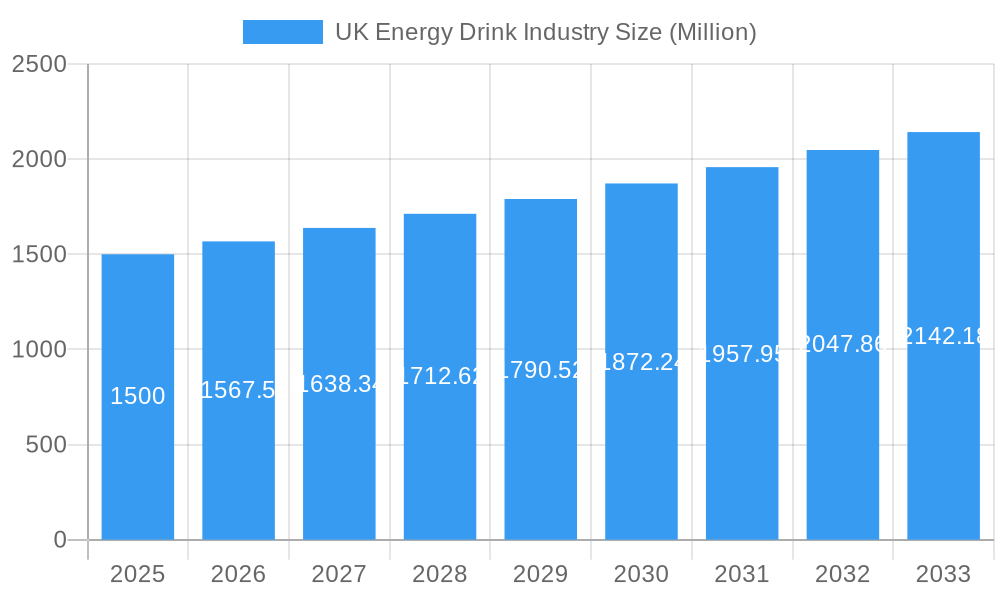
The UK energy drink market, valued at £2.2 billion in the base year 2025, is forecast to expand at a compound annual growth rate (CAGR) of 5.67% through 2033. This growth is propelled by increasing demand for quick energy solutions driven by demanding lifestyles. The evolving health and wellness sector is introducing functional energy drinks fortified with vitamins, minerals, and natural ingredients. Shifting consumer preferences towards healthier options, with a focus on reduced sugar content, are fueling the rise of low-sugar and zero-sugar variants. Extensive distribution networks, spanning supermarkets, convenience stores, specialty retailers, and online platforms, ensure broad market accessibility. However, concerns surrounding the health implications of high caffeine and sugar intake, coupled with heightened regulatory oversight, pose significant market restraints. Market segmentation by packaging, product type, and distribution channel offers critical insights into consumer behavior and market dynamics. Leading players such as Red Bull, Coca-Cola, and PepsiCo, alongside niche-focused emerging brands, are actively influencing the competitive environment.
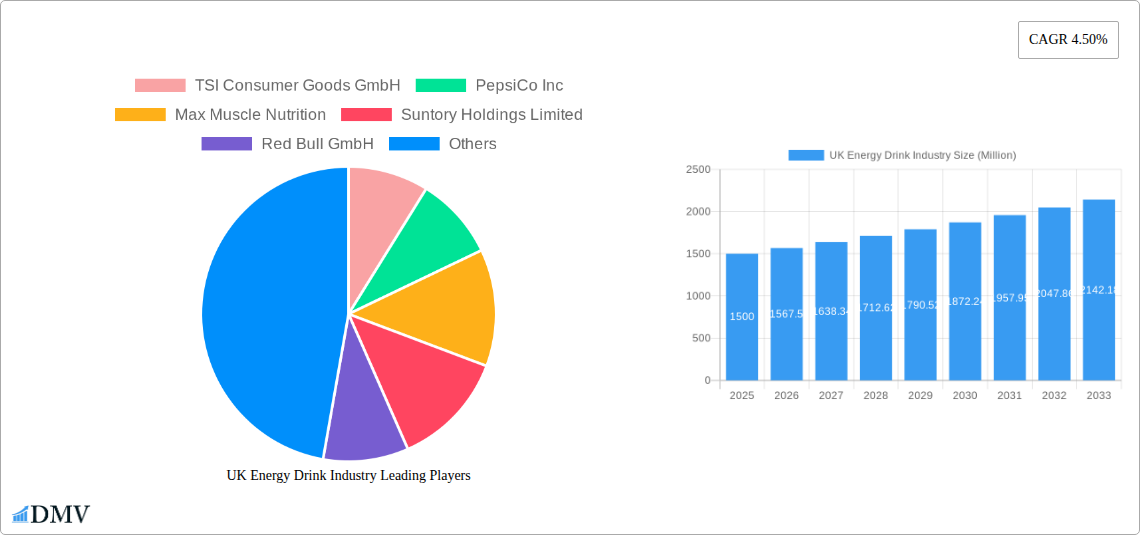
UK Energy Drink Industry Market Size (In Billion)
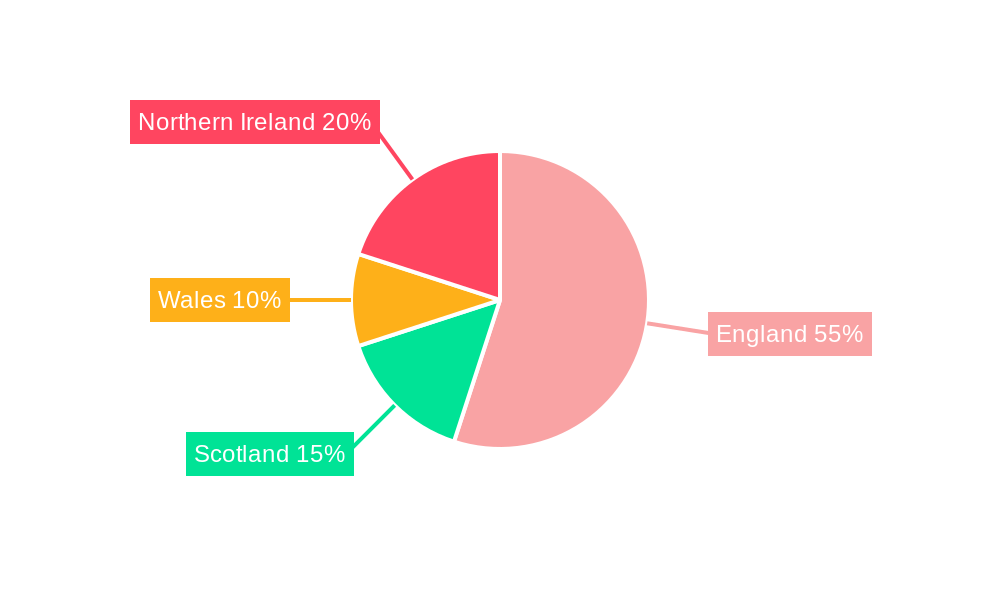
Future market expansion relies on continuous innovation and adaptation to evolving consumer demands. The growth of functional energy drinks and the preference for natural, healthier alternatives present significant opportunities. Companies are expected to prioritize product diversification, introducing novel flavors and functional benefits, alongside sustainable packaging. Strategic expansion into e-commerce and targeted marketing toward health-conscious consumers will be pivotal. Geographical segmentation within the UK (England, Wales, Scotland, Northern Ireland) highlights regional consumption variations, necessitating localized marketing strategies. Sustained market growth will be achieved through innovative product development, enhanced distribution channels, and strategic marketing approaches tailored to specific consumer demographics and preferences.
UK Energy Drink Industry Company Market Share
UK Energy Drink Industry: A Comprehensive Market Report (2019-2033)
This insightful report provides a detailed analysis of the UK energy drink industry, offering a comprehensive overview of market trends, competitive landscape, and future growth prospects. The report covers the period from 2019 to 2033, with a focus on the estimated year 2025. We delve into market segmentation, key players, and emerging innovations, equipping stakeholders with the knowledge needed to make informed decisions. The UK energy drink market, valued at £XX Million in 2024, is projected to reach £XX Million by 2033, exhibiting a robust Compound Annual Growth Rate (CAGR) of XX%.
UK Energy Drink Industry Market Composition & Trends
This section provides a deep dive into the UK energy drink market's structure, evaluating key aspects influencing its evolution. We analyze market concentration, highlighting the dominance of major players like PepsiCo Inc, Red Bull GmbH, and The Coca-Cola Company, alongside emerging competitors. The report explores the role of innovation, regulatory changes impacting ingredients and marketing, and the presence of substitute beverages. Consumer preferences, particularly the growing demand for healthier alternatives and functional benefits, are also examined. Furthermore, we analyze M&A activity within the sector, including deal values and their impact on market dynamics. Market share distribution among key players is detailed, offering insights into competitive positioning.
- Market Concentration: High, with a few major players controlling a significant share.
- Innovation Catalysts: Growing demand for natural, low-sugar, and functional energy drinks.
- Regulatory Landscape: Evolving regulations on sugar content, marketing, and labeling.
- Substitute Products: Coffee, tea, sports drinks, and functional beverages.
- End-User Profiles: Young adults, athletes, and professionals seeking a performance boost.
- M&A Activity: XX Million in total deal value from 2019 to 2024, with a focus on expanding product portfolios and market reach.
UK Energy Drink Industry Evolution
This section charts the evolution of the UK energy drink market, analyzing historical growth (2019-2024) and projecting future trends (2025-2033). We examine the market's growth trajectories, highlighting periods of accelerated expansion and potential plateaus. This analysis incorporates technological advancements, such as the development of more sustainable packaging and the incorporation of novel ingredients and functional components. The impact of shifting consumer preferences, including the rise of health-conscious consumers and the growing demand for plant-based alternatives, is assessed through growth rates and adoption metrics. We also look at changing distribution channels, including the expansion of online retail and the role of specialist stores. The market experienced an average annual growth rate of XX% between 2019 and 2024, driven primarily by increased consumer demand and the launch of innovative products.
Leading Regions, Countries, or Segments in UK Energy Drink Industry
This section identifies the leading regions, countries, and market segments within the UK energy drink market. We examine performance across various categories:
- By Packaging Type: Cans currently hold the largest market share, followed by PET bottles.
- By Product Type: Ready-to-drink energy drinks dominate, with shots and mixers exhibiting growth potential.
- By Distribution Channel: Supermarkets/hypermarkets account for the largest share, followed by convenience stores and specialist stores. Online retail is experiencing growth.
Key Drivers:
- Supermarkets/Hypermarkets: High consumer traffic, extensive shelf space, and established distribution networks.
- Convenience Stores: Strategic location and accessibility for on-the-go consumers.
- Cans: Portability, convenience, and established consumer preference.
- Ready-to-drink: Ease of consumption and immediate energy boost.
The dominance of these segments is attributed to several factors, including established consumer preferences, distribution network efficiencies, and supportive regulatory environments. Further analysis explores investment trends and regulatory support for each dominant segment.
UK Energy Drink Industry Product Innovations
Recent years have witnessed significant product innovation within the UK energy drink market, driven by consumer demand for healthier and more functional beverages. Companies are focusing on reduced sugar, natural ingredients, and functional benefits such as added vitamins and electrolytes. The launch of plant-based options and products focused on specific consumer needs (e.g., enhanced focus or improved athletic performance) are examples of this innovation. These new products are often accompanied by improved packaging, sustainability initiatives, and targeted marketing campaigns.
Propelling Factors for UK Energy Drink Industry Growth
The UK energy drink market’s growth is fueled by several interconnected factors:
- Technological Advancements: Improved production processes, sustainable packaging, and enhanced product formulations.
- Economic Factors: Rising disposable incomes and increasing consumer spending on convenience products.
- Regulatory Influences: While regulations regarding sugar content and labeling are tightening, they also drive innovation and propel healthier options into the market.
Obstacles in the UK Energy Drink Industry Market
Despite its growth potential, the UK energy drink market faces several challenges:
- Regulatory Challenges: Stringent regulations on sugar content and marketing, particularly targeting younger consumers, impact marketing strategies and potentially limit product innovation.
- Supply Chain Disruptions: Global supply chain issues impact raw material sourcing, potentially leading to price increases and production delays.
- Competitive Pressures: Intense competition among established and emerging players.
Future Opportunities in UK Energy Drink Industry
The UK energy drink market presents exciting future opportunities:
- Expanding into niche markets: Focus on functional drinks tailored to specific consumer segments (e.g., athletes, gamers).
- Exploring new technologies: Using innovative ingredients and sustainable packaging materials.
- Leveraging e-commerce and targeted marketing: Reaching new customers and promoting differentiated products effectively.
Major Players in the UK Energy Drink Industry Ecosystem
- TSI Consumer Goods GmbH
- PepsiCo Inc
- Max Muscle Nutrition
- Suntory Holdings Limited
- Red Bull GmbH
- The Coca-Cola Company
- Nestle SA
- Global Trade Holdings Co Ltd
- Monster Energy Company
- GlaxoSmithKline PLC
Key Developments in UK Energy Drink Industry Industry
- September 2022: Virtue Clean Energy launches a zero-sugar, zero-calorie energy drink in the UK.
- June 2022: Tenzing launches two new plant-based energy shots.
- March 2022: PerfectTed launches a range of canned matcha green tea energy drinks.
These product launches illustrate a growing trend toward healthier, more natural energy drink options.
Strategic UK Energy Drink Industry Market Forecast
The UK energy drink market is poised for continued growth, driven by innovation in product formulations, expanding distribution channels, and increasing consumer demand for healthier alternatives. The market's focus on natural ingredients, functional benefits, and sustainable packaging will further fuel this expansion. New product launches, strategic partnerships, and the ongoing appeal of convenience are all predicted to contribute to the market's future success. Despite challenges posed by regulation and competition, the overall outlook remains positive, projecting significant growth over the forecast period.
UK Energy Drink Industry Segmentation
-
1. Packaging Type
- 1.1. Can
- 1.2. PET Bottle
-
2. Product Type
- 2.1. Drinks
- 2.2. Shots
- 2.3. Mixers
-
3. Distribution Channel
- 3.1. Supermarkets/Hypermarkets
- 3.2. Convenience Stores
- 3.3. Specalist Stores
- 3.4. Online Retail Stores
- 3.5. Other Distribution Channels
UK Energy Drink Industry Segmentation By Geography
-
1. North America
- 1.1. United States
- 1.2. Canada
- 1.3. Mexico
-
2. South America
- 2.1. Brazil
- 2.2. Argentina
- 2.3. Rest of South America
-
3. Europe
- 3.1. United Kingdom
- 3.2. Germany
- 3.3. France
- 3.4. Italy
- 3.5. Spain
- 3.6. Russia
- 3.7. Benelux
- 3.8. Nordics
- 3.9. Rest of Europe
-
4. Middle East & Africa
- 4.1. Turkey
- 4.2. Israel
- 4.3. GCC
- 4.4. North Africa
- 4.5. South Africa
- 4.6. Rest of Middle East & Africa
-
5. Asia Pacific
- 5.1. China
- 5.2. India
- 5.3. Japan
- 5.4. South Korea
- 5.5. ASEAN
- 5.6. Oceania
- 5.7. Rest of Asia Pacific
UK Energy Drink Industry Regional Market Share
Geographic Coverage of UK Energy Drink Industry
UK Energy Drink Industry REPORT HIGHLIGHTS
| Aspects | Details |
|---|---|
| Study Period | 2020-2034 |
| Base Year | 2025 |
| Estimated Year | 2026 |
| Forecast Period | 2026-2034 |
| Historical Period | 2020-2025 |
| Growth Rate | CAGR of 5.67% from 2020-2034 |
| Segmentation |
|
Table of Contents
- 1. Introduction
- 1.1. Research Scope
- 1.2. Market Segmentation
- 1.3. Research Objective
- 1.4. Definitions and Assumptions
- 2. Executive Summary
- 2.1. Market Snapshot
- 3. Market Dynamics
- 3.1. Market Drivers
- 3.2. Market Restrains
- 3.3. Market Trends
- 3.4. Market Opportunities
- 4. Market Factor Analysis
- 4.1. Porters Five Forces
- 4.1.1. Bargaining Power of Suppliers
- 4.1.2. Bargaining Power of Buyers
- 4.1.3. Threat of New Entrants
- 4.1.4. Threat of Substitutes
- 4.1.5. Competitive Rivalry
- 4.2. PESTEL analysis
- 4.3. BCG Analysis
- 4.3.1. Stars (High Growth, High Market Share)
- 4.3.2. Cash Cows (Low Growth, High Market Share)
- 4.3.3. Question Mark (High Growth, Low Market Share)
- 4.3.4. Dogs (Low Growth, Low Market Share)
- 4.4. Ansoff Matrix Analysis
- 4.5. Supply Chain Analysis
- 4.6. Regulatory Landscape
- 4.7. Current Market Potential and Opportunity Assessment (TAM–SAM–SOM Framework)
- 4.8. DMV Analyst Note
- 4.1. Porters Five Forces
- 5. Market Analysis, Insights and Forecast 2021-2033
- 5.1. Market Analysis, Insights and Forecast - by Packaging Type
- 5.1.1. Can
- 5.1.2. PET Bottle
- 5.2. Market Analysis, Insights and Forecast - by Product Type
- 5.2.1. Drinks
- 5.2.2. Shots
- 5.2.3. Mixers
- 5.3. Market Analysis, Insights and Forecast - by Distribution Channel
- 5.3.1. Supermarkets/Hypermarkets
- 5.3.2. Convenience Stores
- 5.3.3. Specalist Stores
- 5.3.4. Online Retail Stores
- 5.3.5. Other Distribution Channels
- 5.4. Market Analysis, Insights and Forecast - by Region
- 5.4.1. North America
- 5.4.2. South America
- 5.4.3. Europe
- 5.4.4. Middle East & Africa
- 5.4.5. Asia Pacific
- 5.1. Market Analysis, Insights and Forecast - by Packaging Type
- 6. Global UK Energy Drink Industry Analysis, Insights and Forecast, 2021-2033
- 6.1. Market Analysis, Insights and Forecast - by Packaging Type
- 6.1.1. Can
- 6.1.2. PET Bottle
- 6.2. Market Analysis, Insights and Forecast - by Product Type
- 6.2.1. Drinks
- 6.2.2. Shots
- 6.2.3. Mixers
- 6.3. Market Analysis, Insights and Forecast - by Distribution Channel
- 6.3.1. Supermarkets/Hypermarkets
- 6.3.2. Convenience Stores
- 6.3.3. Specalist Stores
- 6.3.4. Online Retail Stores
- 6.3.5. Other Distribution Channels
- 6.1. Market Analysis, Insights and Forecast - by Packaging Type
- 7. North America UK Energy Drink Industry Analysis, Insights and Forecast, 2020-2032
- 7.1. Market Analysis, Insights and Forecast - by Packaging Type
- 7.1.1. Can
- 7.1.2. PET Bottle
- 7.2. Market Analysis, Insights and Forecast - by Product Type
- 7.2.1. Drinks
- 7.2.2. Shots
- 7.2.3. Mixers
- 7.3. Market Analysis, Insights and Forecast - by Distribution Channel
- 7.3.1. Supermarkets/Hypermarkets
- 7.3.2. Convenience Stores
- 7.3.3. Specalist Stores
- 7.3.4. Online Retail Stores
- 7.3.5. Other Distribution Channels
- 7.1. Market Analysis, Insights and Forecast - by Packaging Type
- 8. South America UK Energy Drink Industry Analysis, Insights and Forecast, 2020-2032
- 8.1. Market Analysis, Insights and Forecast - by Packaging Type
- 8.1.1. Can
- 8.1.2. PET Bottle
- 8.2. Market Analysis, Insights and Forecast - by Product Type
- 8.2.1. Drinks
- 8.2.2. Shots
- 8.2.3. Mixers
- 8.3. Market Analysis, Insights and Forecast - by Distribution Channel
- 8.3.1. Supermarkets/Hypermarkets
- 8.3.2. Convenience Stores
- 8.3.3. Specalist Stores
- 8.3.4. Online Retail Stores
- 8.3.5. Other Distribution Channels
- 8.1. Market Analysis, Insights and Forecast - by Packaging Type
- 9. Europe UK Energy Drink Industry Analysis, Insights and Forecast, 2020-2032
- 9.1. Market Analysis, Insights and Forecast - by Packaging Type
- 9.1.1. Can
- 9.1.2. PET Bottle
- 9.2. Market Analysis, Insights and Forecast - by Product Type
- 9.2.1. Drinks
- 9.2.2. Shots
- 9.2.3. Mixers
- 9.3. Market Analysis, Insights and Forecast - by Distribution Channel
- 9.3.1. Supermarkets/Hypermarkets
- 9.3.2. Convenience Stores
- 9.3.3. Specalist Stores
- 9.3.4. Online Retail Stores
- 9.3.5. Other Distribution Channels
- 9.1. Market Analysis, Insights and Forecast - by Packaging Type
- 10. Middle East & Africa UK Energy Drink Industry Analysis, Insights and Forecast, 2020-2032
- 10.1. Market Analysis, Insights and Forecast - by Packaging Type
- 10.1.1. Can
- 10.1.2. PET Bottle
- 10.2. Market Analysis, Insights and Forecast - by Product Type
- 10.2.1. Drinks
- 10.2.2. Shots
- 10.2.3. Mixers
- 10.3. Market Analysis, Insights and Forecast - by Distribution Channel
- 10.3.1. Supermarkets/Hypermarkets
- 10.3.2. Convenience Stores
- 10.3.3. Specalist Stores
- 10.3.4. Online Retail Stores
- 10.3.5. Other Distribution Channels
- 10.1. Market Analysis, Insights and Forecast - by Packaging Type
- 11. Asia Pacific UK Energy Drink Industry Analysis, Insights and Forecast, 2020-2032
- 11.1. Market Analysis, Insights and Forecast - by Packaging Type
- 11.1.1. Can
- 11.1.2. PET Bottle
- 11.2. Market Analysis, Insights and Forecast - by Product Type
- 11.2.1. Drinks
- 11.2.2. Shots
- 11.2.3. Mixers
- 11.3. Market Analysis, Insights and Forecast - by Distribution Channel
- 11.3.1. Supermarkets/Hypermarkets
- 11.3.2. Convenience Stores
- 11.3.3. Specalist Stores
- 11.3.4. Online Retail Stores
- 11.3.5. Other Distribution Channels
- 11.1. Market Analysis, Insights and Forecast - by Packaging Type
- 12. Competitive Analysis
- 12.1. Company Profiles
- 12.1.1 TSI Consumer Goods GmbH
- 12.1.1.1. Company Overview
- 12.1.1.2. Products
- 12.1.1.3. Company Financials
- 12.1.1.4. SWOT Analysis
- 12.1.2 PepsiCo Inc
- 12.1.2.1. Company Overview
- 12.1.2.2. Products
- 12.1.2.3. Company Financials
- 12.1.2.4. SWOT Analysis
- 12.1.3 Max Muscle Nutrition
- 12.1.3.1. Company Overview
- 12.1.3.2. Products
- 12.1.3.3. Company Financials
- 12.1.3.4. SWOT Analysis
- 12.1.4 Suntory Holdings Limited
- 12.1.4.1. Company Overview
- 12.1.4.2. Products
- 12.1.4.3. Company Financials
- 12.1.4.4. SWOT Analysis
- 12.1.5 Red Bull GmbH
- 12.1.5.1. Company Overview
- 12.1.5.2. Products
- 12.1.5.3. Company Financials
- 12.1.5.4. SWOT Analysis
- 12.1.6 The Coca-Cola Company
- 12.1.6.1. Company Overview
- 12.1.6.2. Products
- 12.1.6.3. Company Financials
- 12.1.6.4. SWOT Analysis
- 12.1.7 Nestle SA*List Not Exhaustive
- 12.1.7.1. Company Overview
- 12.1.7.2. Products
- 12.1.7.3. Company Financials
- 12.1.7.4. SWOT Analysis
- 12.1.8 Global Trade Holdings Co Ltd
- 12.1.8.1. Company Overview
- 12.1.8.2. Products
- 12.1.8.3. Company Financials
- 12.1.8.4. SWOT Analysis
- 12.1.9 Monster Energy Company
- 12.1.9.1. Company Overview
- 12.1.9.2. Products
- 12.1.9.3. Company Financials
- 12.1.9.4. SWOT Analysis
- 12.1.10 GlaxoSmithKline PLC
- 12.1.10.1. Company Overview
- 12.1.10.2. Products
- 12.1.10.3. Company Financials
- 12.1.10.4. SWOT Analysis
- 12.1.1 TSI Consumer Goods GmbH
- 12.2. Market Entropy
- 12.2.1 Company's Key Areas Served
- 12.2.2 Recent Developments
- 12.3. Company Market Share Analysis 2025
- 12.3.1 Top 5 Companies Market Share Analysis
- 12.3.2 Top 3 Companies Market Share Analysis
- 12.4. List of Potential Customers
- 13. Research Methodology
List of Figures
- Figure 1: Global UK Energy Drink Industry Revenue Breakdown (billion, %) by Region 2025 & 2033
- Figure 2: Global UK Energy Drink Industry Volume Breakdown (K Liters, %) by Region 2025 & 2033
- Figure 3: North America UK Energy Drink Industry Revenue (billion), by Packaging Type 2025 & 2033
- Figure 4: North America UK Energy Drink Industry Volume (K Liters), by Packaging Type 2025 & 2033
- Figure 5: North America UK Energy Drink Industry Revenue Share (%), by Packaging Type 2025 & 2033
- Figure 6: North America UK Energy Drink Industry Volume Share (%), by Packaging Type 2025 & 2033
- Figure 7: North America UK Energy Drink Industry Revenue (billion), by Product Type 2025 & 2033
- Figure 8: North America UK Energy Drink Industry Volume (K Liters), by Product Type 2025 & 2033
- Figure 9: North America UK Energy Drink Industry Revenue Share (%), by Product Type 2025 & 2033
- Figure 10: North America UK Energy Drink Industry Volume Share (%), by Product Type 2025 & 2033
- Figure 11: North America UK Energy Drink Industry Revenue (billion), by Distribution Channel 2025 & 2033
- Figure 12: North America UK Energy Drink Industry Volume (K Liters), by Distribution Channel 2025 & 2033
- Figure 13: North America UK Energy Drink Industry Revenue Share (%), by Distribution Channel 2025 & 2033
- Figure 14: North America UK Energy Drink Industry Volume Share (%), by Distribution Channel 2025 & 2033
- Figure 15: North America UK Energy Drink Industry Revenue (billion), by Country 2025 & 2033
- Figure 16: North America UK Energy Drink Industry Volume (K Liters), by Country 2025 & 2033
- Figure 17: North America UK Energy Drink Industry Revenue Share (%), by Country 2025 & 2033
- Figure 18: North America UK Energy Drink Industry Volume Share (%), by Country 2025 & 2033
- Figure 19: South America UK Energy Drink Industry Revenue (billion), by Packaging Type 2025 & 2033
- Figure 20: South America UK Energy Drink Industry Volume (K Liters), by Packaging Type 2025 & 2033
- Figure 21: South America UK Energy Drink Industry Revenue Share (%), by Packaging Type 2025 & 2033
- Figure 22: South America UK Energy Drink Industry Volume Share (%), by Packaging Type 2025 & 2033
- Figure 23: South America UK Energy Drink Industry Revenue (billion), by Product Type 2025 & 2033
- Figure 24: South America UK Energy Drink Industry Volume (K Liters), by Product Type 2025 & 2033
- Figure 25: South America UK Energy Drink Industry Revenue Share (%), by Product Type 2025 & 2033
- Figure 26: South America UK Energy Drink Industry Volume Share (%), by Product Type 2025 & 2033
- Figure 27: South America UK Energy Drink Industry Revenue (billion), by Distribution Channel 2025 & 2033
- Figure 28: South America UK Energy Drink Industry Volume (K Liters), by Distribution Channel 2025 & 2033
- Figure 29: South America UK Energy Drink Industry Revenue Share (%), by Distribution Channel 2025 & 2033
- Figure 30: South America UK Energy Drink Industry Volume Share (%), by Distribution Channel 2025 & 2033
- Figure 31: South America UK Energy Drink Industry Revenue (billion), by Country 2025 & 2033
- Figure 32: South America UK Energy Drink Industry Volume (K Liters), by Country 2025 & 2033
- Figure 33: South America UK Energy Drink Industry Revenue Share (%), by Country 2025 & 2033
- Figure 34: South America UK Energy Drink Industry Volume Share (%), by Country 2025 & 2033
- Figure 35: Europe UK Energy Drink Industry Revenue (billion), by Packaging Type 2025 & 2033
- Figure 36: Europe UK Energy Drink Industry Volume (K Liters), by Packaging Type 2025 & 2033
- Figure 37: Europe UK Energy Drink Industry Revenue Share (%), by Packaging Type 2025 & 2033
- Figure 38: Europe UK Energy Drink Industry Volume Share (%), by Packaging Type 2025 & 2033
- Figure 39: Europe UK Energy Drink Industry Revenue (billion), by Product Type 2025 & 2033
- Figure 40: Europe UK Energy Drink Industry Volume (K Liters), by Product Type 2025 & 2033
- Figure 41: Europe UK Energy Drink Industry Revenue Share (%), by Product Type 2025 & 2033
- Figure 42: Europe UK Energy Drink Industry Volume Share (%), by Product Type 2025 & 2033
- Figure 43: Europe UK Energy Drink Industry Revenue (billion), by Distribution Channel 2025 & 2033
- Figure 44: Europe UK Energy Drink Industry Volume (K Liters), by Distribution Channel 2025 & 2033
- Figure 45: Europe UK Energy Drink Industry Revenue Share (%), by Distribution Channel 2025 & 2033
- Figure 46: Europe UK Energy Drink Industry Volume Share (%), by Distribution Channel 2025 & 2033
- Figure 47: Europe UK Energy Drink Industry Revenue (billion), by Country 2025 & 2033
- Figure 48: Europe UK Energy Drink Industry Volume (K Liters), by Country 2025 & 2033
- Figure 49: Europe UK Energy Drink Industry Revenue Share (%), by Country 2025 & 2033
- Figure 50: Europe UK Energy Drink Industry Volume Share (%), by Country 2025 & 2033
- Figure 51: Middle East & Africa UK Energy Drink Industry Revenue (billion), by Packaging Type 2025 & 2033
- Figure 52: Middle East & Africa UK Energy Drink Industry Volume (K Liters), by Packaging Type 2025 & 2033
- Figure 53: Middle East & Africa UK Energy Drink Industry Revenue Share (%), by Packaging Type 2025 & 2033
- Figure 54: Middle East & Africa UK Energy Drink Industry Volume Share (%), by Packaging Type 2025 & 2033
- Figure 55: Middle East & Africa UK Energy Drink Industry Revenue (billion), by Product Type 2025 & 2033
- Figure 56: Middle East & Africa UK Energy Drink Industry Volume (K Liters), by Product Type 2025 & 2033
- Figure 57: Middle East & Africa UK Energy Drink Industry Revenue Share (%), by Product Type 2025 & 2033
- Figure 58: Middle East & Africa UK Energy Drink Industry Volume Share (%), by Product Type 2025 & 2033
- Figure 59: Middle East & Africa UK Energy Drink Industry Revenue (billion), by Distribution Channel 2025 & 2033
- Figure 60: Middle East & Africa UK Energy Drink Industry Volume (K Liters), by Distribution Channel 2025 & 2033
- Figure 61: Middle East & Africa UK Energy Drink Industry Revenue Share (%), by Distribution Channel 2025 & 2033
- Figure 62: Middle East & Africa UK Energy Drink Industry Volume Share (%), by Distribution Channel 2025 & 2033
- Figure 63: Middle East & Africa UK Energy Drink Industry Revenue (billion), by Country 2025 & 2033
- Figure 64: Middle East & Africa UK Energy Drink Industry Volume (K Liters), by Country 2025 & 2033
- Figure 65: Middle East & Africa UK Energy Drink Industry Revenue Share (%), by Country 2025 & 2033
- Figure 66: Middle East & Africa UK Energy Drink Industry Volume Share (%), by Country 2025 & 2033
- Figure 67: Asia Pacific UK Energy Drink Industry Revenue (billion), by Packaging Type 2025 & 2033
- Figure 68: Asia Pacific UK Energy Drink Industry Volume (K Liters), by Packaging Type 2025 & 2033
- Figure 69: Asia Pacific UK Energy Drink Industry Revenue Share (%), by Packaging Type 2025 & 2033
- Figure 70: Asia Pacific UK Energy Drink Industry Volume Share (%), by Packaging Type 2025 & 2033
- Figure 71: Asia Pacific UK Energy Drink Industry Revenue (billion), by Product Type 2025 & 2033
- Figure 72: Asia Pacific UK Energy Drink Industry Volume (K Liters), by Product Type 2025 & 2033
- Figure 73: Asia Pacific UK Energy Drink Industry Revenue Share (%), by Product Type 2025 & 2033
- Figure 74: Asia Pacific UK Energy Drink Industry Volume Share (%), by Product Type 2025 & 2033
- Figure 75: Asia Pacific UK Energy Drink Industry Revenue (billion), by Distribution Channel 2025 & 2033
- Figure 76: Asia Pacific UK Energy Drink Industry Volume (K Liters), by Distribution Channel 2025 & 2033
- Figure 77: Asia Pacific UK Energy Drink Industry Revenue Share (%), by Distribution Channel 2025 & 2033
- Figure 78: Asia Pacific UK Energy Drink Industry Volume Share (%), by Distribution Channel 2025 & 2033
- Figure 79: Asia Pacific UK Energy Drink Industry Revenue (billion), by Country 2025 & 2033
- Figure 80: Asia Pacific UK Energy Drink Industry Volume (K Liters), by Country 2025 & 2033
- Figure 81: Asia Pacific UK Energy Drink Industry Revenue Share (%), by Country 2025 & 2033
- Figure 82: Asia Pacific UK Energy Drink Industry Volume Share (%), by Country 2025 & 2033
List of Tables
- Table 1: Global UK Energy Drink Industry Revenue billion Forecast, by Packaging Type 2020 & 2033
- Table 2: Global UK Energy Drink Industry Volume K Liters Forecast, by Packaging Type 2020 & 2033
- Table 3: Global UK Energy Drink Industry Revenue billion Forecast, by Product Type 2020 & 2033
- Table 4: Global UK Energy Drink Industry Volume K Liters Forecast, by Product Type 2020 & 2033
- Table 5: Global UK Energy Drink Industry Revenue billion Forecast, by Distribution Channel 2020 & 2033
- Table 6: Global UK Energy Drink Industry Volume K Liters Forecast, by Distribution Channel 2020 & 2033
- Table 7: Global UK Energy Drink Industry Revenue billion Forecast, by Region 2020 & 2033
- Table 8: Global UK Energy Drink Industry Volume K Liters Forecast, by Region 2020 & 2033
- Table 9: Global UK Energy Drink Industry Revenue billion Forecast, by Packaging Type 2020 & 2033
- Table 10: Global UK Energy Drink Industry Volume K Liters Forecast, by Packaging Type 2020 & 2033
- Table 11: Global UK Energy Drink Industry Revenue billion Forecast, by Product Type 2020 & 2033
- Table 12: Global UK Energy Drink Industry Volume K Liters Forecast, by Product Type 2020 & 2033
- Table 13: Global UK Energy Drink Industry Revenue billion Forecast, by Distribution Channel 2020 & 2033
- Table 14: Global UK Energy Drink Industry Volume K Liters Forecast, by Distribution Channel 2020 & 2033
- Table 15: Global UK Energy Drink Industry Revenue billion Forecast, by Country 2020 & 2033
- Table 16: Global UK Energy Drink Industry Volume K Liters Forecast, by Country 2020 & 2033
- Table 17: United States UK Energy Drink Industry Revenue (billion) Forecast, by Application 2020 & 2033
- Table 18: United States UK Energy Drink Industry Volume (K Liters) Forecast, by Application 2020 & 2033
- Table 19: Canada UK Energy Drink Industry Revenue (billion) Forecast, by Application 2020 & 2033
- Table 20: Canada UK Energy Drink Industry Volume (K Liters) Forecast, by Application 2020 & 2033
- Table 21: Mexico UK Energy Drink Industry Revenue (billion) Forecast, by Application 2020 & 2033
- Table 22: Mexico UK Energy Drink Industry Volume (K Liters) Forecast, by Application 2020 & 2033
- Table 23: Global UK Energy Drink Industry Revenue billion Forecast, by Packaging Type 2020 & 2033
- Table 24: Global UK Energy Drink Industry Volume K Liters Forecast, by Packaging Type 2020 & 2033
- Table 25: Global UK Energy Drink Industry Revenue billion Forecast, by Product Type 2020 & 2033
- Table 26: Global UK Energy Drink Industry Volume K Liters Forecast, by Product Type 2020 & 2033
- Table 27: Global UK Energy Drink Industry Revenue billion Forecast, by Distribution Channel 2020 & 2033
- Table 28: Global UK Energy Drink Industry Volume K Liters Forecast, by Distribution Channel 2020 & 2033
- Table 29: Global UK Energy Drink Industry Revenue billion Forecast, by Country 2020 & 2033
- Table 30: Global UK Energy Drink Industry Volume K Liters Forecast, by Country 2020 & 2033
- Table 31: Brazil UK Energy Drink Industry Revenue (billion) Forecast, by Application 2020 & 2033
- Table 32: Brazil UK Energy Drink Industry Volume (K Liters) Forecast, by Application 2020 & 2033
- Table 33: Argentina UK Energy Drink Industry Revenue (billion) Forecast, by Application 2020 & 2033
- Table 34: Argentina UK Energy Drink Industry Volume (K Liters) Forecast, by Application 2020 & 2033
- Table 35: Rest of South America UK Energy Drink Industry Revenue (billion) Forecast, by Application 2020 & 2033
- Table 36: Rest of South America UK Energy Drink Industry Volume (K Liters) Forecast, by Application 2020 & 2033
- Table 37: Global UK Energy Drink Industry Revenue billion Forecast, by Packaging Type 2020 & 2033
- Table 38: Global UK Energy Drink Industry Volume K Liters Forecast, by Packaging Type 2020 & 2033
- Table 39: Global UK Energy Drink Industry Revenue billion Forecast, by Product Type 2020 & 2033
- Table 40: Global UK Energy Drink Industry Volume K Liters Forecast, by Product Type 2020 & 2033
- Table 41: Global UK Energy Drink Industry Revenue billion Forecast, by Distribution Channel 2020 & 2033
- Table 42: Global UK Energy Drink Industry Volume K Liters Forecast, by Distribution Channel 2020 & 2033
- Table 43: Global UK Energy Drink Industry Revenue billion Forecast, by Country 2020 & 2033
- Table 44: Global UK Energy Drink Industry Volume K Liters Forecast, by Country 2020 & 2033
- Table 45: United Kingdom UK Energy Drink Industry Revenue (billion) Forecast, by Application 2020 & 2033
- Table 46: United Kingdom UK Energy Drink Industry Volume (K Liters) Forecast, by Application 2020 & 2033
- Table 47: Germany UK Energy Drink Industry Revenue (billion) Forecast, by Application 2020 & 2033
- Table 48: Germany UK Energy Drink Industry Volume (K Liters) Forecast, by Application 2020 & 2033
- Table 49: France UK Energy Drink Industry Revenue (billion) Forecast, by Application 2020 & 2033
- Table 50: France UK Energy Drink Industry Volume (K Liters) Forecast, by Application 2020 & 2033
- Table 51: Italy UK Energy Drink Industry Revenue (billion) Forecast, by Application 2020 & 2033
- Table 52: Italy UK Energy Drink Industry Volume (K Liters) Forecast, by Application 2020 & 2033
- Table 53: Spain UK Energy Drink Industry Revenue (billion) Forecast, by Application 2020 & 2033
- Table 54: Spain UK Energy Drink Industry Volume (K Liters) Forecast, by Application 2020 & 2033
- Table 55: Russia UK Energy Drink Industry Revenue (billion) Forecast, by Application 2020 & 2033
- Table 56: Russia UK Energy Drink Industry Volume (K Liters) Forecast, by Application 2020 & 2033
- Table 57: Benelux UK Energy Drink Industry Revenue (billion) Forecast, by Application 2020 & 2033
- Table 58: Benelux UK Energy Drink Industry Volume (K Liters) Forecast, by Application 2020 & 2033
- Table 59: Nordics UK Energy Drink Industry Revenue (billion) Forecast, by Application 2020 & 2033
- Table 60: Nordics UK Energy Drink Industry Volume (K Liters) Forecast, by Application 2020 & 2033
- Table 61: Rest of Europe UK Energy Drink Industry Revenue (billion) Forecast, by Application 2020 & 2033
- Table 62: Rest of Europe UK Energy Drink Industry Volume (K Liters) Forecast, by Application 2020 & 2033
- Table 63: Global UK Energy Drink Industry Revenue billion Forecast, by Packaging Type 2020 & 2033
- Table 64: Global UK Energy Drink Industry Volume K Liters Forecast, by Packaging Type 2020 & 2033
- Table 65: Global UK Energy Drink Industry Revenue billion Forecast, by Product Type 2020 & 2033
- Table 66: Global UK Energy Drink Industry Volume K Liters Forecast, by Product Type 2020 & 2033
- Table 67: Global UK Energy Drink Industry Revenue billion Forecast, by Distribution Channel 2020 & 2033
- Table 68: Global UK Energy Drink Industry Volume K Liters Forecast, by Distribution Channel 2020 & 2033
- Table 69: Global UK Energy Drink Industry Revenue billion Forecast, by Country 2020 & 2033
- Table 70: Global UK Energy Drink Industry Volume K Liters Forecast, by Country 2020 & 2033
- Table 71: Turkey UK Energy Drink Industry Revenue (billion) Forecast, by Application 2020 & 2033
- Table 72: Turkey UK Energy Drink Industry Volume (K Liters) Forecast, by Application 2020 & 2033
- Table 73: Israel UK Energy Drink Industry Revenue (billion) Forecast, by Application 2020 & 2033
- Table 74: Israel UK Energy Drink Industry Volume (K Liters) Forecast, by Application 2020 & 2033
- Table 75: GCC UK Energy Drink Industry Revenue (billion) Forecast, by Application 2020 & 2033
- Table 76: GCC UK Energy Drink Industry Volume (K Liters) Forecast, by Application 2020 & 2033
- Table 77: North Africa UK Energy Drink Industry Revenue (billion) Forecast, by Application 2020 & 2033
- Table 78: North Africa UK Energy Drink Industry Volume (K Liters) Forecast, by Application 2020 & 2033
- Table 79: South Africa UK Energy Drink Industry Revenue (billion) Forecast, by Application 2020 & 2033
- Table 80: South Africa UK Energy Drink Industry Volume (K Liters) Forecast, by Application 2020 & 2033
- Table 81: Rest of Middle East & Africa UK Energy Drink Industry Revenue (billion) Forecast, by Application 2020 & 2033
- Table 82: Rest of Middle East & Africa UK Energy Drink Industry Volume (K Liters) Forecast, by Application 2020 & 2033
- Table 83: Global UK Energy Drink Industry Revenue billion Forecast, by Packaging Type 2020 & 2033
- Table 84: Global UK Energy Drink Industry Volume K Liters Forecast, by Packaging Type 2020 & 2033
- Table 85: Global UK Energy Drink Industry Revenue billion Forecast, by Product Type 2020 & 2033
- Table 86: Global UK Energy Drink Industry Volume K Liters Forecast, by Product Type 2020 & 2033
- Table 87: Global UK Energy Drink Industry Revenue billion Forecast, by Distribution Channel 2020 & 2033
- Table 88: Global UK Energy Drink Industry Volume K Liters Forecast, by Distribution Channel 2020 & 2033
- Table 89: Global UK Energy Drink Industry Revenue billion Forecast, by Country 2020 & 2033
- Table 90: Global UK Energy Drink Industry Volume K Liters Forecast, by Country 2020 & 2033
- Table 91: China UK Energy Drink Industry Revenue (billion) Forecast, by Application 2020 & 2033
- Table 92: China UK Energy Drink Industry Volume (K Liters) Forecast, by Application 2020 & 2033
- Table 93: India UK Energy Drink Industry Revenue (billion) Forecast, by Application 2020 & 2033
- Table 94: India UK Energy Drink Industry Volume (K Liters) Forecast, by Application 2020 & 2033
- Table 95: Japan UK Energy Drink Industry Revenue (billion) Forecast, by Application 2020 & 2033
- Table 96: Japan UK Energy Drink Industry Volume (K Liters) Forecast, by Application 2020 & 2033
- Table 97: South Korea UK Energy Drink Industry Revenue (billion) Forecast, by Application 2020 & 2033
- Table 98: South Korea UK Energy Drink Industry Volume (K Liters) Forecast, by Application 2020 & 2033
- Table 99: ASEAN UK Energy Drink Industry Revenue (billion) Forecast, by Application 2020 & 2033
- Table 100: ASEAN UK Energy Drink Industry Volume (K Liters) Forecast, by Application 2020 & 2033
- Table 101: Oceania UK Energy Drink Industry Revenue (billion) Forecast, by Application 2020 & 2033
- Table 102: Oceania UK Energy Drink Industry Volume (K Liters) Forecast, by Application 2020 & 2033
- Table 103: Rest of Asia Pacific UK Energy Drink Industry Revenue (billion) Forecast, by Application 2020 & 2033
- Table 104: Rest of Asia Pacific UK Energy Drink Industry Volume (K Liters) Forecast, by Application 2020 & 2033
Frequently Asked Questions
1. What is the projected Compound Annual Growth Rate (CAGR) of the UK Energy Drink Industry?
The projected CAGR is approximately 5.67%.
2. Which companies are prominent players in the UK Energy Drink Industry?
Key companies in the market include TSI Consumer Goods GmbH, PepsiCo Inc, Max Muscle Nutrition, Suntory Holdings Limited, Red Bull GmbH, The Coca-Cola Company, Nestle SA*List Not Exhaustive, Global Trade Holdings Co Ltd, Monster Energy Company, GlaxoSmithKline PLC.
3. What are the main segments of the UK Energy Drink Industry?
The market segments include Packaging Type, Product Type, Distribution Channel.
4. Can you provide details about the market size?
The market size is estimated to be USD 2.2 billion as of 2022.
5. What are some drivers contributing to market growth?
Rising Health & Wellness Trends; Strategic Initiatives By Key Players.
6. What are the notable trends driving market growth?
The Drinks Segment Dominates the Energy Drink Market.
7. Are there any restraints impacting market growth?
Cost Considerations Coupled With Availability Of Alternatives.
8. Can you provide examples of recent developments in the market?
In September 2022, Virtue Clean Energy, the brand that creates clean alternatives in the energy drink category, launched its newest product, Virtue Clean Energy in the United Kingdom. Virtue Drinks contain zero sugar & zero calories, made with all-natural ingredients. It has 80mg of 100% organic caffeine derived from green coffee beans, plus B vitamins (B3, B6, B7, B12).
9. What pricing options are available for accessing the report?
Pricing options include single-user, multi-user, and enterprise licenses priced at USD 3800, USD 4500, and USD 5800 respectively.
10. Is the market size provided in terms of value or volume?
The market size is provided in terms of value, measured in billion and volume, measured in K Liters.
11. Are there any specific market keywords associated with the report?
Yes, the market keyword associated with the report is "UK Energy Drink Industry," which aids in identifying and referencing the specific market segment covered.
12. How do I determine which pricing option suits my needs best?
The pricing options vary based on user requirements and access needs. Individual users may opt for single-user licenses, while businesses requiring broader access may choose multi-user or enterprise licenses for cost-effective access to the report.
13. Are there any additional resources or data provided in the UK Energy Drink Industry report?
While the report offers comprehensive insights, it's advisable to review the specific contents or supplementary materials provided to ascertain if additional resources or data are available.
14. How can I stay updated on further developments or reports in the UK Energy Drink Industry?
To stay informed about further developments, trends, and reports in the UK Energy Drink Industry, consider subscribing to industry newsletters, following relevant companies and organizations, or regularly checking reputable industry news sources and publications.
Methodology
Step 1 - Identification of Relevant Samples Size from Population Database


Step 2 - Approaches for Defining Global Market Size (Value, Volume* & Price*)

Note*: In applicable scenarios
Step 3 - Data Sources
Primary Research
- Web Analytics
- Survey Reports
- Research Institute
- Latest Research Reports
- Opinion Leaders
Secondary Research
- Annual Reports
- White Paper
- Latest Press Release
- Industry Association
- Paid Database
- Investor Presentations

Step 4 - Data Triangulation
Involves using different sources of information in order to increase the validity of a study
These sources are likely to be stakeholders in a program - participants, other researchers, program staff, other community members, and so on.
Then we put all data in single framework & apply various statistical tools to find out the dynamic on the market.
During the analysis stage, feedback from the stakeholder groups would be compared to determine areas of agreement as well as areas of divergence