

Key Insights
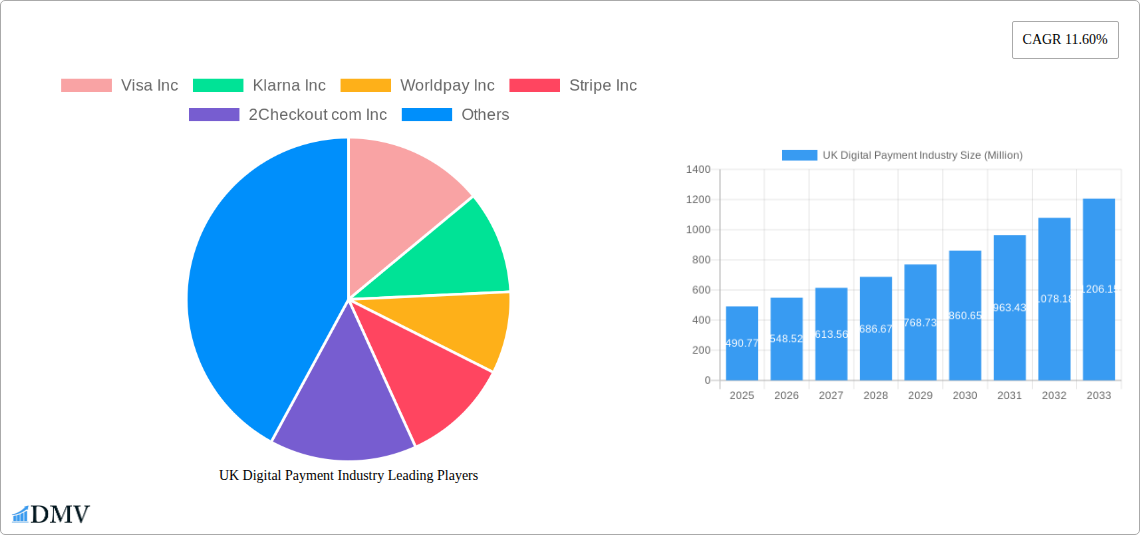
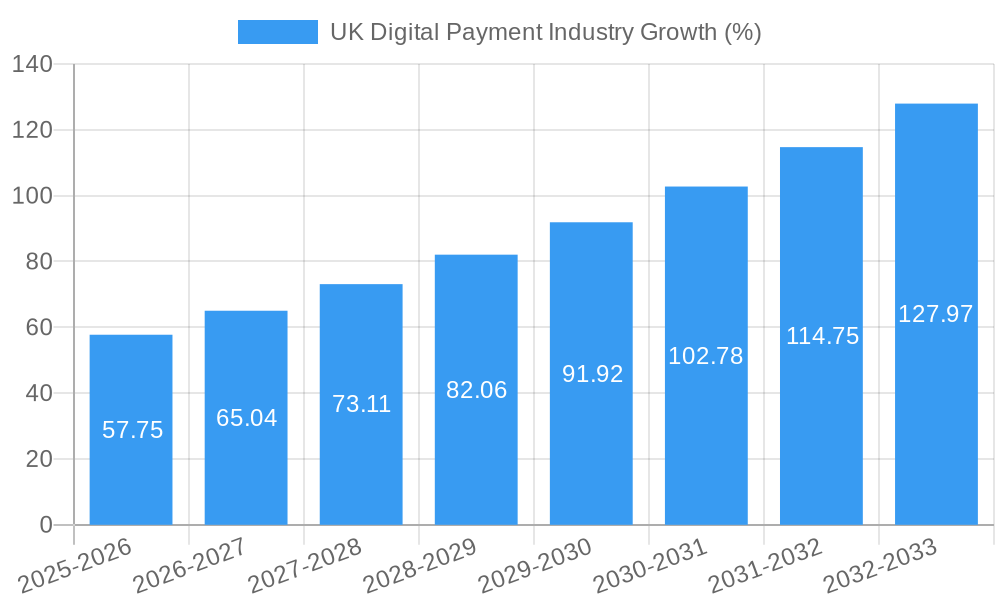
The UK digital payment industry is experiencing robust growth, projected to reach £490.77 million in 2025 and maintain a Compound Annual Growth Rate (CAGR) of 11.60% from 2025 to 2033. This expansion is fueled by several key factors. Increased smartphone penetration and internet usage across all demographics are driving consumer adoption of online and mobile payment methods. The rising popularity of e-commerce, particularly post-pandemic, has significantly boosted the demand for seamless and secure digital payment solutions. Furthermore, government initiatives promoting cashless transactions and the continuous innovation in payment technologies, such as contactless payments and mobile wallets, are accelerating market growth. The retail, entertainment, and hospitality sectors are major contributors to this growth, driven by the convenience and efficiency offered by digital payment systems for both businesses and consumers. While challenges such as security concerns and potential regulatory hurdles exist, the overall market outlook remains positive, driven by ongoing technological advancements and evolving consumer preferences.
The competitive landscape is highly dynamic, with a mix of established players like Visa, Mastercard, and PayPal, alongside rapidly growing fintech companies such as Klarna and Stripe. This competitive pressure fosters innovation and drives down transaction fees, benefiting both merchants and consumers. The industry is segmented by payment mode (point-of-sale versus online) and end-user industry (retail, entertainment, healthcare, hospitality, and others). The point-of-sale segment currently holds a significant share, reflecting the continued importance of physical retail, but online payments are expected to see substantial growth in the forecast period, driven by the increasing prevalence of online shopping and the growing use of mobile wallets. The diverse range of payment options and technological advancements are expected to continue to shape the future of the UK digital payments market.
UK Digital Payment Industry: A Comprehensive Market Report (2019-2033)
This insightful report provides a detailed analysis of the UK digital payment industry, offering a comprehensive overview of market trends, key players, and future growth prospects. With a study period spanning 2019-2033, a base year of 2025, and a forecast period of 2025-2033, this report is an essential resource for stakeholders seeking to understand and capitalize on the opportunities within this dynamic sector. The market is projected to reach £xx Million by 2033, experiencing significant growth driven by technological advancements and evolving consumer preferences.
UK Digital Payment Industry Market Composition & Trends
The UK digital payment market is characterized by intense competition and rapid innovation. Market concentration is moderate, with several large players holding significant market share, alongside numerous smaller, specialized firms. Visa Inc, Mastercard Inc, and PayPal Payments Private Limited dominate the landscape, but agile fintech companies like Klarna Inc and Stripe Inc are rapidly gaining traction. The market is influenced by a dynamic regulatory landscape, including PSD2 and Open Banking initiatives, which are shaping payment innovation and security. Substitute products, such as cash and checks, are declining in usage, while the rise of Buy Now, Pay Later (BNPL) services signifies a notable shift in consumer preferences.
- Market Share Distribution (2024): Visa Inc (xx%), Mastercard Inc (xx%), PayPal (xx%), Others (xx%)
- M&A Activity (2019-2024): Total deal value exceeding £xx Million, reflecting consolidation and expansion efforts. Examples include [Insert specific examples of M&A activity if available, otherwise remove this bullet point].
- End-User Profiles: The market encompasses a diverse range of end-users, from individual consumers to large businesses across various sectors. The retail and e-commerce sectors represent significant portions of the market.
UK Digital Payment Industry Industry Evolution
The UK digital payment industry has witnessed exponential growth over the past five years, fueled by several key factors. The adoption of contactless payments has accelerated significantly, driven by technological advancements, improved security features, and increased consumer comfort levels. The rise of mobile payments via smartphones and smartwatches has further accelerated this growth, making transactions faster, easier, and more convenient. The COVID-19 pandemic spurred significant shifts toward online transactions, significantly boosting the e-commerce payment segment. Simultaneously, the rise of BNPL options and embedded finance are reshaping consumer behaviour and creating new opportunities for market players. The annual growth rate from 2019 to 2024 was approximately xx%, demonstrating strong expansion. Adoption rates for various digital payment methods show consistent upward trends, indicating an overall market maturation. Looking ahead, the industry will likely continue its high growth trajectory, driven by further technological innovations, regulatory developments, and evolving consumer needs.
Leading Regions, Countries, or Segments in UK Digital Payment Industry
By Mode of Payment: Point-of-sale (POS) payments remain the dominant segment, accounting for xx% of total transactions. The growth of online payments is also significant, driven by e-commerce expansion and increasing internet penetration. This segment accounts for xx% of the market.
By End-user Industry: The retail sector continues to lead, with a market share of xx%, followed by the e-commerce and hospitality sectors. Other industries, such as healthcare, entertainment, and others, also present substantial opportunities.
Key Drivers:
- High internet and smartphone penetration: Facilitating the adoption of mobile and online payment systems.
- Government initiatives: Promoting digital financial inclusion and supporting the fintech sector.
- Investment in payment infrastructure: Enhancing security, efficiency, and accessibility of digital payments.
The dominance of specific segments is shaped by the density of businesses in particular sectors, consumer behaviour (particularly in retail and e-commerce), and the availability of payment infrastructure. The growth of online payments is directly linked to the rise of e-commerce, and the government's push for a cashless society promotes the adoption of both online and point-of-sale digital payment methods.
UK Digital Payment Industry Product Innovations
The UK digital payment landscape is witnessing continuous innovation. New payment methods, such as BNPL services, mobile wallets, and biometric authentication, are transforming the user experience. Embedded finance and open banking initiatives are leading to greater integration of payments into other financial services, while the adoption of AI and machine learning enhances security, fraud prevention, and customer personalization. These innovations are driving efficiency, security and convenience, ultimately propelling market expansion.
Propelling Factors for UK Digital Payment Industry Growth
Technological advancements, particularly in mobile and contactless payment technologies, are significant drivers of growth. The increasing preference for digital transactions among consumers coupled with government incentives promoting digital financial inclusion accelerate adoption. A supportive regulatory environment, such as the Open Banking initiative, fosters innovation and competition, further propelling market expansion.
Obstacles in the UK Digital Payment Industry Market
The UK digital payment industry faces various challenges, including the need for robust cybersecurity measures to mitigate fraud risk, as well as potential regulatory hurdles associated with new payment methods and data privacy. Maintaining consumer trust and overcoming potential supply chain disruptions are also crucial considerations. Finally, intense competition and the need for continuous innovation present significant ongoing obstacles.
Future Opportunities in UK Digital Payment Industry
Emerging opportunities include the expansion of BNPL services, the integration of blockchain technology for secure and transparent transactions, and the growth of embedded finance solutions. The increasing adoption of AI and machine learning to enhance personalization and security also presents significant opportunities. Additionally, new markets within specific industry sectors remain ripe for expansion.
Major Players in the UK Digital Payment Industry Ecosystem
- Visa Inc
- Klarna Inc
- Worldpay Inc
- Stripe Inc
- 2Checkout.com Inc
- PayPoint plc
- Amazon Payments Inc
- SumUp Inc
- PayPal Payments Private Limited
- Mastercard Inc
Key Developments in UK Digital Payment Industry Industry
- November 2023: Square launched Tap to Pay on iPhone in the UK, expanding its contactless payment options and eliminating the need for additional hardware.
- February 2023: ECOMMPAY launched a BNPL solution tailored for UK travel companies, despite growing calls for stricter regulation in the BNPL sector.
Strategic UK Digital Payment Industry Market Forecast
The UK digital payment industry is poised for sustained growth, driven by technological innovation and evolving consumer behavior. The increasing adoption of mobile payments, the expansion of BNPL options, and the integration of new technologies such as AI and blockchain will create significant market opportunities. Continuous innovation and regulatory adaptation will be key factors in shaping the future of this dynamic sector, with forecasts suggesting substantial revenue growth over the coming years.
UK Digital Payment Industry Segmentation
-
1. Mode of Payment
-
1.1. Point of Sale
- 1.1.1. Card Pay
- 1.1.2. Digital Wallet (includes Mobile Wallets)
- 1.1.3. Cash
- 1.1.4. Others
-
1.2. Online Sale
- 1.2.1. Others (
-
1.1. Point of Sale
-
2. End-user Industry
- 2.1. Retail
- 2.2. Entertainment
- 2.3. Healthcare
- 2.4. Hospitality
- 2.5. Other End-user Industries
UK Digital Payment Industry Segmentation By Geography
-
1. North America
- 1.1. United States
- 1.2. Canada
- 1.3. Mexico
-
2. South America
- 2.1. Brazil
- 2.2. Argentina
- 2.3. Rest of South America
-
3. Europe
- 3.1. United Kingdom
- 3.2. Germany
- 3.3. France
- 3.4. Italy
- 3.5. Spain
- 3.6. Russia
- 3.7. Benelux
- 3.8. Nordics
- 3.9. Rest of Europe
-
4. Middle East & Africa
- 4.1. Turkey
- 4.2. Israel
- 4.3. GCC
- 4.4. North Africa
- 4.5. South Africa
- 4.6. Rest of Middle East & Africa
-
5. Asia Pacific
- 5.1. China
- 5.2. India
- 5.3. Japan
- 5.4. South Korea
- 5.5. ASEAN
- 5.6. Oceania
- 5.7. Rest of Asia Pacific
UK Digital Payment Industry REPORT HIGHLIGHTS
| Aspects | Details |
|---|---|
| Study Period | 2019-2033 |
| Base Year | 2024 |
| Estimated Year | 2025 |
| Forecast Period | 2025-2033 |
| Historical Period | 2019-2024 |
| Growth Rate | CAGR of 11.60% from 2019-2033 |
| Segmentation |
|
Table of Contents
- 1. Introduction
- 1.1. Research Scope
- 1.2. Market Segmentation
- 1.3. Research Methodology
- 1.4. Definitions and Assumptions
- 2. Executive Summary
- 2.1. Introduction
- 3. Market Dynamics
- 3.1. Introduction
- 3.2. Market Drivers
- 3.2.1 High Proliferation of E-commerce
- 3.2.2 including the rise of m-commerce and cross-border e-commerce supported by the increase in purchasing power; Enablement Programs by Key Retailers and Government encouraging digitization of the market; Growth of Real-time Payments
- 3.2.3 especially Buy Now Pay Later in the country
- 3.3. Market Restrains
- 3.3.1. ; Stringent Regulations in the Payments Industry
- 3.4. Market Trends
- 3.4.1. Card Payments to Witness Significant Growth
- 4. Market Factor Analysis
- 4.1. Porters Five Forces
- 4.2. Supply/Value Chain
- 4.3. PESTEL analysis
- 4.4. Market Entropy
- 4.5. Patent/Trademark Analysis
- 5. Global UK Digital Payment Industry Analysis, Insights and Forecast, 2019-2031
- 5.1. Market Analysis, Insights and Forecast - by Mode of Payment
- 5.1.1. Point of Sale
- 5.1.1.1. Card Pay
- 5.1.1.2. Digital Wallet (includes Mobile Wallets)
- 5.1.1.3. Cash
- 5.1.1.4. Others
- 5.1.2. Online Sale
- 5.1.2.1. Others (
- 5.1.1. Point of Sale
- 5.2. Market Analysis, Insights and Forecast - by End-user Industry
- 5.2.1. Retail
- 5.2.2. Entertainment
- 5.2.3. Healthcare
- 5.2.4. Hospitality
- 5.2.5. Other End-user Industries
- 5.3. Market Analysis, Insights and Forecast - by Region
- 5.3.1. North America
- 5.3.2. South America
- 5.3.3. Europe
- 5.3.4. Middle East & Africa
- 5.3.5. Asia Pacific
- 5.1. Market Analysis, Insights and Forecast - by Mode of Payment
- 6. North America UK Digital Payment Industry Analysis, Insights and Forecast, 2019-2031
- 6.1. Market Analysis, Insights and Forecast - by Mode of Payment
- 6.1.1. Point of Sale
- 6.1.1.1. Card Pay
- 6.1.1.2. Digital Wallet (includes Mobile Wallets)
- 6.1.1.3. Cash
- 6.1.1.4. Others
- 6.1.2. Online Sale
- 6.1.2.1. Others (
- 6.1.1. Point of Sale
- 6.2. Market Analysis, Insights and Forecast - by End-user Industry
- 6.2.1. Retail
- 6.2.2. Entertainment
- 6.2.3. Healthcare
- 6.2.4. Hospitality
- 6.2.5. Other End-user Industries
- 6.1. Market Analysis, Insights and Forecast - by Mode of Payment
- 7. South America UK Digital Payment Industry Analysis, Insights and Forecast, 2019-2031
- 7.1. Market Analysis, Insights and Forecast - by Mode of Payment
- 7.1.1. Point of Sale
- 7.1.1.1. Card Pay
- 7.1.1.2. Digital Wallet (includes Mobile Wallets)
- 7.1.1.3. Cash
- 7.1.1.4. Others
- 7.1.2. Online Sale
- 7.1.2.1. Others (
- 7.1.1. Point of Sale
- 7.2. Market Analysis, Insights and Forecast - by End-user Industry
- 7.2.1. Retail
- 7.2.2. Entertainment
- 7.2.3. Healthcare
- 7.2.4. Hospitality
- 7.2.5. Other End-user Industries
- 7.1. Market Analysis, Insights and Forecast - by Mode of Payment
- 8. Europe UK Digital Payment Industry Analysis, Insights and Forecast, 2019-2031
- 8.1. Market Analysis, Insights and Forecast - by Mode of Payment
- 8.1.1. Point of Sale
- 8.1.1.1. Card Pay
- 8.1.1.2. Digital Wallet (includes Mobile Wallets)
- 8.1.1.3. Cash
- 8.1.1.4. Others
- 8.1.2. Online Sale
- 8.1.2.1. Others (
- 8.1.1. Point of Sale
- 8.2. Market Analysis, Insights and Forecast - by End-user Industry
- 8.2.1. Retail
- 8.2.2. Entertainment
- 8.2.3. Healthcare
- 8.2.4. Hospitality
- 8.2.5. Other End-user Industries
- 8.1. Market Analysis, Insights and Forecast - by Mode of Payment
- 9. Middle East & Africa UK Digital Payment Industry Analysis, Insights and Forecast, 2019-2031
- 9.1. Market Analysis, Insights and Forecast - by Mode of Payment
- 9.1.1. Point of Sale
- 9.1.1.1. Card Pay
- 9.1.1.2. Digital Wallet (includes Mobile Wallets)
- 9.1.1.3. Cash
- 9.1.1.4. Others
- 9.1.2. Online Sale
- 9.1.2.1. Others (
- 9.1.1. Point of Sale
- 9.2. Market Analysis, Insights and Forecast - by End-user Industry
- 9.2.1. Retail
- 9.2.2. Entertainment
- 9.2.3. Healthcare
- 9.2.4. Hospitality
- 9.2.5. Other End-user Industries
- 9.1. Market Analysis, Insights and Forecast - by Mode of Payment
- 10. Asia Pacific UK Digital Payment Industry Analysis, Insights and Forecast, 2019-2031
- 10.1. Market Analysis, Insights and Forecast - by Mode of Payment
- 10.1.1. Point of Sale
- 10.1.1.1. Card Pay
- 10.1.1.2. Digital Wallet (includes Mobile Wallets)
- 10.1.1.3. Cash
- 10.1.1.4. Others
- 10.1.2. Online Sale
- 10.1.2.1. Others (
- 10.1.1. Point of Sale
- 10.2. Market Analysis, Insights and Forecast - by End-user Industry
- 10.2.1. Retail
- 10.2.2. Entertainment
- 10.2.3. Healthcare
- 10.2.4. Hospitality
- 10.2.5. Other End-user Industries
- 10.1. Market Analysis, Insights and Forecast - by Mode of Payment
- 11. England UK Digital Payment Industry Analysis, Insights and Forecast, 2019-2031
- 12. Wales UK Digital Payment Industry Analysis, Insights and Forecast, 2019-2031
- 13. Scotland UK Digital Payment Industry Analysis, Insights and Forecast, 2019-2031
- 14. Northern UK Digital Payment Industry Analysis, Insights and Forecast, 2019-2031
- 15. Ireland UK Digital Payment Industry Analysis, Insights and Forecast, 2019-2031
- 16. Competitive Analysis
- 16.1. Global Market Share Analysis 2024
- 16.2. Company Profiles
- 16.2.1 Visa Inc
- 16.2.1.1. Overview
- 16.2.1.2. Products
- 16.2.1.3. SWOT Analysis
- 16.2.1.4. Recent Developments
- 16.2.1.5. Financials (Based on Availability)
- 16.2.2 Klarna Inc
- 16.2.2.1. Overview
- 16.2.2.2. Products
- 16.2.2.3. SWOT Analysis
- 16.2.2.4. Recent Developments
- 16.2.2.5. Financials (Based on Availability)
- 16.2.3 Worldpay Inc
- 16.2.3.1. Overview
- 16.2.3.2. Products
- 16.2.3.3. SWOT Analysis
- 16.2.3.4. Recent Developments
- 16.2.3.5. Financials (Based on Availability)
- 16.2.4 Stripe Inc
- 16.2.4.1. Overview
- 16.2.4.2. Products
- 16.2.4.3. SWOT Analysis
- 16.2.4.4. Recent Developments
- 16.2.4.5. Financials (Based on Availability)
- 16.2.5 2Checkout com Inc
- 16.2.5.1. Overview
- 16.2.5.2. Products
- 16.2.5.3. SWOT Analysis
- 16.2.5.4. Recent Developments
- 16.2.5.5. Financials (Based on Availability)
- 16.2.6 PayPoint plc
- 16.2.6.1. Overview
- 16.2.6.2. Products
- 16.2.6.3. SWOT Analysis
- 16.2.6.4. Recent Developments
- 16.2.6.5. Financials (Based on Availability)
- 16.2.7 Amazon Payments Inc
- 16.2.7.1. Overview
- 16.2.7.2. Products
- 16.2.7.3. SWOT Analysis
- 16.2.7.4. Recent Developments
- 16.2.7.5. Financials (Based on Availability)
- 16.2.8 SumUp Inc *List Not Exhaustive
- 16.2.8.1. Overview
- 16.2.8.2. Products
- 16.2.8.3. SWOT Analysis
- 16.2.8.4. Recent Developments
- 16.2.8.5. Financials (Based on Availability)
- 16.2.9 PayPal Payments Private Limited
- 16.2.9.1. Overview
- 16.2.9.2. Products
- 16.2.9.3. SWOT Analysis
- 16.2.9.4. Recent Developments
- 16.2.9.5. Financials (Based on Availability)
- 16.2.10 Mastercard Inc
- 16.2.10.1. Overview
- 16.2.10.2. Products
- 16.2.10.3. SWOT Analysis
- 16.2.10.4. Recent Developments
- 16.2.10.5. Financials (Based on Availability)
- 16.2.1 Visa Inc
List of Figures
- Figure 1: Global UK Digital Payment Industry Revenue Breakdown (Million, %) by Region 2024 & 2032
- Figure 2: United kingdom Region UK Digital Payment Industry Revenue (Million), by Country 2024 & 2032
- Figure 3: United kingdom Region UK Digital Payment Industry Revenue Share (%), by Country 2024 & 2032
- Figure 4: North America UK Digital Payment Industry Revenue (Million), by Mode of Payment 2024 & 2032
- Figure 5: North America UK Digital Payment Industry Revenue Share (%), by Mode of Payment 2024 & 2032
- Figure 6: North America UK Digital Payment Industry Revenue (Million), by End-user Industry 2024 & 2032
- Figure 7: North America UK Digital Payment Industry Revenue Share (%), by End-user Industry 2024 & 2032
- Figure 8: North America UK Digital Payment Industry Revenue (Million), by Country 2024 & 2032
- Figure 9: North America UK Digital Payment Industry Revenue Share (%), by Country 2024 & 2032
- Figure 10: South America UK Digital Payment Industry Revenue (Million), by Mode of Payment 2024 & 2032
- Figure 11: South America UK Digital Payment Industry Revenue Share (%), by Mode of Payment 2024 & 2032
- Figure 12: South America UK Digital Payment Industry Revenue (Million), by End-user Industry 2024 & 2032
- Figure 13: South America UK Digital Payment Industry Revenue Share (%), by End-user Industry 2024 & 2032
- Figure 14: South America UK Digital Payment Industry Revenue (Million), by Country 2024 & 2032
- Figure 15: South America UK Digital Payment Industry Revenue Share (%), by Country 2024 & 2032
- Figure 16: Europe UK Digital Payment Industry Revenue (Million), by Mode of Payment 2024 & 2032
- Figure 17: Europe UK Digital Payment Industry Revenue Share (%), by Mode of Payment 2024 & 2032
- Figure 18: Europe UK Digital Payment Industry Revenue (Million), by End-user Industry 2024 & 2032
- Figure 19: Europe UK Digital Payment Industry Revenue Share (%), by End-user Industry 2024 & 2032
- Figure 20: Europe UK Digital Payment Industry Revenue (Million), by Country 2024 & 2032
- Figure 21: Europe UK Digital Payment Industry Revenue Share (%), by Country 2024 & 2032
- Figure 22: Middle East & Africa UK Digital Payment Industry Revenue (Million), by Mode of Payment 2024 & 2032
- Figure 23: Middle East & Africa UK Digital Payment Industry Revenue Share (%), by Mode of Payment 2024 & 2032
- Figure 24: Middle East & Africa UK Digital Payment Industry Revenue (Million), by End-user Industry 2024 & 2032
- Figure 25: Middle East & Africa UK Digital Payment Industry Revenue Share (%), by End-user Industry 2024 & 2032
- Figure 26: Middle East & Africa UK Digital Payment Industry Revenue (Million), by Country 2024 & 2032
- Figure 27: Middle East & Africa UK Digital Payment Industry Revenue Share (%), by Country 2024 & 2032
- Figure 28: Asia Pacific UK Digital Payment Industry Revenue (Million), by Mode of Payment 2024 & 2032
- Figure 29: Asia Pacific UK Digital Payment Industry Revenue Share (%), by Mode of Payment 2024 & 2032
- Figure 30: Asia Pacific UK Digital Payment Industry Revenue (Million), by End-user Industry 2024 & 2032
- Figure 31: Asia Pacific UK Digital Payment Industry Revenue Share (%), by End-user Industry 2024 & 2032
- Figure 32: Asia Pacific UK Digital Payment Industry Revenue (Million), by Country 2024 & 2032
- Figure 33: Asia Pacific UK Digital Payment Industry Revenue Share (%), by Country 2024 & 2032
List of Tables
- Table 1: Global UK Digital Payment Industry Revenue Million Forecast, by Region 2019 & 2032
- Table 2: Global UK Digital Payment Industry Revenue Million Forecast, by Mode of Payment 2019 & 2032
- Table 3: Global UK Digital Payment Industry Revenue Million Forecast, by End-user Industry 2019 & 2032
- Table 4: Global UK Digital Payment Industry Revenue Million Forecast, by Region 2019 & 2032
- Table 5: Global UK Digital Payment Industry Revenue Million Forecast, by Country 2019 & 2032
- Table 6: England UK Digital Payment Industry Revenue (Million) Forecast, by Application 2019 & 2032
- Table 7: Wales UK Digital Payment Industry Revenue (Million) Forecast, by Application 2019 & 2032
- Table 8: Scotland UK Digital Payment Industry Revenue (Million) Forecast, by Application 2019 & 2032
- Table 9: Northern UK Digital Payment Industry Revenue (Million) Forecast, by Application 2019 & 2032
- Table 10: Ireland UK Digital Payment Industry Revenue (Million) Forecast, by Application 2019 & 2032
- Table 11: Global UK Digital Payment Industry Revenue Million Forecast, by Mode of Payment 2019 & 2032
- Table 12: Global UK Digital Payment Industry Revenue Million Forecast, by End-user Industry 2019 & 2032
- Table 13: Global UK Digital Payment Industry Revenue Million Forecast, by Country 2019 & 2032
- Table 14: United States UK Digital Payment Industry Revenue (Million) Forecast, by Application 2019 & 2032
- Table 15: Canada UK Digital Payment Industry Revenue (Million) Forecast, by Application 2019 & 2032
- Table 16: Mexico UK Digital Payment Industry Revenue (Million) Forecast, by Application 2019 & 2032
- Table 17: Global UK Digital Payment Industry Revenue Million Forecast, by Mode of Payment 2019 & 2032
- Table 18: Global UK Digital Payment Industry Revenue Million Forecast, by End-user Industry 2019 & 2032
- Table 19: Global UK Digital Payment Industry Revenue Million Forecast, by Country 2019 & 2032
- Table 20: Brazil UK Digital Payment Industry Revenue (Million) Forecast, by Application 2019 & 2032
- Table 21: Argentina UK Digital Payment Industry Revenue (Million) Forecast, by Application 2019 & 2032
- Table 22: Rest of South America UK Digital Payment Industry Revenue (Million) Forecast, by Application 2019 & 2032
- Table 23: Global UK Digital Payment Industry Revenue Million Forecast, by Mode of Payment 2019 & 2032
- Table 24: Global UK Digital Payment Industry Revenue Million Forecast, by End-user Industry 2019 & 2032
- Table 25: Global UK Digital Payment Industry Revenue Million Forecast, by Country 2019 & 2032
- Table 26: United Kingdom UK Digital Payment Industry Revenue (Million) Forecast, by Application 2019 & 2032
- Table 27: Germany UK Digital Payment Industry Revenue (Million) Forecast, by Application 2019 & 2032
- Table 28: France UK Digital Payment Industry Revenue (Million) Forecast, by Application 2019 & 2032
- Table 29: Italy UK Digital Payment Industry Revenue (Million) Forecast, by Application 2019 & 2032
- Table 30: Spain UK Digital Payment Industry Revenue (Million) Forecast, by Application 2019 & 2032
- Table 31: Russia UK Digital Payment Industry Revenue (Million) Forecast, by Application 2019 & 2032
- Table 32: Benelux UK Digital Payment Industry Revenue (Million) Forecast, by Application 2019 & 2032
- Table 33: Nordics UK Digital Payment Industry Revenue (Million) Forecast, by Application 2019 & 2032
- Table 34: Rest of Europe UK Digital Payment Industry Revenue (Million) Forecast, by Application 2019 & 2032
- Table 35: Global UK Digital Payment Industry Revenue Million Forecast, by Mode of Payment 2019 & 2032
- Table 36: Global UK Digital Payment Industry Revenue Million Forecast, by End-user Industry 2019 & 2032
- Table 37: Global UK Digital Payment Industry Revenue Million Forecast, by Country 2019 & 2032
- Table 38: Turkey UK Digital Payment Industry Revenue (Million) Forecast, by Application 2019 & 2032
- Table 39: Israel UK Digital Payment Industry Revenue (Million) Forecast, by Application 2019 & 2032
- Table 40: GCC UK Digital Payment Industry Revenue (Million) Forecast, by Application 2019 & 2032
- Table 41: North Africa UK Digital Payment Industry Revenue (Million) Forecast, by Application 2019 & 2032
- Table 42: South Africa UK Digital Payment Industry Revenue (Million) Forecast, by Application 2019 & 2032
- Table 43: Rest of Middle East & Africa UK Digital Payment Industry Revenue (Million) Forecast, by Application 2019 & 2032
- Table 44: Global UK Digital Payment Industry Revenue Million Forecast, by Mode of Payment 2019 & 2032
- Table 45: Global UK Digital Payment Industry Revenue Million Forecast, by End-user Industry 2019 & 2032
- Table 46: Global UK Digital Payment Industry Revenue Million Forecast, by Country 2019 & 2032
- Table 47: China UK Digital Payment Industry Revenue (Million) Forecast, by Application 2019 & 2032
- Table 48: India UK Digital Payment Industry Revenue (Million) Forecast, by Application 2019 & 2032
- Table 49: Japan UK Digital Payment Industry Revenue (Million) Forecast, by Application 2019 & 2032
- Table 50: South Korea UK Digital Payment Industry Revenue (Million) Forecast, by Application 2019 & 2032
- Table 51: ASEAN UK Digital Payment Industry Revenue (Million) Forecast, by Application 2019 & 2032
- Table 52: Oceania UK Digital Payment Industry Revenue (Million) Forecast, by Application 2019 & 2032
- Table 53: Rest of Asia Pacific UK Digital Payment Industry Revenue (Million) Forecast, by Application 2019 & 2032
Frequently Asked Questions
1. What is the projected Compound Annual Growth Rate (CAGR) of the UK Digital Payment Industry?
The projected CAGR is approximately 11.60%.
2. Which companies are prominent players in the UK Digital Payment Industry?
Key companies in the market include Visa Inc, Klarna Inc, Worldpay Inc, Stripe Inc, 2Checkout com Inc, PayPoint plc, Amazon Payments Inc, SumUp Inc *List Not Exhaustive, PayPal Payments Private Limited, Mastercard Inc.
3. What are the main segments of the UK Digital Payment Industry?
The market segments include Mode of Payment, End-user Industry.
4. Can you provide details about the market size?
The market size is estimated to be USD 490.77 Million as of 2022.
5. What are some drivers contributing to market growth?
High Proliferation of E-commerce. including the rise of m-commerce and cross-border e-commerce supported by the increase in purchasing power; Enablement Programs by Key Retailers and Government encouraging digitization of the market; Growth of Real-time Payments. especially Buy Now Pay Later in the country.
6. What are the notable trends driving market growth?
Card Payments to Witness Significant Growth.
7. Are there any restraints impacting market growth?
; Stringent Regulations in the Payments Industry.
8. Can you provide examples of recent developments in the market?
November 2023 - Square launched Tap to Pay on iPhone across the United Kingdom, making it the third market globally where the company will offer the technology to its sellers. Available within the Square for Retail, Square Point of Sale, and Square Appointments iOS apps, Tap to Pay on iPhone enables sellers of all sizes to accept contactless payments directly from their iPhone, without additional hardware required and at no extra cost.
9. What pricing options are available for accessing the report?
Pricing options include single-user, multi-user, and enterprise licenses priced at USD 3800, USD 4500, and USD 5800 respectively.
10. Is the market size provided in terms of value or volume?
The market size is provided in terms of value, measured in Million.
11. Are there any specific market keywords associated with the report?
Yes, the market keyword associated with the report is "UK Digital Payment Industry," which aids in identifying and referencing the specific market segment covered.
12. How do I determine which pricing option suits my needs best?
The pricing options vary based on user requirements and access needs. Individual users may opt for single-user licenses, while businesses requiring broader access may choose multi-user or enterprise licenses for cost-effective access to the report.
13. Are there any additional resources or data provided in the UK Digital Payment Industry report?
While the report offers comprehensive insights, it's advisable to review the specific contents or supplementary materials provided to ascertain if additional resources or data are available.
14. How can I stay updated on further developments or reports in the UK Digital Payment Industry?
To stay informed about further developments, trends, and reports in the UK Digital Payment Industry, consider subscribing to industry newsletters, following relevant companies and organizations, or regularly checking reputable industry news sources and publications.
Methodology
Step 1 - Identification of Relevant Samples Size from Population Database


Step 2 - Approaches for Defining Global Market Size (Value, Volume* & Price*)

Note*: In applicable scenarios
Step 3 - Data Sources
Primary Research
- Web Analytics
- Survey Reports
- Research Institute
- Latest Research Reports
- Opinion Leaders
Secondary Research
- Annual Reports
- White Paper
- Latest Press Release
- Industry Association
- Paid Database
- Investor Presentations

Step 4 - Data Triangulation
Involves using different sources of information in order to increase the validity of a study
These sources are likely to be stakeholders in a program - participants, other researchers, program staff, other community members, and so on.
Then we put all data in single framework & apply various statistical tools to find out the dynamic on the market.
During the analysis stage, feedback from the stakeholder groups would be compared to determine areas of agreement as well as areas of divergence
