

Key Insights
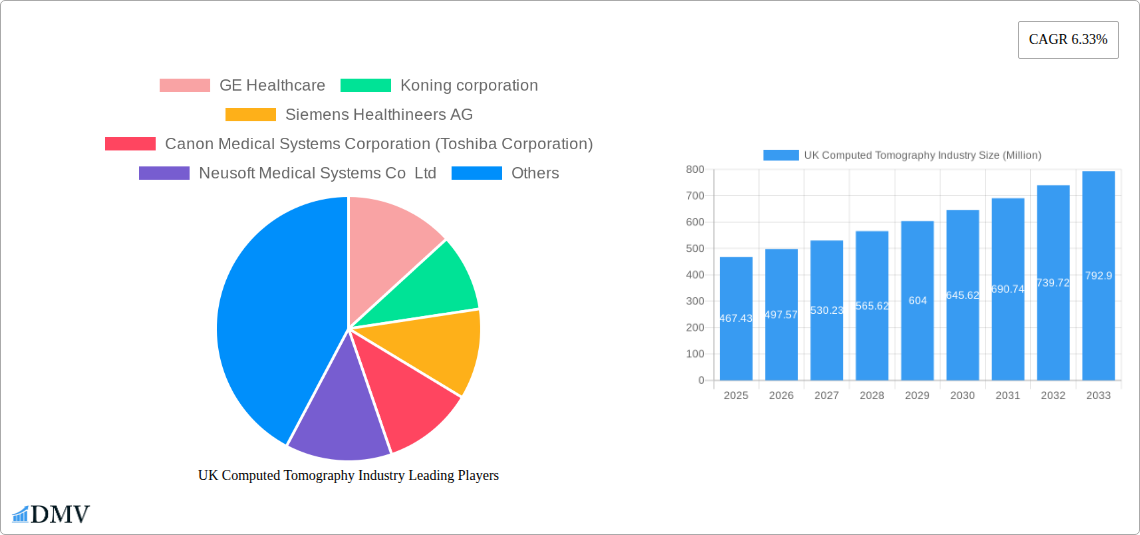
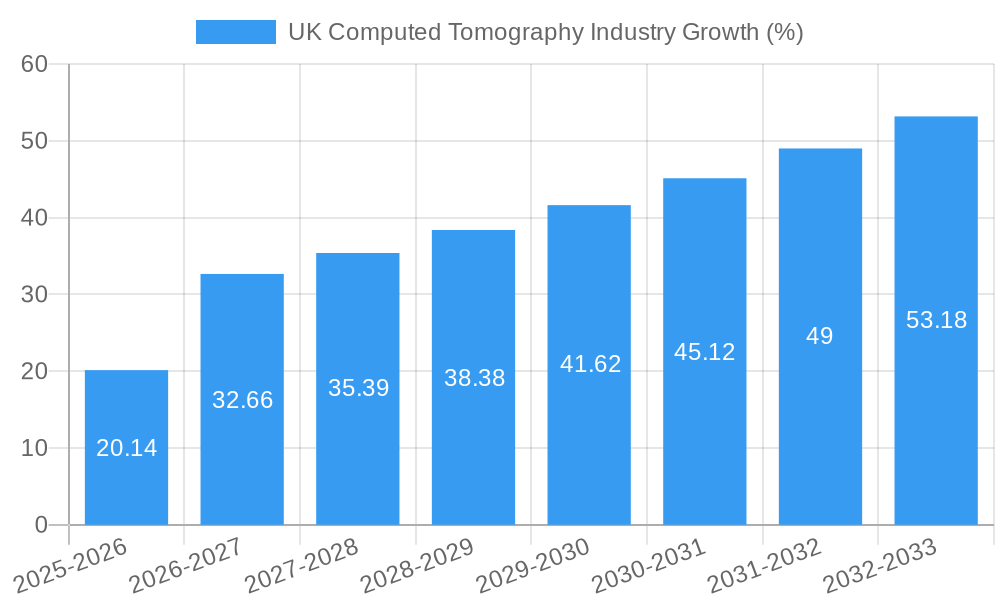
The UK computed tomography (CT) market, valued at approximately £467.43 million in 2025, is projected to experience robust growth, driven by a rising prevalence of chronic diseases necessitating advanced diagnostic imaging, technological advancements leading to improved image quality and faster scan times, and increasing government investments in healthcare infrastructure. The market's Compound Annual Growth Rate (CAGR) of 6.33% from 2025 to 2033 indicates a substantial expansion, with significant contributions anticipated from all segments. The high slice CT segment is likely to dominate due to its superior image resolution and diagnostic capabilities, though medium-slice systems maintain a considerable market share due to cost-effectiveness. Oncology, neurology, and cardiovascular applications are expected to be key drivers, reflecting the high incidence of related diseases in the UK. Hospitals constitute the largest end-user segment, although diagnostic centers are anticipated to witness increased adoption, fueled by growing demand for specialized imaging services. Competition within the market is intense, with established players like GE Healthcare, Siemens Healthineers AG, and Philips alongside emerging players continuously striving for market share through technological innovation and strategic partnerships.
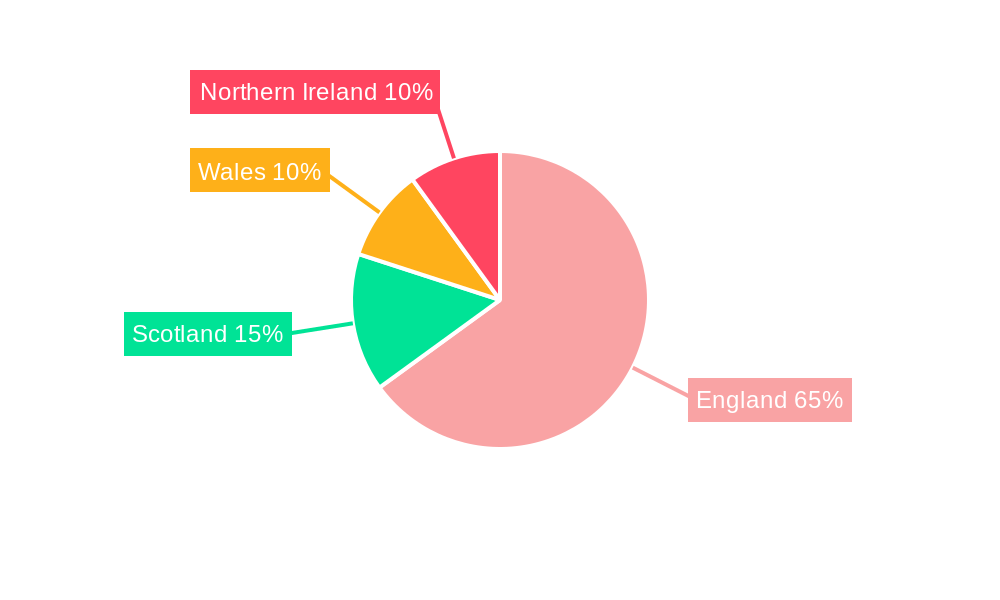
The geographic distribution of the market is concentrated in England, followed by Scotland, Wales, and Northern Ireland. Growth will likely be influenced by regional disparities in healthcare spending, population density, and the availability of skilled professionals. While factors such as stringent regulatory approvals and high equipment costs could pose challenges, the overall growth trajectory for the UK CT market remains positive, fueled by an aging population, increased healthcare awareness, and the ongoing adoption of advanced imaging technologies. The competitive landscape will continue to evolve, with an emphasis on offering comprehensive solutions that encompass not only hardware but also software, service contracts, and data analytics.
UK Computed Tomography (CT) Industry Report: 2019-2033
This comprehensive report provides a detailed analysis of the UK Computed Tomography (CT) industry, offering invaluable insights for stakeholders across the value chain. Covering the period 2019-2033, with a base year of 2025 and a forecast period of 2025-2033, this report meticulously examines market dynamics, technological advancements, and future growth potential. The UK CT market, valued at £xx Million in 2024, is poised for significant expansion, driven by factors such as increasing prevalence of chronic diseases and technological innovations.
UK Computed Tomography Industry Market Composition & Trends
This section delves into the competitive landscape of the UK CT industry, analyzing market concentration, innovation, regulations, and M&A activity. The market is moderately concentrated, with key players including GE Healthcare, Siemens Healthineers AG, and Canon Medical Systems Corporation holding significant market share. Precise market share distribution for 2024 is presented within the full report, showing that GE Healthcare holds approximately xx% market share, Siemens Healthineers AG xx%, and Canon Medical Systems Corporation xx%. The remaining market share is distributed among other players such as Koninklijke Philips NV, Neusoft Medical Systems Co Ltd, and Fujifilm Holdings Corporation.
Innovation is driven by the need for higher resolution imaging, faster scan times, and reduced radiation exposure. Stringent regulatory frameworks, primarily governed by the MHRA (Medicines and Healthcare products Regulatory Agency), ensure the safety and efficacy of CT scanners. Substitute products such as MRI and ultrasound exist, but CT remains the gold standard for many applications. M&A activity has been moderate, with deal values averaging £xx Million over the past five years (specific details and examples included within the full report).
- Market Concentration: Moderately concentrated with key players holding significant shares.
- Innovation Catalysts: Higher resolution, faster scan times, reduced radiation.
- Regulatory Landscape: Stringent regulations enforced by the MHRA.
- Substitute Products: MRI, Ultrasound.
- M&A Activity: Moderate activity with average deal values of £xx Million.
UK Computed Tomography Industry Industry Evolution
The UK CT industry has witnessed robust growth throughout the historical period (2019-2024), exhibiting a Compound Annual Growth Rate (CAGR) of xx%. This growth is attributed to several factors, including an aging population, rising prevalence of chronic diseases requiring CT scans (e.g., cardiovascular disease, cancer), increased government funding for healthcare infrastructure, and technological advancements leading to improved image quality and reduced procedure times. The adoption rate of multi-slice CT scanners has significantly increased, particularly in larger hospitals. Technological advancements, such as iterative reconstruction techniques and AI-powered image analysis, are further enhancing the diagnostic capabilities of CT scans. Consumer demand is shifting towards faster, more comfortable, and lower-radiation procedures, shaping the innovation trajectory of the market. The forecast period (2025-2033) projects a CAGR of xx%, fueled by continued technological innovation and expanding healthcare infrastructure.
Leading Regions, Countries, or Segments in UK Computed Tomography Industry
The UK CT market exhibits strong regional variations. London and the South East consistently demonstrate the highest demand, driven by high population density, a large number of hospitals and diagnostic centers, and significant investment in healthcare infrastructure. Within the segment analysis, High Slice CT scanners are experiencing the fastest growth due to their superior image quality and diagnostic capabilities. Oncology remains the largest application segment, with a significant contribution from the increasing incidence of cancer.
- Key Drivers (London & South East): High population density, numerous healthcare facilities, substantial healthcare investment.
- High Slice CT: Fastest growth due to superior image quality.
- Oncology: Largest application segment driven by rising cancer incidence.
UK Computed Tomography Industry Product Innovations
Recent innovations focus on improving image quality, reducing radiation dose, and enhancing workflow efficiency. Manufacturers are introducing advanced reconstruction algorithms, such as iterative reconstruction and deep learning-based image processing, leading to improved image clarity and reduced noise. Furthermore, developments in detector technology and tube design are enabling faster scan speeds and reduced radiation exposure. The integration of AI-powered tools for automated image analysis is streamlining workflows and improving diagnostic accuracy. These innovations enhance the overall value proposition for hospitals and diagnostic centers, creating a competitive advantage for manufacturers.
Propelling Factors for UK Computed Tomography Industry Growth
Several factors are driving the growth of the UK CT market. Technological advancements, including improved image quality, faster scan times, and lower radiation doses, are major contributors. Increasing government funding for healthcare infrastructure and initiatives to improve access to diagnostic services further support market expansion. Rising prevalence of chronic diseases requiring CT scans for diagnosis and treatment also plays a crucial role. The increasing adoption of advanced imaging techniques and the integration of AI in radiology are additional growth drivers.
Obstacles in the UK Computed Tomography Industry Market
Challenges include the high cost of CT scanners, which can be a barrier to entry for smaller facilities. Supply chain disruptions, especially those experienced post-pandemic, have impacted the availability and pricing of CT equipment and related components. Furthermore, competitive pressures among manufacturers and the rising demand for cost-effective solutions necessitates a focus on operational efficiency. The cost of maintenance, training and staffing also represents a significant ongoing expense.
Future Opportunities in UK Computed Tomography Industry
Future opportunities lie in the adoption of AI-powered image analysis, development of more compact and portable CT scanners for remote locations, and expansion into new applications such as cardiac imaging and interventional radiology. The integration of CT with other imaging modalities, such as PET and MRI, promises enhanced diagnostic capabilities and personalized medicine. Growth is anticipated through the expansion of private diagnostic imaging services in response to increased demand and government-led initiatives to reduce patient waiting times.
Major Players in the UK Computed Tomography Industry Ecosystem
- GE Healthcare
- Koning corporation
- Siemens Healthineers AG
- Canon Medical Systems Corporation (Toshiba Corporation)
- Neusoft Medical Systems Co Ltd
- Carestream Health
- Koninklijke Philips NV
- Stryker Corporation
- Planmeca Group (Planmed OY)
- Samsung Electronics Co Ltd
- Fujifilm Holdings Corporation
Key Developments in UK Computed Tomography Industry Industry
- April 2022: A new EUR 1.3m CT scanner installed at North Tyneside Hospital, funded by EUR 350 million from the DHSC. This signifies a significant investment in regional healthcare infrastructure.
- October 2021: Two new CT scanners installed at Surrey and Sussex Healthcare NHS Trust by Canon Medical Systems UK, increasing outpatient imaging capacity by 1000 scans per month. This highlights the growing demand and investment in outpatient services.
Strategic UK Computed Tomography Industry Market Forecast
The UK CT market is projected to experience sustained growth over the forecast period (2025-2033), driven by technological advancements, increasing healthcare expenditure, and the rising prevalence of chronic diseases. Continued innovation in areas such as AI-powered image analysis, improved detector technology, and the development of new clinical applications will further fuel market expansion. The expanding adoption of private healthcare is also expected to contribute to the market's growth trajectory, presenting significant opportunities for manufacturers and service providers.
UK Computed Tomography Industry Segmentation
-
1. Type
- 1.1. Low Slice
- 1.2. Medium Slice
- 1.3. High Slice
-
2. Application
- 2.1. Oncology
- 2.2. Neurology
- 2.3. Cardiovascular
- 2.4. Musculoskeletal
- 2.5. Other Applications
-
3. End User
- 3.1. Hospitals
- 3.2. Diagnostic Centers
- 3.3. Other End Users
UK Computed Tomography Industry Segmentation By Geography
-
1. North America
- 1.1. United States
- 1.2. Canada
- 1.3. Mexico
-
2. South America
- 2.1. Brazil
- 2.2. Argentina
- 2.3. Rest of South America
-
3. Europe
- 3.1. United Kingdom
- 3.2. Germany
- 3.3. France
- 3.4. Italy
- 3.5. Spain
- 3.6. Russia
- 3.7. Benelux
- 3.8. Nordics
- 3.9. Rest of Europe
-
4. Middle East & Africa
- 4.1. Turkey
- 4.2. Israel
- 4.3. GCC
- 4.4. North Africa
- 4.5. South Africa
- 4.6. Rest of Middle East & Africa
-
5. Asia Pacific
- 5.1. China
- 5.2. India
- 5.3. Japan
- 5.4. South Korea
- 5.5. ASEAN
- 5.6. Oceania
- 5.7. Rest of Asia Pacific
UK Computed Tomography Industry REPORT HIGHLIGHTS
| Aspects | Details |
|---|---|
| Study Period | 2019-2033 |
| Base Year | 2024 |
| Estimated Year | 2025 |
| Forecast Period | 2025-2033 |
| Historical Period | 2019-2024 |
| Growth Rate | CAGR of 6.33% from 2019-2033 |
| Segmentation |
|
Table of Contents
- 1. Introduction
- 1.1. Research Scope
- 1.2. Market Segmentation
- 1.3. Research Methodology
- 1.4. Definitions and Assumptions
- 2. Executive Summary
- 2.1. Introduction
- 3. Market Dynamics
- 3.1. Introduction
- 3.2. Market Drivers
- 3.2.1. Increasing Prevalence of Chronic Diseases; Rising Geriatric Population; Increasing Technological Advancements
- 3.3. Market Restrains
- 3.3.1. Lack Of Proper Reimbursement And Stringent Regulatory Approval Procedures; High Cost of Equipment
- 3.4. Market Trends
- 3.4.1. Oncology Segment is Expected to Hold a Significant Market Share Over the Forecast Period
- 4. Market Factor Analysis
- 4.1. Porters Five Forces
- 4.2. Supply/Value Chain
- 4.3. PESTEL analysis
- 4.4. Market Entropy
- 4.5. Patent/Trademark Analysis
- 5. Global UK Computed Tomography Industry Analysis, Insights and Forecast, 2019-2031
- 5.1. Market Analysis, Insights and Forecast - by Type
- 5.1.1. Low Slice
- 5.1.2. Medium Slice
- 5.1.3. High Slice
- 5.2. Market Analysis, Insights and Forecast - by Application
- 5.2.1. Oncology
- 5.2.2. Neurology
- 5.2.3. Cardiovascular
- 5.2.4. Musculoskeletal
- 5.2.5. Other Applications
- 5.3. Market Analysis, Insights and Forecast - by End User
- 5.3.1. Hospitals
- 5.3.2. Diagnostic Centers
- 5.3.3. Other End Users
- 5.4. Market Analysis, Insights and Forecast - by Region
- 5.4.1. North America
- 5.4.2. South America
- 5.4.3. Europe
- 5.4.4. Middle East & Africa
- 5.4.5. Asia Pacific
- 5.1. Market Analysis, Insights and Forecast - by Type
- 6. North America UK Computed Tomography Industry Analysis, Insights and Forecast, 2019-2031
- 6.1. Market Analysis, Insights and Forecast - by Type
- 6.1.1. Low Slice
- 6.1.2. Medium Slice
- 6.1.3. High Slice
- 6.2. Market Analysis, Insights and Forecast - by Application
- 6.2.1. Oncology
- 6.2.2. Neurology
- 6.2.3. Cardiovascular
- 6.2.4. Musculoskeletal
- 6.2.5. Other Applications
- 6.3. Market Analysis, Insights and Forecast - by End User
- 6.3.1. Hospitals
- 6.3.2. Diagnostic Centers
- 6.3.3. Other End Users
- 6.1. Market Analysis, Insights and Forecast - by Type
- 7. South America UK Computed Tomography Industry Analysis, Insights and Forecast, 2019-2031
- 7.1. Market Analysis, Insights and Forecast - by Type
- 7.1.1. Low Slice
- 7.1.2. Medium Slice
- 7.1.3. High Slice
- 7.2. Market Analysis, Insights and Forecast - by Application
- 7.2.1. Oncology
- 7.2.2. Neurology
- 7.2.3. Cardiovascular
- 7.2.4. Musculoskeletal
- 7.2.5. Other Applications
- 7.3. Market Analysis, Insights and Forecast - by End User
- 7.3.1. Hospitals
- 7.3.2. Diagnostic Centers
- 7.3.3. Other End Users
- 7.1. Market Analysis, Insights and Forecast - by Type
- 8. Europe UK Computed Tomography Industry Analysis, Insights and Forecast, 2019-2031
- 8.1. Market Analysis, Insights and Forecast - by Type
- 8.1.1. Low Slice
- 8.1.2. Medium Slice
- 8.1.3. High Slice
- 8.2. Market Analysis, Insights and Forecast - by Application
- 8.2.1. Oncology
- 8.2.2. Neurology
- 8.2.3. Cardiovascular
- 8.2.4. Musculoskeletal
- 8.2.5. Other Applications
- 8.3. Market Analysis, Insights and Forecast - by End User
- 8.3.1. Hospitals
- 8.3.2. Diagnostic Centers
- 8.3.3. Other End Users
- 8.1. Market Analysis, Insights and Forecast - by Type
- 9. Middle East & Africa UK Computed Tomography Industry Analysis, Insights and Forecast, 2019-2031
- 9.1. Market Analysis, Insights and Forecast - by Type
- 9.1.1. Low Slice
- 9.1.2. Medium Slice
- 9.1.3. High Slice
- 9.2. Market Analysis, Insights and Forecast - by Application
- 9.2.1. Oncology
- 9.2.2. Neurology
- 9.2.3. Cardiovascular
- 9.2.4. Musculoskeletal
- 9.2.5. Other Applications
- 9.3. Market Analysis, Insights and Forecast - by End User
- 9.3.1. Hospitals
- 9.3.2. Diagnostic Centers
- 9.3.3. Other End Users
- 9.1. Market Analysis, Insights and Forecast - by Type
- 10. Asia Pacific UK Computed Tomography Industry Analysis, Insights and Forecast, 2019-2031
- 10.1. Market Analysis, Insights and Forecast - by Type
- 10.1.1. Low Slice
- 10.1.2. Medium Slice
- 10.1.3. High Slice
- 10.2. Market Analysis, Insights and Forecast - by Application
- 10.2.1. Oncology
- 10.2.2. Neurology
- 10.2.3. Cardiovascular
- 10.2.4. Musculoskeletal
- 10.2.5. Other Applications
- 10.3. Market Analysis, Insights and Forecast - by End User
- 10.3.1. Hospitals
- 10.3.2. Diagnostic Centers
- 10.3.3. Other End Users
- 10.1. Market Analysis, Insights and Forecast - by Type
- 11. England UK Computed Tomography Industry Analysis, Insights and Forecast, 2019-2031
- 12. Wales UK Computed Tomography Industry Analysis, Insights and Forecast, 2019-2031
- 13. Scotland UK Computed Tomography Industry Analysis, Insights and Forecast, 2019-2031
- 14. Northern UK Computed Tomography Industry Analysis, Insights and Forecast, 2019-2031
- 15. Ireland UK Computed Tomography Industry Analysis, Insights and Forecast, 2019-2031
- 16. Competitive Analysis
- 16.1. Global Market Share Analysis 2024
- 16.2. Company Profiles
- 16.2.1 GE Healthcare
- 16.2.1.1. Overview
- 16.2.1.2. Products
- 16.2.1.3. SWOT Analysis
- 16.2.1.4. Recent Developments
- 16.2.1.5. Financials (Based on Availability)
- 16.2.2 Koning corporation
- 16.2.2.1. Overview
- 16.2.2.2. Products
- 16.2.2.3. SWOT Analysis
- 16.2.2.4. Recent Developments
- 16.2.2.5. Financials (Based on Availability)
- 16.2.3 Siemens Healthineers AG
- 16.2.3.1. Overview
- 16.2.3.2. Products
- 16.2.3.3. SWOT Analysis
- 16.2.3.4. Recent Developments
- 16.2.3.5. Financials (Based on Availability)
- 16.2.4 Canon Medical Systems Corporation (Toshiba Corporation)
- 16.2.4.1. Overview
- 16.2.4.2. Products
- 16.2.4.3. SWOT Analysis
- 16.2.4.4. Recent Developments
- 16.2.4.5. Financials (Based on Availability)
- 16.2.5 Neusoft Medical Systems Co Ltd
- 16.2.5.1. Overview
- 16.2.5.2. Products
- 16.2.5.3. SWOT Analysis
- 16.2.5.4. Recent Developments
- 16.2.5.5. Financials (Based on Availability)
- 16.2.6 Carestream Health
- 16.2.6.1. Overview
- 16.2.6.2. Products
- 16.2.6.3. SWOT Analysis
- 16.2.6.4. Recent Developments
- 16.2.6.5. Financials (Based on Availability)
- 16.2.7 Koninklijke Philips NV
- 16.2.7.1. Overview
- 16.2.7.2. Products
- 16.2.7.3. SWOT Analysis
- 16.2.7.4. Recent Developments
- 16.2.7.5. Financials (Based on Availability)
- 16.2.8 Stryker Corporation
- 16.2.8.1. Overview
- 16.2.8.2. Products
- 16.2.8.3. SWOT Analysis
- 16.2.8.4. Recent Developments
- 16.2.8.5. Financials (Based on Availability)
- 16.2.9 Planmeca Group (Planmed OY)
- 16.2.9.1. Overview
- 16.2.9.2. Products
- 16.2.9.3. SWOT Analysis
- 16.2.9.4. Recent Developments
- 16.2.9.5. Financials (Based on Availability)
- 16.2.10 Samsung Electronics Co Ltd
- 16.2.10.1. Overview
- 16.2.10.2. Products
- 16.2.10.3. SWOT Analysis
- 16.2.10.4. Recent Developments
- 16.2.10.5. Financials (Based on Availability)
- 16.2.11 Fujifilm Holdings Corporation
- 16.2.11.1. Overview
- 16.2.11.2. Products
- 16.2.11.3. SWOT Analysis
- 16.2.11.4. Recent Developments
- 16.2.11.5. Financials (Based on Availability)
- 16.2.1 GE Healthcare
List of Figures
- Figure 1: Global UK Computed Tomography Industry Revenue Breakdown (Million, %) by Region 2024 & 2032
- Figure 2: United kingdom Region UK Computed Tomography Industry Revenue (Million), by Country 2024 & 2032
- Figure 3: United kingdom Region UK Computed Tomography Industry Revenue Share (%), by Country 2024 & 2032
- Figure 4: North America UK Computed Tomography Industry Revenue (Million), by Type 2024 & 2032
- Figure 5: North America UK Computed Tomography Industry Revenue Share (%), by Type 2024 & 2032
- Figure 6: North America UK Computed Tomography Industry Revenue (Million), by Application 2024 & 2032
- Figure 7: North America UK Computed Tomography Industry Revenue Share (%), by Application 2024 & 2032
- Figure 8: North America UK Computed Tomography Industry Revenue (Million), by End User 2024 & 2032
- Figure 9: North America UK Computed Tomography Industry Revenue Share (%), by End User 2024 & 2032
- Figure 10: North America UK Computed Tomography Industry Revenue (Million), by Country 2024 & 2032
- Figure 11: North America UK Computed Tomography Industry Revenue Share (%), by Country 2024 & 2032
- Figure 12: South America UK Computed Tomography Industry Revenue (Million), by Type 2024 & 2032
- Figure 13: South America UK Computed Tomography Industry Revenue Share (%), by Type 2024 & 2032
- Figure 14: South America UK Computed Tomography Industry Revenue (Million), by Application 2024 & 2032
- Figure 15: South America UK Computed Tomography Industry Revenue Share (%), by Application 2024 & 2032
- Figure 16: South America UK Computed Tomography Industry Revenue (Million), by End User 2024 & 2032
- Figure 17: South America UK Computed Tomography Industry Revenue Share (%), by End User 2024 & 2032
- Figure 18: South America UK Computed Tomography Industry Revenue (Million), by Country 2024 & 2032
- Figure 19: South America UK Computed Tomography Industry Revenue Share (%), by Country 2024 & 2032
- Figure 20: Europe UK Computed Tomography Industry Revenue (Million), by Type 2024 & 2032
- Figure 21: Europe UK Computed Tomography Industry Revenue Share (%), by Type 2024 & 2032
- Figure 22: Europe UK Computed Tomography Industry Revenue (Million), by Application 2024 & 2032
- Figure 23: Europe UK Computed Tomography Industry Revenue Share (%), by Application 2024 & 2032
- Figure 24: Europe UK Computed Tomography Industry Revenue (Million), by End User 2024 & 2032
- Figure 25: Europe UK Computed Tomography Industry Revenue Share (%), by End User 2024 & 2032
- Figure 26: Europe UK Computed Tomography Industry Revenue (Million), by Country 2024 & 2032
- Figure 27: Europe UK Computed Tomography Industry Revenue Share (%), by Country 2024 & 2032
- Figure 28: Middle East & Africa UK Computed Tomography Industry Revenue (Million), by Type 2024 & 2032
- Figure 29: Middle East & Africa UK Computed Tomography Industry Revenue Share (%), by Type 2024 & 2032
- Figure 30: Middle East & Africa UK Computed Tomography Industry Revenue (Million), by Application 2024 & 2032
- Figure 31: Middle East & Africa UK Computed Tomography Industry Revenue Share (%), by Application 2024 & 2032
- Figure 32: Middle East & Africa UK Computed Tomography Industry Revenue (Million), by End User 2024 & 2032
- Figure 33: Middle East & Africa UK Computed Tomography Industry Revenue Share (%), by End User 2024 & 2032
- Figure 34: Middle East & Africa UK Computed Tomography Industry Revenue (Million), by Country 2024 & 2032
- Figure 35: Middle East & Africa UK Computed Tomography Industry Revenue Share (%), by Country 2024 & 2032
- Figure 36: Asia Pacific UK Computed Tomography Industry Revenue (Million), by Type 2024 & 2032
- Figure 37: Asia Pacific UK Computed Tomography Industry Revenue Share (%), by Type 2024 & 2032
- Figure 38: Asia Pacific UK Computed Tomography Industry Revenue (Million), by Application 2024 & 2032
- Figure 39: Asia Pacific UK Computed Tomography Industry Revenue Share (%), by Application 2024 & 2032
- Figure 40: Asia Pacific UK Computed Tomography Industry Revenue (Million), by End User 2024 & 2032
- Figure 41: Asia Pacific UK Computed Tomography Industry Revenue Share (%), by End User 2024 & 2032
- Figure 42: Asia Pacific UK Computed Tomography Industry Revenue (Million), by Country 2024 & 2032
- Figure 43: Asia Pacific UK Computed Tomography Industry Revenue Share (%), by Country 2024 & 2032
List of Tables
- Table 1: Global UK Computed Tomography Industry Revenue Million Forecast, by Region 2019 & 2032
- Table 2: Global UK Computed Tomography Industry Revenue Million Forecast, by Type 2019 & 2032
- Table 3: Global UK Computed Tomography Industry Revenue Million Forecast, by Application 2019 & 2032
- Table 4: Global UK Computed Tomography Industry Revenue Million Forecast, by End User 2019 & 2032
- Table 5: Global UK Computed Tomography Industry Revenue Million Forecast, by Region 2019 & 2032
- Table 6: Global UK Computed Tomography Industry Revenue Million Forecast, by Country 2019 & 2032
- Table 7: England UK Computed Tomography Industry Revenue (Million) Forecast, by Application 2019 & 2032
- Table 8: Wales UK Computed Tomography Industry Revenue (Million) Forecast, by Application 2019 & 2032
- Table 9: Scotland UK Computed Tomography Industry Revenue (Million) Forecast, by Application 2019 & 2032
- Table 10: Northern UK Computed Tomography Industry Revenue (Million) Forecast, by Application 2019 & 2032
- Table 11: Ireland UK Computed Tomography Industry Revenue (Million) Forecast, by Application 2019 & 2032
- Table 12: Global UK Computed Tomography Industry Revenue Million Forecast, by Type 2019 & 2032
- Table 13: Global UK Computed Tomography Industry Revenue Million Forecast, by Application 2019 & 2032
- Table 14: Global UK Computed Tomography Industry Revenue Million Forecast, by End User 2019 & 2032
- Table 15: Global UK Computed Tomography Industry Revenue Million Forecast, by Country 2019 & 2032
- Table 16: United States UK Computed Tomography Industry Revenue (Million) Forecast, by Application 2019 & 2032
- Table 17: Canada UK Computed Tomography Industry Revenue (Million) Forecast, by Application 2019 & 2032
- Table 18: Mexico UK Computed Tomography Industry Revenue (Million) Forecast, by Application 2019 & 2032
- Table 19: Global UK Computed Tomography Industry Revenue Million Forecast, by Type 2019 & 2032
- Table 20: Global UK Computed Tomography Industry Revenue Million Forecast, by Application 2019 & 2032
- Table 21: Global UK Computed Tomography Industry Revenue Million Forecast, by End User 2019 & 2032
- Table 22: Global UK Computed Tomography Industry Revenue Million Forecast, by Country 2019 & 2032
- Table 23: Brazil UK Computed Tomography Industry Revenue (Million) Forecast, by Application 2019 & 2032
- Table 24: Argentina UK Computed Tomography Industry Revenue (Million) Forecast, by Application 2019 & 2032
- Table 25: Rest of South America UK Computed Tomography Industry Revenue (Million) Forecast, by Application 2019 & 2032
- Table 26: Global UK Computed Tomography Industry Revenue Million Forecast, by Type 2019 & 2032
- Table 27: Global UK Computed Tomography Industry Revenue Million Forecast, by Application 2019 & 2032
- Table 28: Global UK Computed Tomography Industry Revenue Million Forecast, by End User 2019 & 2032
- Table 29: Global UK Computed Tomography Industry Revenue Million Forecast, by Country 2019 & 2032
- Table 30: United Kingdom UK Computed Tomography Industry Revenue (Million) Forecast, by Application 2019 & 2032
- Table 31: Germany UK Computed Tomography Industry Revenue (Million) Forecast, by Application 2019 & 2032
- Table 32: France UK Computed Tomography Industry Revenue (Million) Forecast, by Application 2019 & 2032
- Table 33: Italy UK Computed Tomography Industry Revenue (Million) Forecast, by Application 2019 & 2032
- Table 34: Spain UK Computed Tomography Industry Revenue (Million) Forecast, by Application 2019 & 2032
- Table 35: Russia UK Computed Tomography Industry Revenue (Million) Forecast, by Application 2019 & 2032
- Table 36: Benelux UK Computed Tomography Industry Revenue (Million) Forecast, by Application 2019 & 2032
- Table 37: Nordics UK Computed Tomography Industry Revenue (Million) Forecast, by Application 2019 & 2032
- Table 38: Rest of Europe UK Computed Tomography Industry Revenue (Million) Forecast, by Application 2019 & 2032
- Table 39: Global UK Computed Tomography Industry Revenue Million Forecast, by Type 2019 & 2032
- Table 40: Global UK Computed Tomography Industry Revenue Million Forecast, by Application 2019 & 2032
- Table 41: Global UK Computed Tomography Industry Revenue Million Forecast, by End User 2019 & 2032
- Table 42: Global UK Computed Tomography Industry Revenue Million Forecast, by Country 2019 & 2032
- Table 43: Turkey UK Computed Tomography Industry Revenue (Million) Forecast, by Application 2019 & 2032
- Table 44: Israel UK Computed Tomography Industry Revenue (Million) Forecast, by Application 2019 & 2032
- Table 45: GCC UK Computed Tomography Industry Revenue (Million) Forecast, by Application 2019 & 2032
- Table 46: North Africa UK Computed Tomography Industry Revenue (Million) Forecast, by Application 2019 & 2032
- Table 47: South Africa UK Computed Tomography Industry Revenue (Million) Forecast, by Application 2019 & 2032
- Table 48: Rest of Middle East & Africa UK Computed Tomography Industry Revenue (Million) Forecast, by Application 2019 & 2032
- Table 49: Global UK Computed Tomography Industry Revenue Million Forecast, by Type 2019 & 2032
- Table 50: Global UK Computed Tomography Industry Revenue Million Forecast, by Application 2019 & 2032
- Table 51: Global UK Computed Tomography Industry Revenue Million Forecast, by End User 2019 & 2032
- Table 52: Global UK Computed Tomography Industry Revenue Million Forecast, by Country 2019 & 2032
- Table 53: China UK Computed Tomography Industry Revenue (Million) Forecast, by Application 2019 & 2032
- Table 54: India UK Computed Tomography Industry Revenue (Million) Forecast, by Application 2019 & 2032
- Table 55: Japan UK Computed Tomography Industry Revenue (Million) Forecast, by Application 2019 & 2032
- Table 56: South Korea UK Computed Tomography Industry Revenue (Million) Forecast, by Application 2019 & 2032
- Table 57: ASEAN UK Computed Tomography Industry Revenue (Million) Forecast, by Application 2019 & 2032
- Table 58: Oceania UK Computed Tomography Industry Revenue (Million) Forecast, by Application 2019 & 2032
- Table 59: Rest of Asia Pacific UK Computed Tomography Industry Revenue (Million) Forecast, by Application 2019 & 2032
Frequently Asked Questions
1. What is the projected Compound Annual Growth Rate (CAGR) of the UK Computed Tomography Industry?
The projected CAGR is approximately 6.33%.
2. Which companies are prominent players in the UK Computed Tomography Industry?
Key companies in the market include GE Healthcare, Koning corporation, Siemens Healthineers AG, Canon Medical Systems Corporation (Toshiba Corporation), Neusoft Medical Systems Co Ltd, Carestream Health, Koninklijke Philips NV, Stryker Corporation, Planmeca Group (Planmed OY), Samsung Electronics Co Ltd, Fujifilm Holdings Corporation.
3. What are the main segments of the UK Computed Tomography Industry?
The market segments include Type, Application, End User.
4. Can you provide details about the market size?
The market size is estimated to be USD 467.43 Million as of 2022.
5. What are some drivers contributing to market growth?
Increasing Prevalence of Chronic Diseases; Rising Geriatric Population; Increasing Technological Advancements.
6. What are the notable trends driving market growth?
Oncology Segment is Expected to Hold a Significant Market Share Over the Forecast Period.
7. Are there any restraints impacting market growth?
Lack Of Proper Reimbursement And Stringent Regulatory Approval Procedures; High Cost of Equipment.
8. Can you provide examples of recent developments in the market?
In April 2022, a new EUR 1.3m CT scanner was installed at North Tyneside Hospital with the funding of EUR 350 million from the Department of Health and Social Care (DHSC).
9. What pricing options are available for accessing the report?
Pricing options include single-user, multi-user, and enterprise licenses priced at USD 3800, USD 4500, and USD 5800 respectively.
10. Is the market size provided in terms of value or volume?
The market size is provided in terms of value, measured in Million.
11. Are there any specific market keywords associated with the report?
Yes, the market keyword associated with the report is "UK Computed Tomography Industry," which aids in identifying and referencing the specific market segment covered.
12. How do I determine which pricing option suits my needs best?
The pricing options vary based on user requirements and access needs. Individual users may opt for single-user licenses, while businesses requiring broader access may choose multi-user or enterprise licenses for cost-effective access to the report.
13. Are there any additional resources or data provided in the UK Computed Tomography Industry report?
While the report offers comprehensive insights, it's advisable to review the specific contents or supplementary materials provided to ascertain if additional resources or data are available.
14. How can I stay updated on further developments or reports in the UK Computed Tomography Industry?
To stay informed about further developments, trends, and reports in the UK Computed Tomography Industry, consider subscribing to industry newsletters, following relevant companies and organizations, or regularly checking reputable industry news sources and publications.
Methodology
Step 1 - Identification of Relevant Samples Size from Population Database


Step 2 - Approaches for Defining Global Market Size (Value, Volume* & Price*)

Note*: In applicable scenarios
Step 3 - Data Sources
Primary Research
- Web Analytics
- Survey Reports
- Research Institute
- Latest Research Reports
- Opinion Leaders
Secondary Research
- Annual Reports
- White Paper
- Latest Press Release
- Industry Association
- Paid Database
- Investor Presentations

Step 4 - Data Triangulation
Involves using different sources of information in order to increase the validity of a study
These sources are likely to be stakeholders in a program - participants, other researchers, program staff, other community members, and so on.
Then we put all data in single framework & apply various statistical tools to find out the dynamic on the market.
During the analysis stage, feedback from the stakeholder groups would be compared to determine areas of agreement as well as areas of divergence
