

Key Insights
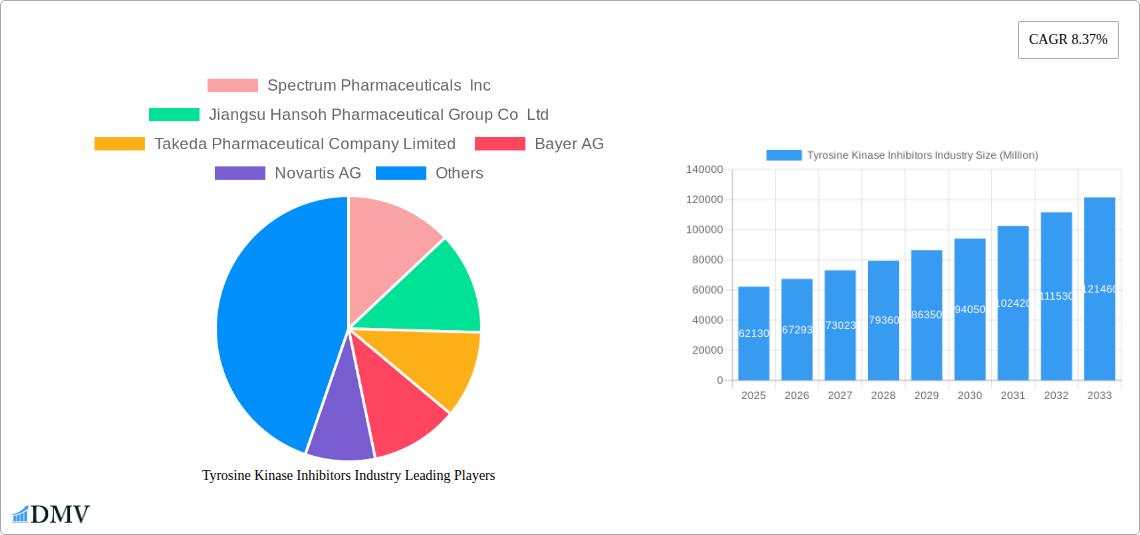
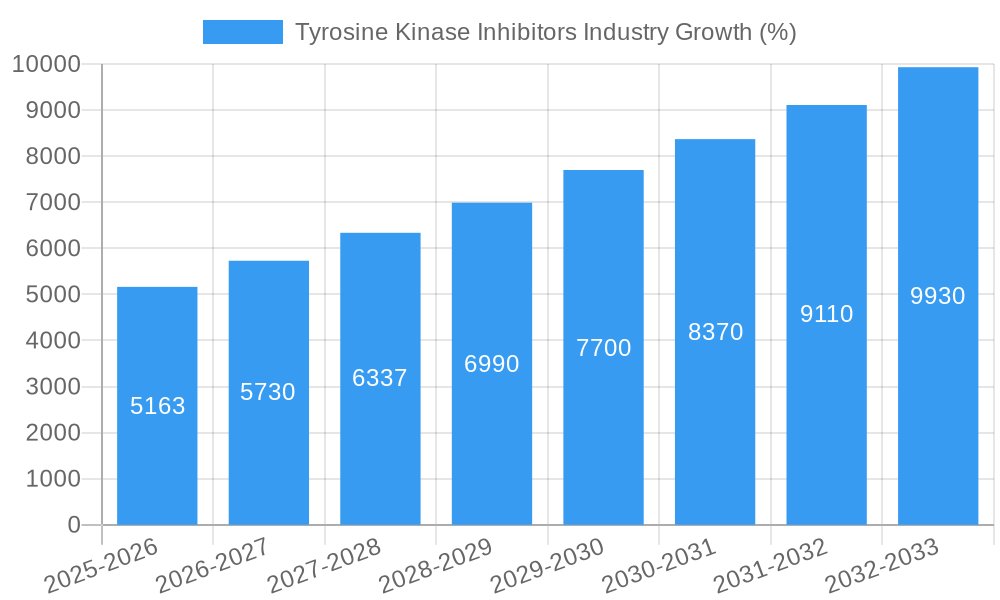
The Tyrosine Kinase Inhibitors (TKIs) market, valued at $62.13 billion in 2025, is projected to experience robust growth, driven by a Compound Annual Growth Rate (CAGR) of 8.37% from 2025 to 2033. This expansion is fueled by several key factors. The increasing prevalence of cancers like chronic myeloid leukemia (CML), lung cancer, breast cancer, and renal cell carcinoma, which are prime targets for TKIs, is a major driver. Furthermore, continuous advancements in TKI research and development are leading to the creation of more effective and targeted therapies with improved safety profiles, stimulating market growth. The emergence of novel TKIs with enhanced efficacy against drug-resistant cancer mutations is another significant contributor. This is coupled with expanding treatment guidelines and increased healthcare expenditure globally, particularly in developed regions like North America and Europe. However, the high cost of TKIs, potential side effects, and the emergence of drug resistance pose challenges to market expansion. The market segmentation reveals that BCR-ABL TKIs, given their established role in CML treatment, likely hold the largest segment share, followed by EGFR and VEGFR TKIs used in various other cancers.
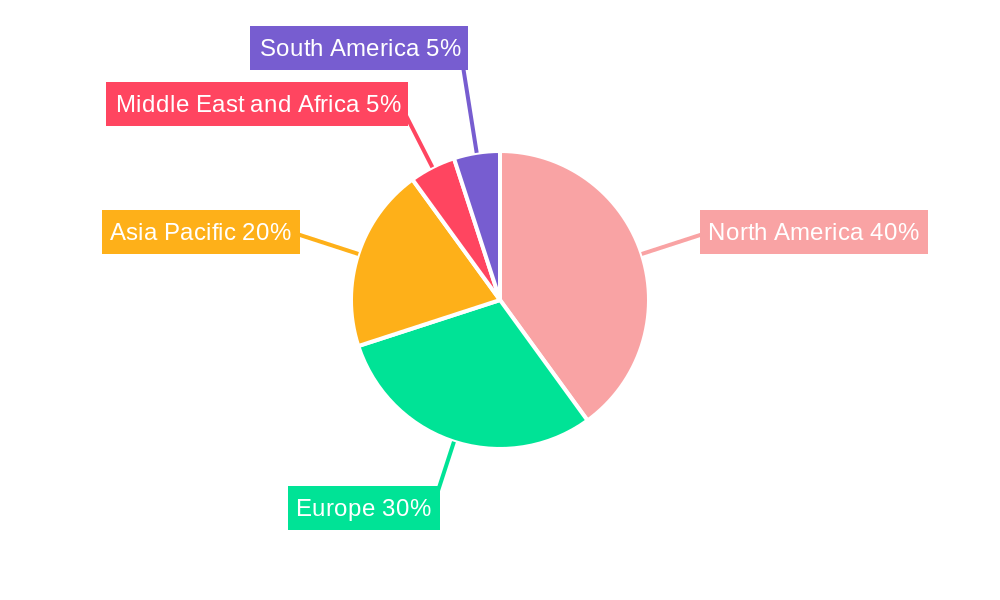
The geographical distribution of the TKI market shows a strong presence in North America and Europe, driven by advanced healthcare infrastructure and higher rates of cancer incidence. However, the Asia-Pacific region is expected to showcase significant growth potential in the coming years due to rising cancer prevalence, improving healthcare access, and growing awareness of targeted therapies. The competitive landscape is highly consolidated, with major pharmaceutical companies like Novartis, Roche, Pfizer, and Takeda playing key roles. These companies are actively engaged in research and development, strategic partnerships, and market expansion efforts to maintain their leadership positions. The long-term outlook remains positive, with sustained growth anticipated as the understanding of TKI mechanisms and their application in cancer treatment continues to improve. Continued innovation and development of next-generation TKIs focusing on overcoming drug resistance and improving patient outcomes will remain critical to this market's success.
Tyrosine Kinase Inhibitors (TKIs) Industry Market Report: 2019-2033
This comprehensive report provides an in-depth analysis of the Tyrosine Kinase Inhibitors (TKIs) market, projecting a robust growth trajectory from 2025 to 2033. The study period spans 2019-2033, with 2025 serving as both the base and estimated year. The report covers key segments like BCR-ABL, EGFR, VEGFR TKIs, and others, analyzing their applications across Chronic Myeloid Leukemia (CML), Lung Cancer, Breast Cancer, Renal Cell Cancer, and other indications. We delve into market dynamics, competitive landscapes, and future growth potential, providing valuable insights for stakeholders across the pharmaceutical industry. The projected market size in 2025 is estimated at xx Million, with significant growth anticipated throughout the forecast period.
Tyrosine Kinase Inhibitors Industry Market Composition & Trends
The Tyrosine Kinase Inhibitors (TKIs) market is characterized by a moderately concentrated landscape, with key players like Spectrum Pharmaceuticals Inc, Jiangsu Hansoh Pharmaceutical Group Co Ltd, Takeda Pharmaceutical Company Limited, Bayer AG, Novartis AG, F Hoffmann-La Roche Ltd, AstraZeneca PLC, Eli Lilly and Company, Johnson and Johnson, Eisai Co Ltd, Boehringer Ingelheim International, Bristol-Myers Squibb Company, and Pfizer Inc driving innovation and competition. Market share distribution varies significantly across segments, with xx Million allocated to EGFR TKIs and xx Million to VEGFR TKIs in 2025.
- Market Concentration: Moderate, with top 10 companies holding approximately xx% market share in 2025.
- Innovation Catalysts: Ongoing R&D efforts focusing on targeted therapies, personalized medicine, and overcoming drug resistance.
- Regulatory Landscape: Stringent regulatory approvals, driving focus on clinical trial success and robust safety data.
- Substitute Products: Limited effective substitutes, strengthening the TKI market’s position in oncology.
- End-User Profile: Primarily oncologists and hematologists in hospitals and specialized cancer centers.
- M&A Activities: Significant M&A activity in recent years, with deal values exceeding xx Million in the last five years, driven by the need for portfolio diversification and access to innovative technologies.
Tyrosine Kinase Inhibitors Industry Industry Evolution
The TKI market has witnessed exponential growth driven by advancements in cancer biology, leading to the development of highly targeted therapies. The historical period (2019-2024) saw a Compound Annual Growth Rate (CAGR) of xx%, fueled by increased approvals and broader adoption of TKIs. The forecast period (2025-2033) anticipates a CAGR of xx%, driven by expanding indications, the emergence of novel TKIs, and increasing global cancer prevalence. Technological advancements, such as next-generation sequencing, enabling personalized medicine, are accelerating market growth. The rising prevalence of cancers such as lung and renal cell cancer, alongside a growing elderly population, further contributes to the market expansion. Shifting consumer demands are increasingly towards targeted therapies with minimized side effects, pushing pharmaceutical companies to develop improved TKI formulations. The adoption rate of TKIs has steadily increased, with xx% of eligible patients receiving TKI therapy in 2024, projected to reach xx% by 2033.
Leading Regions, Countries, or Segments in Tyrosine Kinase Inhibitors Industry
The North American region is currently the leading market for TKIs, driven by high healthcare expenditure, advanced healthcare infrastructure, and early adoption of innovative therapies. However, the Asia-Pacific region is projected to experience the fastest growth rate due to rising cancer prevalence and increasing healthcare investment.
- Dominant Type: EGFR Tyrosine Kinase Inhibitors currently hold the largest market share due to the prevalence of lung cancer.
- Dominant Application: Lung cancer represents the largest application segment, followed by CML and renal cell carcinoma.
Key Drivers for Regional Dominance:
- North America: High healthcare spending, robust clinical trial infrastructure, and early adoption of advanced therapies.
- Asia-Pacific: Rapidly growing cancer prevalence, increasing healthcare investment, and rising disposable incomes.
- Europe: Well-established healthcare systems, strong regulatory frameworks, and increasing government funding for cancer research.
Factors contributing to Segment Dominance:
- EGFR TKIs: High prevalence of lung cancer, a major driver for EGFR TKI usage.
- Lung Cancer: High incidence rates globally, driving substantial demand for effective therapies, including TKIs.
Tyrosine Kinase Inhibitors Industry Product Innovations
Recent years have witnessed the introduction of novel TKIs with improved efficacy, reduced side effects, and enhanced targeted action. These innovations include next-generation TKIs designed to overcome drug resistance mechanisms and overcome limitations of earlier generations. Focus on oral formulations, personalized medicine approaches, and combination therapies with other cancer drugs is also improving treatment outcomes and patient compliance. The unique selling propositions encompass improved tolerability, enhanced efficacy, and more targeted action leading to fewer adverse events.
Propelling Factors for Tyrosine Kinase Inhibitors Industry Growth
The TKI market is propelled by several key factors: Technological advancements like next-generation sequencing enabling personalized medicine, driving the development of more targeted therapies. Economic factors such as increased healthcare spending and rising disposable incomes in emerging economies contribute to market expansion. Favorable regulatory environments, facilitating faster approvals and market access for innovative TKIs, are also significant. The rising prevalence of various cancers, particularly lung and renal cell carcinoma, is a major driver of increased TKI demand.
Obstacles in the Tyrosine Kinase Inhibitors Industry Market
The TKI market faces challenges including stringent regulatory requirements for approvals, leading to lengthy development times and high costs. Supply chain disruptions and the increasing prices of raw materials can impact production and pricing. Intense competition among established pharmaceutical companies and emerging biotech firms poses a considerable challenge. The development of drug resistance remains a significant hurdle, requiring continuous innovation in TKI design. Lastly, the high cost of treatment can limit access for a large segment of the population.
Future Opportunities in Tyrosine Kinase Inhibitors Industry
Future opportunities lie in the development of next-generation TKIs overcoming drug resistance, targeted therapies addressing specific genetic mutations, and combination therapies that synergistically enhance treatment outcomes. Expanding into new emerging markets, especially in Asia and Africa, presents a significant opportunity for growth. Advances in personalized medicine, allowing for tailored treatment strategies, are expected to shape the future of TKI application.
Major Players in the Tyrosine Kinase Inhibitors Industry Ecosystem
- Spectrum Pharmaceuticals Inc
- Jiangsu Hansoh Pharmaceutical Group Co Ltd
- Takeda Pharmaceutical Company Limited
- Bayer AG
- Novartis AG
- F Hoffmann-La Roche Ltd
- AstraZeneca PLC
- Eli Lilly and Company
- Johnson and Johnson
- Eisai Co Ltd
- Boehringer Ingelheim International
- Bristol-Myers Squibb Company
- Pfizer Inc
Key Developments in Tyrosine Kinase Inhibitors Industry Industry
- June 2022: The European Commission approved capmatinib (Tabrecta), a TKI, for METex14-altered advanced NSCLC. This approval expands treatment options for patients with this specific type of lung cancer.
- February 2022: The European Commission approved tepotinib (TEPMETKO), a TKI, as a monotherapy for advanced NSCLC. This marks a significant advancement in the treatment of this prevalent cancer type.
Strategic Tyrosine Kinase Inhibitors Industry Market Forecast
The TKI market is poised for substantial growth, driven by continuous technological advancements, the expansion of indications, and the increasing prevalence of targeted cancers globally. The growing understanding of cancer biology will fuel the development of more sophisticated and effective TKIs with improved tolerability profiles. The forecast period anticipates robust growth, driven by rising cancer diagnoses and an increasing number of patients benefiting from these targeted therapies, leading to a sizable market potential by 2033.
Tyrosine Kinase Inhibitors Industry Segmentation
-
1. Type
- 1.1. BCR-ABL Tyrosine Kinase Inhibitor
- 1.2. Epiderma
- 1.3. Vascular
- 1.4. Other Types
-
2. Application
- 2.1. Chronic Myeloid Leukemia (CML)
- 2.2. Lung Cancer
- 2.3. Breast Cancer
- 2.4. Renal Cell Cancer
- 2.5. Other Applications
Tyrosine Kinase Inhibitors Industry Segmentation By Geography
-
1. North America
- 1.1. United States
- 1.2. Canada
- 1.3. Mexico
-
2. Europe
- 2.1. Germany
- 2.2. United Kingdom
- 2.3. France
- 2.4. Italy
- 2.5. Spain
- 2.6. Rest of Europe
-
3. Asia Pacific
- 3.1. China
- 3.2. Japan
- 3.3. India
- 3.4. Australia
- 3.5. South Korea
- 3.6. Rest of Asia Pacific
-
4. Middle East and Africa
- 4.1. GCC
- 4.2. South Africa
- 4.3. Rest of Middle East and Africa
-
5. South America
- 5.1. Brazil
- 5.2. Argentina
- 5.3. Rest of South America
Tyrosine Kinase Inhibitors Industry REPORT HIGHLIGHTS
| Aspects | Details |
|---|---|
| Study Period | 2019-2033 |
| Base Year | 2024 |
| Estimated Year | 2025 |
| Forecast Period | 2025-2033 |
| Historical Period | 2019-2024 |
| Growth Rate | CAGR of 8.37% from 2019-2033 |
| Segmentation |
|
Table of Contents
- 1. Introduction
- 1.1. Research Scope
- 1.2. Market Segmentation
- 1.3. Research Methodology
- 1.4. Definitions and Assumptions
- 2. Executive Summary
- 2.1. Introduction
- 3. Market Dynamics
- 3.1. Introduction
- 3.2. Market Drivers
- 3.2.1. Increasing Prevalence of Cancer; Growing Research Activities and Investment in Tyrosine Kinase Inhibitors
- 3.3. Market Restrains
- 3.3.1. High Cost of Therapy
- 3.4. Market Trends
- 3.4.1. Breast Cancer Segment is Expected to Hold a Significant Market Share Over the Forecast Period
- 4. Market Factor Analysis
- 4.1. Porters Five Forces
- 4.2. Supply/Value Chain
- 4.3. PESTEL analysis
- 4.4. Market Entropy
- 4.5. Patent/Trademark Analysis
- 5. Global Tyrosine Kinase Inhibitors Industry Analysis, Insights and Forecast, 2019-2031
- 5.1. Market Analysis, Insights and Forecast - by Type
- 5.1.1. BCR-ABL Tyrosine Kinase Inhibitor
- 5.1.2. Epiderma
- 5.1.3. Vascular
- 5.1.4. Other Types
- 5.2. Market Analysis, Insights and Forecast - by Application
- 5.2.1. Chronic Myeloid Leukemia (CML)
- 5.2.2. Lung Cancer
- 5.2.3. Breast Cancer
- 5.2.4. Renal Cell Cancer
- 5.2.5. Other Applications
- 5.3. Market Analysis, Insights and Forecast - by Region
- 5.3.1. North America
- 5.3.2. Europe
- 5.3.3. Asia Pacific
- 5.3.4. Middle East and Africa
- 5.3.5. South America
- 5.1. Market Analysis, Insights and Forecast - by Type
- 6. North America Tyrosine Kinase Inhibitors Industry Analysis, Insights and Forecast, 2019-2031
- 6.1. Market Analysis, Insights and Forecast - by Type
- 6.1.1. BCR-ABL Tyrosine Kinase Inhibitor
- 6.1.2. Epiderma
- 6.1.3. Vascular
- 6.1.4. Other Types
- 6.2. Market Analysis, Insights and Forecast - by Application
- 6.2.1. Chronic Myeloid Leukemia (CML)
- 6.2.2. Lung Cancer
- 6.2.3. Breast Cancer
- 6.2.4. Renal Cell Cancer
- 6.2.5. Other Applications
- 6.1. Market Analysis, Insights and Forecast - by Type
- 7. Europe Tyrosine Kinase Inhibitors Industry Analysis, Insights and Forecast, 2019-2031
- 7.1. Market Analysis, Insights and Forecast - by Type
- 7.1.1. BCR-ABL Tyrosine Kinase Inhibitor
- 7.1.2. Epiderma
- 7.1.3. Vascular
- 7.1.4. Other Types
- 7.2. Market Analysis, Insights and Forecast - by Application
- 7.2.1. Chronic Myeloid Leukemia (CML)
- 7.2.2. Lung Cancer
- 7.2.3. Breast Cancer
- 7.2.4. Renal Cell Cancer
- 7.2.5. Other Applications
- 7.1. Market Analysis, Insights and Forecast - by Type
- 8. Asia Pacific Tyrosine Kinase Inhibitors Industry Analysis, Insights and Forecast, 2019-2031
- 8.1. Market Analysis, Insights and Forecast - by Type
- 8.1.1. BCR-ABL Tyrosine Kinase Inhibitor
- 8.1.2. Epiderma
- 8.1.3. Vascular
- 8.1.4. Other Types
- 8.2. Market Analysis, Insights and Forecast - by Application
- 8.2.1. Chronic Myeloid Leukemia (CML)
- 8.2.2. Lung Cancer
- 8.2.3. Breast Cancer
- 8.2.4. Renal Cell Cancer
- 8.2.5. Other Applications
- 8.1. Market Analysis, Insights and Forecast - by Type
- 9. Middle East and Africa Tyrosine Kinase Inhibitors Industry Analysis, Insights and Forecast, 2019-2031
- 9.1. Market Analysis, Insights and Forecast - by Type
- 9.1.1. BCR-ABL Tyrosine Kinase Inhibitor
- 9.1.2. Epiderma
- 9.1.3. Vascular
- 9.1.4. Other Types
- 9.2. Market Analysis, Insights and Forecast - by Application
- 9.2.1. Chronic Myeloid Leukemia (CML)
- 9.2.2. Lung Cancer
- 9.2.3. Breast Cancer
- 9.2.4. Renal Cell Cancer
- 9.2.5. Other Applications
- 9.1. Market Analysis, Insights and Forecast - by Type
- 10. South America Tyrosine Kinase Inhibitors Industry Analysis, Insights and Forecast, 2019-2031
- 10.1. Market Analysis, Insights and Forecast - by Type
- 10.1.1. BCR-ABL Tyrosine Kinase Inhibitor
- 10.1.2. Epiderma
- 10.1.3. Vascular
- 10.1.4. Other Types
- 10.2. Market Analysis, Insights and Forecast - by Application
- 10.2.1. Chronic Myeloid Leukemia (CML)
- 10.2.2. Lung Cancer
- 10.2.3. Breast Cancer
- 10.2.4. Renal Cell Cancer
- 10.2.5. Other Applications
- 10.1. Market Analysis, Insights and Forecast - by Type
- 11. North America Tyrosine Kinase Inhibitors Industry Analysis, Insights and Forecast, 2019-2031
- 11.1. Market Analysis, Insights and Forecast - By Country/Sub-region
- 11.1.1. undefined
- 12. Europe Tyrosine Kinase Inhibitors Industry Analysis, Insights and Forecast, 2019-2031
- 12.1. Market Analysis, Insights and Forecast - By Country/Sub-region
- 12.1.1. undefined
- 13. Asia Pacific Tyrosine Kinase Inhibitors Industry Analysis, Insights and Forecast, 2019-2031
- 13.1. Market Analysis, Insights and Forecast - By Country/Sub-region
- 13.1.1. undefined
- 14. Middle East and Africa Tyrosine Kinase Inhibitors Industry Analysis, Insights and Forecast, 2019-2031
- 14.1. Market Analysis, Insights and Forecast - By Country/Sub-region
- 14.1.1. undefined
- 15. South America Tyrosine Kinase Inhibitors Industry Analysis, Insights and Forecast, 2019-2031
- 15.1. Market Analysis, Insights and Forecast - By Country/Sub-region
- 15.1.1. undefined
- 16. Competitive Analysis
- 16.1. Global Market Share Analysis 2024
- 16.2. Company Profiles
- 16.2.1 Spectrum Pharmaceuticals Inc
- 16.2.1.1. Overview
- 16.2.1.2. Products
- 16.2.1.3. SWOT Analysis
- 16.2.1.4. Recent Developments
- 16.2.1.5. Financials (Based on Availability)
- 16.2.2 Jiangsu Hansoh Pharmaceutical Group Co Ltd
- 16.2.2.1. Overview
- 16.2.2.2. Products
- 16.2.2.3. SWOT Analysis
- 16.2.2.4. Recent Developments
- 16.2.2.5. Financials (Based on Availability)
- 16.2.3 Takeda Pharmaceutical Company Limited
- 16.2.3.1. Overview
- 16.2.3.2. Products
- 16.2.3.3. SWOT Analysis
- 16.2.3.4. Recent Developments
- 16.2.3.5. Financials (Based on Availability)
- 16.2.4 Bayer AG
- 16.2.4.1. Overview
- 16.2.4.2. Products
- 16.2.4.3. SWOT Analysis
- 16.2.4.4. Recent Developments
- 16.2.4.5. Financials (Based on Availability)
- 16.2.5 Novartis AG
- 16.2.5.1. Overview
- 16.2.5.2. Products
- 16.2.5.3. SWOT Analysis
- 16.2.5.4. Recent Developments
- 16.2.5.5. Financials (Based on Availability)
- 16.2.6 F Hoffmann-La Roche Ltd
- 16.2.6.1. Overview
- 16.2.6.2. Products
- 16.2.6.3. SWOT Analysis
- 16.2.6.4. Recent Developments
- 16.2.6.5. Financials (Based on Availability)
- 16.2.7 AstraZeneca PLC
- 16.2.7.1. Overview
- 16.2.7.2. Products
- 16.2.7.3. SWOT Analysis
- 16.2.7.4. Recent Developments
- 16.2.7.5. Financials (Based on Availability)
- 16.2.8 Eli Lilly and Company
- 16.2.8.1. Overview
- 16.2.8.2. Products
- 16.2.8.3. SWOT Analysis
- 16.2.8.4. Recent Developments
- 16.2.8.5. Financials (Based on Availability)
- 16.2.9 Johnson and Johnson
- 16.2.9.1. Overview
- 16.2.9.2. Products
- 16.2.9.3. SWOT Analysis
- 16.2.9.4. Recent Developments
- 16.2.9.5. Financials (Based on Availability)
- 16.2.10 Eisai Co Ltd
- 16.2.10.1. Overview
- 16.2.10.2. Products
- 16.2.10.3. SWOT Analysis
- 16.2.10.4. Recent Developments
- 16.2.10.5. Financials (Based on Availability)
- 16.2.11 Boehringer Ingelheim International
- 16.2.11.1. Overview
- 16.2.11.2. Products
- 16.2.11.3. SWOT Analysis
- 16.2.11.4. Recent Developments
- 16.2.11.5. Financials (Based on Availability)
- 16.2.12 Bristol-Myers Squibb Company
- 16.2.12.1. Overview
- 16.2.12.2. Products
- 16.2.12.3. SWOT Analysis
- 16.2.12.4. Recent Developments
- 16.2.12.5. Financials (Based on Availability)
- 16.2.13 Pfizer Inc
- 16.2.13.1. Overview
- 16.2.13.2. Products
- 16.2.13.3. SWOT Analysis
- 16.2.13.4. Recent Developments
- 16.2.13.5. Financials (Based on Availability)
- 16.2.1 Spectrum Pharmaceuticals Inc
List of Figures
- Figure 1: Global Tyrosine Kinase Inhibitors Industry Revenue Breakdown (Million, %) by Region 2024 & 2032
- Figure 2: Global Tyrosine Kinase Inhibitors Industry Volume Breakdown (K Unit, %) by Region 2024 & 2032
- Figure 3: North America Tyrosine Kinase Inhibitors Industry Revenue (Million), by Country 2024 & 2032
- Figure 4: North America Tyrosine Kinase Inhibitors Industry Volume (K Unit), by Country 2024 & 2032
- Figure 5: North America Tyrosine Kinase Inhibitors Industry Revenue Share (%), by Country 2024 & 2032
- Figure 6: North America Tyrosine Kinase Inhibitors Industry Volume Share (%), by Country 2024 & 2032
- Figure 7: Europe Tyrosine Kinase Inhibitors Industry Revenue (Million), by Country 2024 & 2032
- Figure 8: Europe Tyrosine Kinase Inhibitors Industry Volume (K Unit), by Country 2024 & 2032
- Figure 9: Europe Tyrosine Kinase Inhibitors Industry Revenue Share (%), by Country 2024 & 2032
- Figure 10: Europe Tyrosine Kinase Inhibitors Industry Volume Share (%), by Country 2024 & 2032
- Figure 11: Asia Pacific Tyrosine Kinase Inhibitors Industry Revenue (Million), by Country 2024 & 2032
- Figure 12: Asia Pacific Tyrosine Kinase Inhibitors Industry Volume (K Unit), by Country 2024 & 2032
- Figure 13: Asia Pacific Tyrosine Kinase Inhibitors Industry Revenue Share (%), by Country 2024 & 2032
- Figure 14: Asia Pacific Tyrosine Kinase Inhibitors Industry Volume Share (%), by Country 2024 & 2032
- Figure 15: Middle East and Africa Tyrosine Kinase Inhibitors Industry Revenue (Million), by Country 2024 & 2032
- Figure 16: Middle East and Africa Tyrosine Kinase Inhibitors Industry Volume (K Unit), by Country 2024 & 2032
- Figure 17: Middle East and Africa Tyrosine Kinase Inhibitors Industry Revenue Share (%), by Country 2024 & 2032
- Figure 18: Middle East and Africa Tyrosine Kinase Inhibitors Industry Volume Share (%), by Country 2024 & 2032
- Figure 19: South America Tyrosine Kinase Inhibitors Industry Revenue (Million), by Country 2024 & 2032
- Figure 20: South America Tyrosine Kinase Inhibitors Industry Volume (K Unit), by Country 2024 & 2032
- Figure 21: South America Tyrosine Kinase Inhibitors Industry Revenue Share (%), by Country 2024 & 2032
- Figure 22: South America Tyrosine Kinase Inhibitors Industry Volume Share (%), by Country 2024 & 2032
- Figure 23: North America Tyrosine Kinase Inhibitors Industry Revenue (Million), by Type 2024 & 2032
- Figure 24: North America Tyrosine Kinase Inhibitors Industry Volume (K Unit), by Type 2024 & 2032
- Figure 25: North America Tyrosine Kinase Inhibitors Industry Revenue Share (%), by Type 2024 & 2032
- Figure 26: North America Tyrosine Kinase Inhibitors Industry Volume Share (%), by Type 2024 & 2032
- Figure 27: North America Tyrosine Kinase Inhibitors Industry Revenue (Million), by Application 2024 & 2032
- Figure 28: North America Tyrosine Kinase Inhibitors Industry Volume (K Unit), by Application 2024 & 2032
- Figure 29: North America Tyrosine Kinase Inhibitors Industry Revenue Share (%), by Application 2024 & 2032
- Figure 30: North America Tyrosine Kinase Inhibitors Industry Volume Share (%), by Application 2024 & 2032
- Figure 31: North America Tyrosine Kinase Inhibitors Industry Revenue (Million), by Country 2024 & 2032
- Figure 32: North America Tyrosine Kinase Inhibitors Industry Volume (K Unit), by Country 2024 & 2032
- Figure 33: North America Tyrosine Kinase Inhibitors Industry Revenue Share (%), by Country 2024 & 2032
- Figure 34: North America Tyrosine Kinase Inhibitors Industry Volume Share (%), by Country 2024 & 2032
- Figure 35: Europe Tyrosine Kinase Inhibitors Industry Revenue (Million), by Type 2024 & 2032
- Figure 36: Europe Tyrosine Kinase Inhibitors Industry Volume (K Unit), by Type 2024 & 2032
- Figure 37: Europe Tyrosine Kinase Inhibitors Industry Revenue Share (%), by Type 2024 & 2032
- Figure 38: Europe Tyrosine Kinase Inhibitors Industry Volume Share (%), by Type 2024 & 2032
- Figure 39: Europe Tyrosine Kinase Inhibitors Industry Revenue (Million), by Application 2024 & 2032
- Figure 40: Europe Tyrosine Kinase Inhibitors Industry Volume (K Unit), by Application 2024 & 2032
- Figure 41: Europe Tyrosine Kinase Inhibitors Industry Revenue Share (%), by Application 2024 & 2032
- Figure 42: Europe Tyrosine Kinase Inhibitors Industry Volume Share (%), by Application 2024 & 2032
- Figure 43: Europe Tyrosine Kinase Inhibitors Industry Revenue (Million), by Country 2024 & 2032
- Figure 44: Europe Tyrosine Kinase Inhibitors Industry Volume (K Unit), by Country 2024 & 2032
- Figure 45: Europe Tyrosine Kinase Inhibitors Industry Revenue Share (%), by Country 2024 & 2032
- Figure 46: Europe Tyrosine Kinase Inhibitors Industry Volume Share (%), by Country 2024 & 2032
- Figure 47: Asia Pacific Tyrosine Kinase Inhibitors Industry Revenue (Million), by Type 2024 & 2032
- Figure 48: Asia Pacific Tyrosine Kinase Inhibitors Industry Volume (K Unit), by Type 2024 & 2032
- Figure 49: Asia Pacific Tyrosine Kinase Inhibitors Industry Revenue Share (%), by Type 2024 & 2032
- Figure 50: Asia Pacific Tyrosine Kinase Inhibitors Industry Volume Share (%), by Type 2024 & 2032
- Figure 51: Asia Pacific Tyrosine Kinase Inhibitors Industry Revenue (Million), by Application 2024 & 2032
- Figure 52: Asia Pacific Tyrosine Kinase Inhibitors Industry Volume (K Unit), by Application 2024 & 2032
- Figure 53: Asia Pacific Tyrosine Kinase Inhibitors Industry Revenue Share (%), by Application 2024 & 2032
- Figure 54: Asia Pacific Tyrosine Kinase Inhibitors Industry Volume Share (%), by Application 2024 & 2032
- Figure 55: Asia Pacific Tyrosine Kinase Inhibitors Industry Revenue (Million), by Country 2024 & 2032
- Figure 56: Asia Pacific Tyrosine Kinase Inhibitors Industry Volume (K Unit), by Country 2024 & 2032
- Figure 57: Asia Pacific Tyrosine Kinase Inhibitors Industry Revenue Share (%), by Country 2024 & 2032
- Figure 58: Asia Pacific Tyrosine Kinase Inhibitors Industry Volume Share (%), by Country 2024 & 2032
- Figure 59: Middle East and Africa Tyrosine Kinase Inhibitors Industry Revenue (Million), by Type 2024 & 2032
- Figure 60: Middle East and Africa Tyrosine Kinase Inhibitors Industry Volume (K Unit), by Type 2024 & 2032
- Figure 61: Middle East and Africa Tyrosine Kinase Inhibitors Industry Revenue Share (%), by Type 2024 & 2032
- Figure 62: Middle East and Africa Tyrosine Kinase Inhibitors Industry Volume Share (%), by Type 2024 & 2032
- Figure 63: Middle East and Africa Tyrosine Kinase Inhibitors Industry Revenue (Million), by Application 2024 & 2032
- Figure 64: Middle East and Africa Tyrosine Kinase Inhibitors Industry Volume (K Unit), by Application 2024 & 2032
- Figure 65: Middle East and Africa Tyrosine Kinase Inhibitors Industry Revenue Share (%), by Application 2024 & 2032
- Figure 66: Middle East and Africa Tyrosine Kinase Inhibitors Industry Volume Share (%), by Application 2024 & 2032
- Figure 67: Middle East and Africa Tyrosine Kinase Inhibitors Industry Revenue (Million), by Country 2024 & 2032
- Figure 68: Middle East and Africa Tyrosine Kinase Inhibitors Industry Volume (K Unit), by Country 2024 & 2032
- Figure 69: Middle East and Africa Tyrosine Kinase Inhibitors Industry Revenue Share (%), by Country 2024 & 2032
- Figure 70: Middle East and Africa Tyrosine Kinase Inhibitors Industry Volume Share (%), by Country 2024 & 2032
- Figure 71: South America Tyrosine Kinase Inhibitors Industry Revenue (Million), by Type 2024 & 2032
- Figure 72: South America Tyrosine Kinase Inhibitors Industry Volume (K Unit), by Type 2024 & 2032
- Figure 73: South America Tyrosine Kinase Inhibitors Industry Revenue Share (%), by Type 2024 & 2032
- Figure 74: South America Tyrosine Kinase Inhibitors Industry Volume Share (%), by Type 2024 & 2032
- Figure 75: South America Tyrosine Kinase Inhibitors Industry Revenue (Million), by Application 2024 & 2032
- Figure 76: South America Tyrosine Kinase Inhibitors Industry Volume (K Unit), by Application 2024 & 2032
- Figure 77: South America Tyrosine Kinase Inhibitors Industry Revenue Share (%), by Application 2024 & 2032
- Figure 78: South America Tyrosine Kinase Inhibitors Industry Volume Share (%), by Application 2024 & 2032
- Figure 79: South America Tyrosine Kinase Inhibitors Industry Revenue (Million), by Country 2024 & 2032
- Figure 80: South America Tyrosine Kinase Inhibitors Industry Volume (K Unit), by Country 2024 & 2032
- Figure 81: South America Tyrosine Kinase Inhibitors Industry Revenue Share (%), by Country 2024 & 2032
- Figure 82: South America Tyrosine Kinase Inhibitors Industry Volume Share (%), by Country 2024 & 2032
List of Tables
- Table 1: Global Tyrosine Kinase Inhibitors Industry Revenue Million Forecast, by Region 2019 & 2032
- Table 2: Global Tyrosine Kinase Inhibitors Industry Volume K Unit Forecast, by Region 2019 & 2032
- Table 3: Global Tyrosine Kinase Inhibitors Industry Revenue Million Forecast, by Type 2019 & 2032
- Table 4: Global Tyrosine Kinase Inhibitors Industry Volume K Unit Forecast, by Type 2019 & 2032
- Table 5: Global Tyrosine Kinase Inhibitors Industry Revenue Million Forecast, by Application 2019 & 2032
- Table 6: Global Tyrosine Kinase Inhibitors Industry Volume K Unit Forecast, by Application 2019 & 2032
- Table 7: Global Tyrosine Kinase Inhibitors Industry Revenue Million Forecast, by Region 2019 & 2032
- Table 8: Global Tyrosine Kinase Inhibitors Industry Volume K Unit Forecast, by Region 2019 & 2032
- Table 9: Global Tyrosine Kinase Inhibitors Industry Revenue Million Forecast, by Country 2019 & 2032
- Table 10: Global Tyrosine Kinase Inhibitors Industry Volume K Unit Forecast, by Country 2019 & 2032
- Table 11: Global Tyrosine Kinase Inhibitors Industry Revenue Million Forecast, by Country 2019 & 2032
- Table 12: Global Tyrosine Kinase Inhibitors Industry Volume K Unit Forecast, by Country 2019 & 2032
- Table 13: Global Tyrosine Kinase Inhibitors Industry Revenue Million Forecast, by Country 2019 & 2032
- Table 14: Global Tyrosine Kinase Inhibitors Industry Volume K Unit Forecast, by Country 2019 & 2032
- Table 15: Global Tyrosine Kinase Inhibitors Industry Revenue Million Forecast, by Country 2019 & 2032
- Table 16: Global Tyrosine Kinase Inhibitors Industry Volume K Unit Forecast, by Country 2019 & 2032
- Table 17: Global Tyrosine Kinase Inhibitors Industry Revenue Million Forecast, by Country 2019 & 2032
- Table 18: Global Tyrosine Kinase Inhibitors Industry Volume K Unit Forecast, by Country 2019 & 2032
- Table 19: Global Tyrosine Kinase Inhibitors Industry Revenue Million Forecast, by Type 2019 & 2032
- Table 20: Global Tyrosine Kinase Inhibitors Industry Volume K Unit Forecast, by Type 2019 & 2032
- Table 21: Global Tyrosine Kinase Inhibitors Industry Revenue Million Forecast, by Application 2019 & 2032
- Table 22: Global Tyrosine Kinase Inhibitors Industry Volume K Unit Forecast, by Application 2019 & 2032
- Table 23: Global Tyrosine Kinase Inhibitors Industry Revenue Million Forecast, by Country 2019 & 2032
- Table 24: Global Tyrosine Kinase Inhibitors Industry Volume K Unit Forecast, by Country 2019 & 2032
- Table 25: United States Tyrosine Kinase Inhibitors Industry Revenue (Million) Forecast, by Application 2019 & 2032
- Table 26: United States Tyrosine Kinase Inhibitors Industry Volume (K Unit) Forecast, by Application 2019 & 2032
- Table 27: Canada Tyrosine Kinase Inhibitors Industry Revenue (Million) Forecast, by Application 2019 & 2032
- Table 28: Canada Tyrosine Kinase Inhibitors Industry Volume (K Unit) Forecast, by Application 2019 & 2032
- Table 29: Mexico Tyrosine Kinase Inhibitors Industry Revenue (Million) Forecast, by Application 2019 & 2032
- Table 30: Mexico Tyrosine Kinase Inhibitors Industry Volume (K Unit) Forecast, by Application 2019 & 2032
- Table 31: Global Tyrosine Kinase Inhibitors Industry Revenue Million Forecast, by Type 2019 & 2032
- Table 32: Global Tyrosine Kinase Inhibitors Industry Volume K Unit Forecast, by Type 2019 & 2032
- Table 33: Global Tyrosine Kinase Inhibitors Industry Revenue Million Forecast, by Application 2019 & 2032
- Table 34: Global Tyrosine Kinase Inhibitors Industry Volume K Unit Forecast, by Application 2019 & 2032
- Table 35: Global Tyrosine Kinase Inhibitors Industry Revenue Million Forecast, by Country 2019 & 2032
- Table 36: Global Tyrosine Kinase Inhibitors Industry Volume K Unit Forecast, by Country 2019 & 2032
- Table 37: Germany Tyrosine Kinase Inhibitors Industry Revenue (Million) Forecast, by Application 2019 & 2032
- Table 38: Germany Tyrosine Kinase Inhibitors Industry Volume (K Unit) Forecast, by Application 2019 & 2032
- Table 39: United Kingdom Tyrosine Kinase Inhibitors Industry Revenue (Million) Forecast, by Application 2019 & 2032
- Table 40: United Kingdom Tyrosine Kinase Inhibitors Industry Volume (K Unit) Forecast, by Application 2019 & 2032
- Table 41: France Tyrosine Kinase Inhibitors Industry Revenue (Million) Forecast, by Application 2019 & 2032
- Table 42: France Tyrosine Kinase Inhibitors Industry Volume (K Unit) Forecast, by Application 2019 & 2032
- Table 43: Italy Tyrosine Kinase Inhibitors Industry Revenue (Million) Forecast, by Application 2019 & 2032
- Table 44: Italy Tyrosine Kinase Inhibitors Industry Volume (K Unit) Forecast, by Application 2019 & 2032
- Table 45: Spain Tyrosine Kinase Inhibitors Industry Revenue (Million) Forecast, by Application 2019 & 2032
- Table 46: Spain Tyrosine Kinase Inhibitors Industry Volume (K Unit) Forecast, by Application 2019 & 2032
- Table 47: Rest of Europe Tyrosine Kinase Inhibitors Industry Revenue (Million) Forecast, by Application 2019 & 2032
- Table 48: Rest of Europe Tyrosine Kinase Inhibitors Industry Volume (K Unit) Forecast, by Application 2019 & 2032
- Table 49: Global Tyrosine Kinase Inhibitors Industry Revenue Million Forecast, by Type 2019 & 2032
- Table 50: Global Tyrosine Kinase Inhibitors Industry Volume K Unit Forecast, by Type 2019 & 2032
- Table 51: Global Tyrosine Kinase Inhibitors Industry Revenue Million Forecast, by Application 2019 & 2032
- Table 52: Global Tyrosine Kinase Inhibitors Industry Volume K Unit Forecast, by Application 2019 & 2032
- Table 53: Global Tyrosine Kinase Inhibitors Industry Revenue Million Forecast, by Country 2019 & 2032
- Table 54: Global Tyrosine Kinase Inhibitors Industry Volume K Unit Forecast, by Country 2019 & 2032
- Table 55: China Tyrosine Kinase Inhibitors Industry Revenue (Million) Forecast, by Application 2019 & 2032
- Table 56: China Tyrosine Kinase Inhibitors Industry Volume (K Unit) Forecast, by Application 2019 & 2032
- Table 57: Japan Tyrosine Kinase Inhibitors Industry Revenue (Million) Forecast, by Application 2019 & 2032
- Table 58: Japan Tyrosine Kinase Inhibitors Industry Volume (K Unit) Forecast, by Application 2019 & 2032
- Table 59: India Tyrosine Kinase Inhibitors Industry Revenue (Million) Forecast, by Application 2019 & 2032
- Table 60: India Tyrosine Kinase Inhibitors Industry Volume (K Unit) Forecast, by Application 2019 & 2032
- Table 61: Australia Tyrosine Kinase Inhibitors Industry Revenue (Million) Forecast, by Application 2019 & 2032
- Table 62: Australia Tyrosine Kinase Inhibitors Industry Volume (K Unit) Forecast, by Application 2019 & 2032
- Table 63: South Korea Tyrosine Kinase Inhibitors Industry Revenue (Million) Forecast, by Application 2019 & 2032
- Table 64: South Korea Tyrosine Kinase Inhibitors Industry Volume (K Unit) Forecast, by Application 2019 & 2032
- Table 65: Rest of Asia Pacific Tyrosine Kinase Inhibitors Industry Revenue (Million) Forecast, by Application 2019 & 2032
- Table 66: Rest of Asia Pacific Tyrosine Kinase Inhibitors Industry Volume (K Unit) Forecast, by Application 2019 & 2032
- Table 67: Global Tyrosine Kinase Inhibitors Industry Revenue Million Forecast, by Type 2019 & 2032
- Table 68: Global Tyrosine Kinase Inhibitors Industry Volume K Unit Forecast, by Type 2019 & 2032
- Table 69: Global Tyrosine Kinase Inhibitors Industry Revenue Million Forecast, by Application 2019 & 2032
- Table 70: Global Tyrosine Kinase Inhibitors Industry Volume K Unit Forecast, by Application 2019 & 2032
- Table 71: Global Tyrosine Kinase Inhibitors Industry Revenue Million Forecast, by Country 2019 & 2032
- Table 72: Global Tyrosine Kinase Inhibitors Industry Volume K Unit Forecast, by Country 2019 & 2032
- Table 73: GCC Tyrosine Kinase Inhibitors Industry Revenue (Million) Forecast, by Application 2019 & 2032
- Table 74: GCC Tyrosine Kinase Inhibitors Industry Volume (K Unit) Forecast, by Application 2019 & 2032
- Table 75: South Africa Tyrosine Kinase Inhibitors Industry Revenue (Million) Forecast, by Application 2019 & 2032
- Table 76: South Africa Tyrosine Kinase Inhibitors Industry Volume (K Unit) Forecast, by Application 2019 & 2032
- Table 77: Rest of Middle East and Africa Tyrosine Kinase Inhibitors Industry Revenue (Million) Forecast, by Application 2019 & 2032
- Table 78: Rest of Middle East and Africa Tyrosine Kinase Inhibitors Industry Volume (K Unit) Forecast, by Application 2019 & 2032
- Table 79: Global Tyrosine Kinase Inhibitors Industry Revenue Million Forecast, by Type 2019 & 2032
- Table 80: Global Tyrosine Kinase Inhibitors Industry Volume K Unit Forecast, by Type 2019 & 2032
- Table 81: Global Tyrosine Kinase Inhibitors Industry Revenue Million Forecast, by Application 2019 & 2032
- Table 82: Global Tyrosine Kinase Inhibitors Industry Volume K Unit Forecast, by Application 2019 & 2032
- Table 83: Global Tyrosine Kinase Inhibitors Industry Revenue Million Forecast, by Country 2019 & 2032
- Table 84: Global Tyrosine Kinase Inhibitors Industry Volume K Unit Forecast, by Country 2019 & 2032
- Table 85: Brazil Tyrosine Kinase Inhibitors Industry Revenue (Million) Forecast, by Application 2019 & 2032
- Table 86: Brazil Tyrosine Kinase Inhibitors Industry Volume (K Unit) Forecast, by Application 2019 & 2032
- Table 87: Argentina Tyrosine Kinase Inhibitors Industry Revenue (Million) Forecast, by Application 2019 & 2032
- Table 88: Argentina Tyrosine Kinase Inhibitors Industry Volume (K Unit) Forecast, by Application 2019 & 2032
- Table 89: Rest of South America Tyrosine Kinase Inhibitors Industry Revenue (Million) Forecast, by Application 2019 & 2032
- Table 90: Rest of South America Tyrosine Kinase Inhibitors Industry Volume (K Unit) Forecast, by Application 2019 & 2032
Frequently Asked Questions
1. What is the projected Compound Annual Growth Rate (CAGR) of the Tyrosine Kinase Inhibitors Industry?
The projected CAGR is approximately 8.37%.
2. Which companies are prominent players in the Tyrosine Kinase Inhibitors Industry?
Key companies in the market include Spectrum Pharmaceuticals Inc, Jiangsu Hansoh Pharmaceutical Group Co Ltd, Takeda Pharmaceutical Company Limited , Bayer AG, Novartis AG, F Hoffmann-La Roche Ltd, AstraZeneca PLC, Eli Lilly and Company, Johnson and Johnson, Eisai Co Ltd, Boehringer Ingelheim International, Bristol-Myers Squibb Company, Pfizer Inc.
3. What are the main segments of the Tyrosine Kinase Inhibitors Industry?
The market segments include Type, Application.
4. Can you provide details about the market size?
The market size is estimated to be USD 62.13 Million as of 2022.
5. What are some drivers contributing to market growth?
Increasing Prevalence of Cancer; Growing Research Activities and Investment in Tyrosine Kinase Inhibitors.
6. What are the notable trends driving market growth?
Breast Cancer Segment is Expected to Hold a Significant Market Share Over the Forecast Period.
7. Are there any restraints impacting market growth?
High Cost of Therapy.
8. Can you provide examples of recent developments in the market?
In June 2022, The European Commission approved capmatinib (Tabrecta), a tyrosine kinase inhibitor, as a single agent for the treatment of patients with MET exon14 skipping (METex14) altered advanced non-small cell lung cancer (NSCLC) who require systemic therapy following prior treatment with immunotherapy and/or platinum-based chemotherapy.
9. What pricing options are available for accessing the report?
Pricing options include single-user, multi-user, and enterprise licenses priced at USD 4750, USD 5250, and USD 8750 respectively.
10. Is the market size provided in terms of value or volume?
The market size is provided in terms of value, measured in Million and volume, measured in K Unit.
11. Are there any specific market keywords associated with the report?
Yes, the market keyword associated with the report is "Tyrosine Kinase Inhibitors Industry," which aids in identifying and referencing the specific market segment covered.
12. How do I determine which pricing option suits my needs best?
The pricing options vary based on user requirements and access needs. Individual users may opt for single-user licenses, while businesses requiring broader access may choose multi-user or enterprise licenses for cost-effective access to the report.
13. Are there any additional resources or data provided in the Tyrosine Kinase Inhibitors Industry report?
While the report offers comprehensive insights, it's advisable to review the specific contents or supplementary materials provided to ascertain if additional resources or data are available.
14. How can I stay updated on further developments or reports in the Tyrosine Kinase Inhibitors Industry?
To stay informed about further developments, trends, and reports in the Tyrosine Kinase Inhibitors Industry, consider subscribing to industry newsletters, following relevant companies and organizations, or regularly checking reputable industry news sources and publications.
Methodology
Step 1 - Identification of Relevant Samples Size from Population Database


Step 2 - Approaches for Defining Global Market Size (Value, Volume* & Price*)

Note*: In applicable scenarios
Step 3 - Data Sources
Primary Research
- Web Analytics
- Survey Reports
- Research Institute
- Latest Research Reports
- Opinion Leaders
Secondary Research
- Annual Reports
- White Paper
- Latest Press Release
- Industry Association
- Paid Database
- Investor Presentations

Step 4 - Data Triangulation
Involves using different sources of information in order to increase the validity of a study
These sources are likely to be stakeholders in a program - participants, other researchers, program staff, other community members, and so on.
Then we put all data in single framework & apply various statistical tools to find out the dynamic on the market.
During the analysis stage, feedback from the stakeholder groups would be compared to determine areas of agreement as well as areas of divergence
