

Key Insights
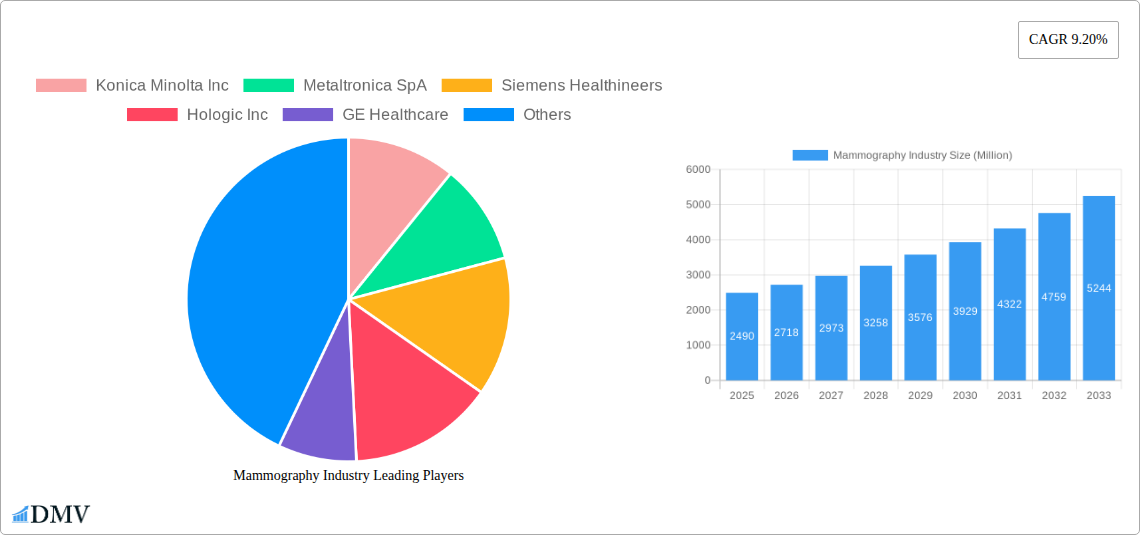
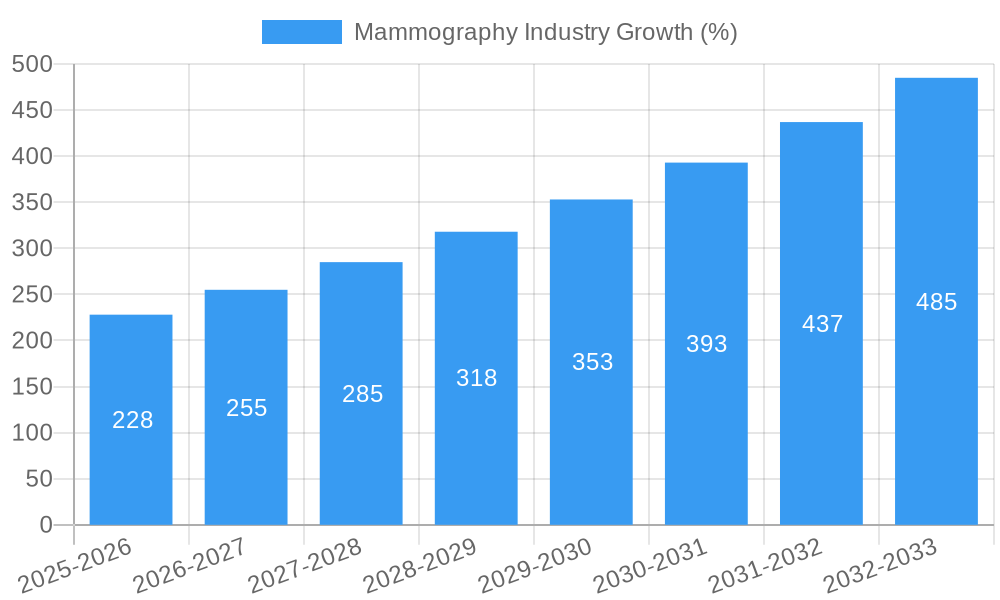
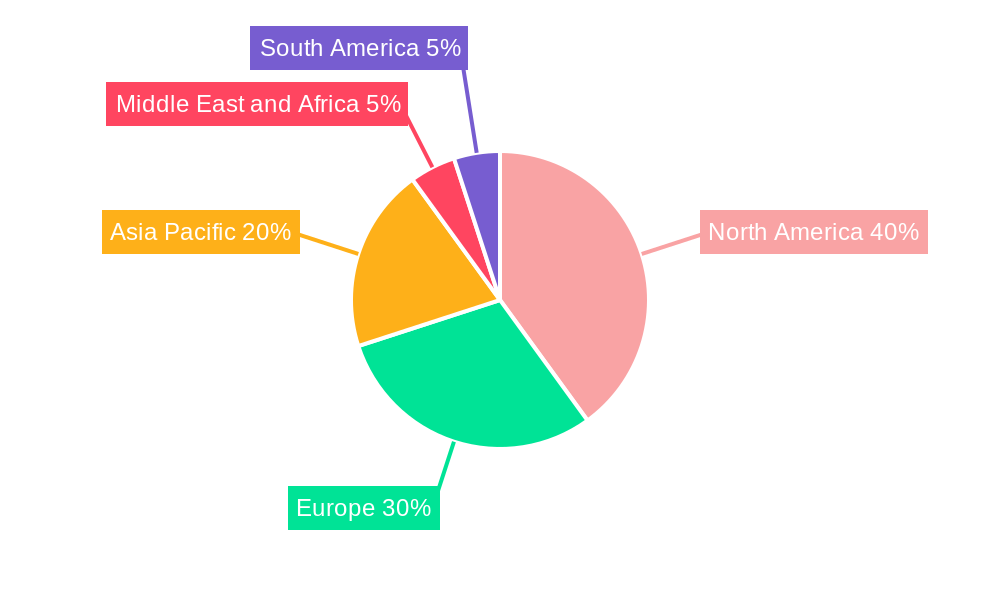
The global mammography market, valued at $2.49 billion in 2025, is projected to experience robust growth, driven by a rising prevalence of breast cancer, technological advancements in digital mammography and tomosynthesis, and increasing government initiatives promoting early detection programs. The market's Compound Annual Growth Rate (CAGR) of 9.20% from 2025 to 2033 indicates significant expansion potential. Key growth drivers include the increasing adoption of digital mammography systems offering superior image quality and efficient workflow compared to analog systems. The rising preference for breast tomosynthesis, providing 3D imaging for improved lesion detection and reduced false positives, further fuels market expansion. Growth is also propelled by the increasing number of women undergoing screening and diagnostic mammograms, alongside the expansion of healthcare infrastructure, especially in emerging economies. However, high equipment costs and the need for specialized personnel can restrain market growth in certain regions. The market is segmented by product type (digital, analog, tomosynthesis, other) and end-user (hospitals, specialty clinics, diagnostic centers). North America currently holds a significant market share due to high technological adoption and advanced healthcare infrastructure, but Asia Pacific is poised for substantial growth driven by rising awareness and increasing disposable incomes.
The competitive landscape is characterized by major players such as Hologic, Siemens Healthineers, GE Healthcare, and Fujifilm, constantly innovating to enhance image quality, reduce radiation exposure, and improve diagnostic accuracy. Strategic collaborations, mergers, and acquisitions are expected to shape the market dynamics in the coming years. The increasing demand for advanced features like AI-powered image analysis and remote diagnostics will create further opportunities for market expansion. Furthermore, the focus on improving patient experience through comfortable and efficient procedures will also be a key factor influencing market growth. The forecast period of 2025-2033 offers promising opportunities for market players, particularly those focusing on technological advancements and catering to the needs of developing economies. Continued investments in research and development, along with a focus on personalized medicine, will drive the future of the mammography market.
Mammography Industry Market Report: 2019-2033
This comprehensive report provides an in-depth analysis of the global mammography industry, covering market size, growth trends, key players, and future prospects from 2019 to 2033. The study period spans 2019-2024 (historical period), with 2025 as the base and estimated year, and a forecast period of 2025-2033. This report is invaluable for stakeholders seeking to understand the dynamics of this crucial sector of healthcare technology. The global market is estimated to be worth xx Million in 2025 and is projected to reach xx Million by 2033.
Mammography Industry Market Composition & Trends
The global mammography market is characterized by a moderately concentrated landscape, with key players like Hologic Inc, GE Healthcare, and Siemens Healthineers holding significant market share. Market share distribution fluctuates based on technological advancements and strategic acquisitions. The estimated market share in 2025 is: Hologic Inc (xx%), GE Healthcare (xx%), Siemens Healthineers (xx%), and others (xx%). Innovation is a major catalyst, driven by the demand for improved image quality, faster scan times, and AI-powered diagnostic tools. The regulatory landscape varies across regions, impacting market access and product approvals. Substitute products are limited, primarily due to the established efficacy and widespread acceptance of mammography as the gold standard for breast cancer screening. The industry witnesses continuous M&A activity, with deal values reaching several Million dollars annually, aimed at expanding market reach and strengthening product portfolios. End-users are primarily hospitals, specialty clinics, and diagnostic centers, with hospitals accounting for the largest segment.
- Market Concentration: Moderately concentrated, with top players holding significant shares.
- Innovation Catalysts: Improved image quality, faster scan times, AI-powered diagnostics.
- Regulatory Landscape: Varies across regions, affecting market access and approvals.
- Substitute Products: Limited, with mammography remaining the primary screening method.
- M&A Activity: Significant, driving market consolidation and expansion. Deal values in recent years have averaged xx Million annually.
- End-User Profile: Hospitals (largest segment), specialty clinics, diagnostic centers.
Mammography Industry Evolution
The mammography market has experienced consistent growth over the past decade, driven by increasing breast cancer incidence, rising awareness about early detection, and technological advancements. Growth rates have averaged xx% annually during the historical period (2019-2024), and a similar rate is predicted for the forecast period. Technological advancements, such as the introduction of digital mammography, breast tomosynthesis, and AI-powered image analysis, have significantly improved diagnostic accuracy and efficiency. This has led to increased adoption of advanced systems, with digital mammography becoming the dominant technology. Consumer demand is shifting towards faster, more accurate, and less invasive screening methods, prompting further innovation in this space. The adoption of tomosynthesis is increasing at a rate of xx% annually.
Leading Regions, Countries, or Segments in Mammography Industry
North America currently holds the largest market share, driven by high breast cancer incidence rates, advanced healthcare infrastructure, and high adoption rates of advanced mammography technologies. Within product types, digital systems dominate, with breast tomosynthesis witnessing strong growth. Hospitals form the largest end-user segment due to their comprehensive services and large patient volume.
- Key Drivers for North American Dominance:
- High breast cancer incidence rates.
- Advanced healthcare infrastructure and strong investment in medical technology.
- High adoption of advanced imaging technologies.
- Digital Systems Dominance: Driven by superior image quality, efficiency, and ease of storage and sharing.
- Hospitals as Largest End-User Segment: Due to their comprehensive services and high patient volume.
- Strong Growth in Breast Tomosynthesis: Driven by its superior ability to detect subtle abnormalities and reduce callbacks.
Mammography Industry Product Innovations
Recent innovations focus on enhancing image quality, reducing radiation dose, and integrating AI for improved diagnostic accuracy. Digital breast tomosynthesis provides 3D images, improving detection of subtle lesions. AI-powered tools enhance image analysis, reduce false positives, and improve workflow efficiency. Unique selling propositions include faster scan times, improved image quality, and reduced radiation exposure.
Propelling Factors for Mammography Industry Growth
Several factors drive market growth, including: rising breast cancer incidence globally; increased awareness about early detection and screening; technological advancements in imaging techniques (digital mammography, tomosynthesis); government initiatives and funding for breast cancer prevention and treatment; and expanding healthcare infrastructure in developing countries.
Obstacles in the Mammography Industry Market
Key challenges include: high initial investment costs for advanced systems; stringent regulatory requirements for approval and reimbursement; potential supply chain disruptions impacting equipment availability; and intense competition from established players and new entrants, all impacting market penetration and profitability.
Future Opportunities in Mammography Industry
Future opportunities lie in: expanding into emerging markets with growing healthcare infrastructure; developing AI-powered diagnostic tools for improved accuracy and efficiency; integrating mammography with other imaging modalities for comprehensive breast health assessments; and focusing on personalized breast care solutions tailored to individual risk profiles.
Major Players in the Mammography Industry Ecosystem
- Konica Minolta Inc
- Metaltronica SpA
- Siemens Healthineers
- Hologic Inc
- GE Healthcare
- Carestream Health
- Koninklijke Philips NV
- General Medical Merate SpA
- Planmed Oy
- Fujifilm Holdings Corporation
- Canon Medical Systems
Key Developments in Mammography Industry
- May 2022: Volpara Health launched updated products for its personalized breast care platform at the SBI/ACR Breast Imaging Symposium 2022, featuring AI-driven tools for mammography quality, density measurements, and cancer risk assessment.
- January 2022: ScreenPoint Medical expanded its reach to the US and 30 countries with its AI Breast Care system, Transpara.
Strategic Mammography Industry Market Forecast
The mammography market is poised for continued growth, driven by technological innovation, increasing demand for advanced screening methods, and expanding healthcare access globally. The integration of AI and the development of personalized breast care solutions will shape the future market landscape. Opportunities exist in emerging markets and in the development of new diagnostic tools that enhance accuracy and efficiency, further driving market expansion and value creation.
Mammography Industry Segmentation
-
1. Product Type
- 1.1. Digital Systems
- 1.2. Analog Systems
- 1.3. Breast Tomosynthesis
- 1.4. Other Product Types
-
2. End Users
- 2.1. Hospitals
- 2.2. Specialty Clinics
- 2.3. Diagnostic Centers
Mammography Industry Segmentation By Geography
-
1. North America
- 1.1. United States
- 1.2. Canada
- 1.3. Mexico
-
2. Europe
- 2.1. Germany
- 2.2. United Kingdom
- 2.3. France
- 2.4. Italy
- 2.5. Spain
- 2.6. Rest of Europe
-
3. Asia Pacific
- 3.1. China
- 3.2. Japan
- 3.3. India
- 3.4. Australia
- 3.5. South Korea
- 3.6. Rest of Asia Pacific
-
4. Middle East and Africa
- 4.1. GCC
- 4.2. South Africa
- 4.3. Rest of Middle East and Africa
-
5. South America
- 5.1. Brazil
- 5.2. Argentina
- 5.3. Rest of South America
Mammography Industry REPORT HIGHLIGHTS
| Aspects | Details |
|---|---|
| Study Period | 2019-2033 |
| Base Year | 2024 |
| Estimated Year | 2025 |
| Forecast Period | 2025-2033 |
| Historical Period | 2019-2024 |
| Growth Rate | CAGR of 9.20% from 2019-2033 |
| Segmentation |
|
Table of Contents
- 1. Introduction
- 1.1. Research Scope
- 1.2. Market Segmentation
- 1.3. Research Methodology
- 1.4. Definitions and Assumptions
- 2. Executive Summary
- 2.1. Introduction
- 3. Market Dynamics
- 3.1. Introduction
- 3.2. Market Drivers
- 3.2.1. Growing Burden of Breast Cancer; Technological Advancements in the Field of Breast Imaging; Investment from Various Organizations in Breast Cancer Screening Campaigns
- 3.3. Market Restrains
- 3.3.1. Risk of Adverse Effects from Radiation Exposure; Reduction in Reimbursement
- 3.4. Market Trends
- 3.4.1. The Digital Mammography Segment is Expected to Account for the Large Market Share During the Forecast Period
- 4. Market Factor Analysis
- 4.1. Porters Five Forces
- 4.2. Supply/Value Chain
- 4.3. PESTEL analysis
- 4.4. Market Entropy
- 4.5. Patent/Trademark Analysis
- 5. Global Mammography Industry Analysis, Insights and Forecast, 2019-2031
- 5.1. Market Analysis, Insights and Forecast - by Product Type
- 5.1.1. Digital Systems
- 5.1.2. Analog Systems
- 5.1.3. Breast Tomosynthesis
- 5.1.4. Other Product Types
- 5.2. Market Analysis, Insights and Forecast - by End Users
- 5.2.1. Hospitals
- 5.2.2. Specialty Clinics
- 5.2.3. Diagnostic Centers
- 5.3. Market Analysis, Insights and Forecast - by Region
- 5.3.1. North America
- 5.3.2. Europe
- 5.3.3. Asia Pacific
- 5.3.4. Middle East and Africa
- 5.3.5. South America
- 5.1. Market Analysis, Insights and Forecast - by Product Type
- 6. North America Mammography Industry Analysis, Insights and Forecast, 2019-2031
- 6.1. Market Analysis, Insights and Forecast - by Product Type
- 6.1.1. Digital Systems
- 6.1.2. Analog Systems
- 6.1.3. Breast Tomosynthesis
- 6.1.4. Other Product Types
- 6.2. Market Analysis, Insights and Forecast - by End Users
- 6.2.1. Hospitals
- 6.2.2. Specialty Clinics
- 6.2.3. Diagnostic Centers
- 6.1. Market Analysis, Insights and Forecast - by Product Type
- 7. Europe Mammography Industry Analysis, Insights and Forecast, 2019-2031
- 7.1. Market Analysis, Insights and Forecast - by Product Type
- 7.1.1. Digital Systems
- 7.1.2. Analog Systems
- 7.1.3. Breast Tomosynthesis
- 7.1.4. Other Product Types
- 7.2. Market Analysis, Insights and Forecast - by End Users
- 7.2.1. Hospitals
- 7.2.2. Specialty Clinics
- 7.2.3. Diagnostic Centers
- 7.1. Market Analysis, Insights and Forecast - by Product Type
- 8. Asia Pacific Mammography Industry Analysis, Insights and Forecast, 2019-2031
- 8.1. Market Analysis, Insights and Forecast - by Product Type
- 8.1.1. Digital Systems
- 8.1.2. Analog Systems
- 8.1.3. Breast Tomosynthesis
- 8.1.4. Other Product Types
- 8.2. Market Analysis, Insights and Forecast - by End Users
- 8.2.1. Hospitals
- 8.2.2. Specialty Clinics
- 8.2.3. Diagnostic Centers
- 8.1. Market Analysis, Insights and Forecast - by Product Type
- 9. Middle East and Africa Mammography Industry Analysis, Insights and Forecast, 2019-2031
- 9.1. Market Analysis, Insights and Forecast - by Product Type
- 9.1.1. Digital Systems
- 9.1.2. Analog Systems
- 9.1.3. Breast Tomosynthesis
- 9.1.4. Other Product Types
- 9.2. Market Analysis, Insights and Forecast - by End Users
- 9.2.1. Hospitals
- 9.2.2. Specialty Clinics
- 9.2.3. Diagnostic Centers
- 9.1. Market Analysis, Insights and Forecast - by Product Type
- 10. South America Mammography Industry Analysis, Insights and Forecast, 2019-2031
- 10.1. Market Analysis, Insights and Forecast - by Product Type
- 10.1.1. Digital Systems
- 10.1.2. Analog Systems
- 10.1.3. Breast Tomosynthesis
- 10.1.4. Other Product Types
- 10.2. Market Analysis, Insights and Forecast - by End Users
- 10.2.1. Hospitals
- 10.2.2. Specialty Clinics
- 10.2.3. Diagnostic Centers
- 10.1. Market Analysis, Insights and Forecast - by Product Type
- 11. North America Mammography Industry Analysis, Insights and Forecast, 2019-2031
- 11.1. Market Analysis, Insights and Forecast - By Country/Sub-region
- 11.1.1 United States
- 11.1.2 Canada
- 11.1.3 Mexico
- 12. Europe Mammography Industry Analysis, Insights and Forecast, 2019-2031
- 12.1. Market Analysis, Insights and Forecast - By Country/Sub-region
- 12.1.1 Germany
- 12.1.2 United Kingdom
- 12.1.3 France
- 12.1.4 Italy
- 12.1.5 Spain
- 12.1.6 Rest of Europe
- 13. Asia Pacific Mammography Industry Analysis, Insights and Forecast, 2019-2031
- 13.1. Market Analysis, Insights and Forecast - By Country/Sub-region
- 13.1.1 China
- 13.1.2 Japan
- 13.1.3 India
- 13.1.4 Australia
- 13.1.5 South Korea
- 13.1.6 Rest of Asia Pacific
- 14. Middle East and Africa Mammography Industry Analysis, Insights and Forecast, 2019-2031
- 14.1. Market Analysis, Insights and Forecast - By Country/Sub-region
- 14.1.1 GCC
- 14.1.2 South Africa
- 14.1.3 Rest of Middle East and Africa
- 15. South America Mammography Industry Analysis, Insights and Forecast, 2019-2031
- 15.1. Market Analysis, Insights and Forecast - By Country/Sub-region
- 15.1.1 Brazil
- 15.1.2 Argentina
- 15.1.3 Rest of South America
- 16. Competitive Analysis
- 16.1. Global Market Share Analysis 2024
- 16.2. Company Profiles
- 16.2.1 Konica Minolta Inc
- 16.2.1.1. Overview
- 16.2.1.2. Products
- 16.2.1.3. SWOT Analysis
- 16.2.1.4. Recent Developments
- 16.2.1.5. Financials (Based on Availability)
- 16.2.2 Metaltronica SpA
- 16.2.2.1. Overview
- 16.2.2.2. Products
- 16.2.2.3. SWOT Analysis
- 16.2.2.4. Recent Developments
- 16.2.2.5. Financials (Based on Availability)
- 16.2.3 Siemens Healthineers
- 16.2.3.1. Overview
- 16.2.3.2. Products
- 16.2.3.3. SWOT Analysis
- 16.2.3.4. Recent Developments
- 16.2.3.5. Financials (Based on Availability)
- 16.2.4 Hologic Inc
- 16.2.4.1. Overview
- 16.2.4.2. Products
- 16.2.4.3. SWOT Analysis
- 16.2.4.4. Recent Developments
- 16.2.4.5. Financials (Based on Availability)
- 16.2.5 GE Healthcare
- 16.2.5.1. Overview
- 16.2.5.2. Products
- 16.2.5.3. SWOT Analysis
- 16.2.5.4. Recent Developments
- 16.2.5.5. Financials (Based on Availability)
- 16.2.6 Carestream Health
- 16.2.6.1. Overview
- 16.2.6.2. Products
- 16.2.6.3. SWOT Analysis
- 16.2.6.4. Recent Developments
- 16.2.6.5. Financials (Based on Availability)
- 16.2.7 Koninklijke Philips NV
- 16.2.7.1. Overview
- 16.2.7.2. Products
- 16.2.7.3. SWOT Analysis
- 16.2.7.4. Recent Developments
- 16.2.7.5. Financials (Based on Availability)
- 16.2.8 General Medical Merate SpA
- 16.2.8.1. Overview
- 16.2.8.2. Products
- 16.2.8.3. SWOT Analysis
- 16.2.8.4. Recent Developments
- 16.2.8.5. Financials (Based on Availability)
- 16.2.9 Planmed Oy
- 16.2.9.1. Overview
- 16.2.9.2. Products
- 16.2.9.3. SWOT Analysis
- 16.2.9.4. Recent Developments
- 16.2.9.5. Financials (Based on Availability)
- 16.2.10 Fujifilm Holdings Corporation
- 16.2.10.1. Overview
- 16.2.10.2. Products
- 16.2.10.3. SWOT Analysis
- 16.2.10.4. Recent Developments
- 16.2.10.5. Financials (Based on Availability)
- 16.2.11 Canon Medical Systems
- 16.2.11.1. Overview
- 16.2.11.2. Products
- 16.2.11.3. SWOT Analysis
- 16.2.11.4. Recent Developments
- 16.2.11.5. Financials (Based on Availability)
- 16.2.1 Konica Minolta Inc
List of Figures
- Figure 1: Global Mammography Industry Revenue Breakdown (Million, %) by Region 2024 & 2032
- Figure 2: North America Mammography Industry Revenue (Million), by Country 2024 & 2032
- Figure 3: North America Mammography Industry Revenue Share (%), by Country 2024 & 2032
- Figure 4: Europe Mammography Industry Revenue (Million), by Country 2024 & 2032
- Figure 5: Europe Mammography Industry Revenue Share (%), by Country 2024 & 2032
- Figure 6: Asia Pacific Mammography Industry Revenue (Million), by Country 2024 & 2032
- Figure 7: Asia Pacific Mammography Industry Revenue Share (%), by Country 2024 & 2032
- Figure 8: Middle East and Africa Mammography Industry Revenue (Million), by Country 2024 & 2032
- Figure 9: Middle East and Africa Mammography Industry Revenue Share (%), by Country 2024 & 2032
- Figure 10: South America Mammography Industry Revenue (Million), by Country 2024 & 2032
- Figure 11: South America Mammography Industry Revenue Share (%), by Country 2024 & 2032
- Figure 12: North America Mammography Industry Revenue (Million), by Product Type 2024 & 2032
- Figure 13: North America Mammography Industry Revenue Share (%), by Product Type 2024 & 2032
- Figure 14: North America Mammography Industry Revenue (Million), by End Users 2024 & 2032
- Figure 15: North America Mammography Industry Revenue Share (%), by End Users 2024 & 2032
- Figure 16: North America Mammography Industry Revenue (Million), by Country 2024 & 2032
- Figure 17: North America Mammography Industry Revenue Share (%), by Country 2024 & 2032
- Figure 18: Europe Mammography Industry Revenue (Million), by Product Type 2024 & 2032
- Figure 19: Europe Mammography Industry Revenue Share (%), by Product Type 2024 & 2032
- Figure 20: Europe Mammography Industry Revenue (Million), by End Users 2024 & 2032
- Figure 21: Europe Mammography Industry Revenue Share (%), by End Users 2024 & 2032
- Figure 22: Europe Mammography Industry Revenue (Million), by Country 2024 & 2032
- Figure 23: Europe Mammography Industry Revenue Share (%), by Country 2024 & 2032
- Figure 24: Asia Pacific Mammography Industry Revenue (Million), by Product Type 2024 & 2032
- Figure 25: Asia Pacific Mammography Industry Revenue Share (%), by Product Type 2024 & 2032
- Figure 26: Asia Pacific Mammography Industry Revenue (Million), by End Users 2024 & 2032
- Figure 27: Asia Pacific Mammography Industry Revenue Share (%), by End Users 2024 & 2032
- Figure 28: Asia Pacific Mammography Industry Revenue (Million), by Country 2024 & 2032
- Figure 29: Asia Pacific Mammography Industry Revenue Share (%), by Country 2024 & 2032
- Figure 30: Middle East and Africa Mammography Industry Revenue (Million), by Product Type 2024 & 2032
- Figure 31: Middle East and Africa Mammography Industry Revenue Share (%), by Product Type 2024 & 2032
- Figure 32: Middle East and Africa Mammography Industry Revenue (Million), by End Users 2024 & 2032
- Figure 33: Middle East and Africa Mammography Industry Revenue Share (%), by End Users 2024 & 2032
- Figure 34: Middle East and Africa Mammography Industry Revenue (Million), by Country 2024 & 2032
- Figure 35: Middle East and Africa Mammography Industry Revenue Share (%), by Country 2024 & 2032
- Figure 36: South America Mammography Industry Revenue (Million), by Product Type 2024 & 2032
- Figure 37: South America Mammography Industry Revenue Share (%), by Product Type 2024 & 2032
- Figure 38: South America Mammography Industry Revenue (Million), by End Users 2024 & 2032
- Figure 39: South America Mammography Industry Revenue Share (%), by End Users 2024 & 2032
- Figure 40: South America Mammography Industry Revenue (Million), by Country 2024 & 2032
- Figure 41: South America Mammography Industry Revenue Share (%), by Country 2024 & 2032
List of Tables
- Table 1: Global Mammography Industry Revenue Million Forecast, by Region 2019 & 2032
- Table 2: Global Mammography Industry Revenue Million Forecast, by Product Type 2019 & 2032
- Table 3: Global Mammography Industry Revenue Million Forecast, by End Users 2019 & 2032
- Table 4: Global Mammography Industry Revenue Million Forecast, by Region 2019 & 2032
- Table 5: Global Mammography Industry Revenue Million Forecast, by Country 2019 & 2032
- Table 6: United States Mammography Industry Revenue (Million) Forecast, by Application 2019 & 2032
- Table 7: Canada Mammography Industry Revenue (Million) Forecast, by Application 2019 & 2032
- Table 8: Mexico Mammography Industry Revenue (Million) Forecast, by Application 2019 & 2032
- Table 9: Global Mammography Industry Revenue Million Forecast, by Country 2019 & 2032
- Table 10: Germany Mammography Industry Revenue (Million) Forecast, by Application 2019 & 2032
- Table 11: United Kingdom Mammography Industry Revenue (Million) Forecast, by Application 2019 & 2032
- Table 12: France Mammography Industry Revenue (Million) Forecast, by Application 2019 & 2032
- Table 13: Italy Mammography Industry Revenue (Million) Forecast, by Application 2019 & 2032
- Table 14: Spain Mammography Industry Revenue (Million) Forecast, by Application 2019 & 2032
- Table 15: Rest of Europe Mammography Industry Revenue (Million) Forecast, by Application 2019 & 2032
- Table 16: Global Mammography Industry Revenue Million Forecast, by Country 2019 & 2032
- Table 17: China Mammography Industry Revenue (Million) Forecast, by Application 2019 & 2032
- Table 18: Japan Mammography Industry Revenue (Million) Forecast, by Application 2019 & 2032
- Table 19: India Mammography Industry Revenue (Million) Forecast, by Application 2019 & 2032
- Table 20: Australia Mammography Industry Revenue (Million) Forecast, by Application 2019 & 2032
- Table 21: South Korea Mammography Industry Revenue (Million) Forecast, by Application 2019 & 2032
- Table 22: Rest of Asia Pacific Mammography Industry Revenue (Million) Forecast, by Application 2019 & 2032
- Table 23: Global Mammography Industry Revenue Million Forecast, by Country 2019 & 2032
- Table 24: GCC Mammography Industry Revenue (Million) Forecast, by Application 2019 & 2032
- Table 25: South Africa Mammography Industry Revenue (Million) Forecast, by Application 2019 & 2032
- Table 26: Rest of Middle East and Africa Mammography Industry Revenue (Million) Forecast, by Application 2019 & 2032
- Table 27: Global Mammography Industry Revenue Million Forecast, by Country 2019 & 2032
- Table 28: Brazil Mammography Industry Revenue (Million) Forecast, by Application 2019 & 2032
- Table 29: Argentina Mammography Industry Revenue (Million) Forecast, by Application 2019 & 2032
- Table 30: Rest of South America Mammography Industry Revenue (Million) Forecast, by Application 2019 & 2032
- Table 31: Global Mammography Industry Revenue Million Forecast, by Product Type 2019 & 2032
- Table 32: Global Mammography Industry Revenue Million Forecast, by End Users 2019 & 2032
- Table 33: Global Mammography Industry Revenue Million Forecast, by Country 2019 & 2032
- Table 34: United States Mammography Industry Revenue (Million) Forecast, by Application 2019 & 2032
- Table 35: Canada Mammography Industry Revenue (Million) Forecast, by Application 2019 & 2032
- Table 36: Mexico Mammography Industry Revenue (Million) Forecast, by Application 2019 & 2032
- Table 37: Global Mammography Industry Revenue Million Forecast, by Product Type 2019 & 2032
- Table 38: Global Mammography Industry Revenue Million Forecast, by End Users 2019 & 2032
- Table 39: Global Mammography Industry Revenue Million Forecast, by Country 2019 & 2032
- Table 40: Germany Mammography Industry Revenue (Million) Forecast, by Application 2019 & 2032
- Table 41: United Kingdom Mammography Industry Revenue (Million) Forecast, by Application 2019 & 2032
- Table 42: France Mammography Industry Revenue (Million) Forecast, by Application 2019 & 2032
- Table 43: Italy Mammography Industry Revenue (Million) Forecast, by Application 2019 & 2032
- Table 44: Spain Mammography Industry Revenue (Million) Forecast, by Application 2019 & 2032
- Table 45: Rest of Europe Mammography Industry Revenue (Million) Forecast, by Application 2019 & 2032
- Table 46: Global Mammography Industry Revenue Million Forecast, by Product Type 2019 & 2032
- Table 47: Global Mammography Industry Revenue Million Forecast, by End Users 2019 & 2032
- Table 48: Global Mammography Industry Revenue Million Forecast, by Country 2019 & 2032
- Table 49: China Mammography Industry Revenue (Million) Forecast, by Application 2019 & 2032
- Table 50: Japan Mammography Industry Revenue (Million) Forecast, by Application 2019 & 2032
- Table 51: India Mammography Industry Revenue (Million) Forecast, by Application 2019 & 2032
- Table 52: Australia Mammography Industry Revenue (Million) Forecast, by Application 2019 & 2032
- Table 53: South Korea Mammography Industry Revenue (Million) Forecast, by Application 2019 & 2032
- Table 54: Rest of Asia Pacific Mammography Industry Revenue (Million) Forecast, by Application 2019 & 2032
- Table 55: Global Mammography Industry Revenue Million Forecast, by Product Type 2019 & 2032
- Table 56: Global Mammography Industry Revenue Million Forecast, by End Users 2019 & 2032
- Table 57: Global Mammography Industry Revenue Million Forecast, by Country 2019 & 2032
- Table 58: GCC Mammography Industry Revenue (Million) Forecast, by Application 2019 & 2032
- Table 59: South Africa Mammography Industry Revenue (Million) Forecast, by Application 2019 & 2032
- Table 60: Rest of Middle East and Africa Mammography Industry Revenue (Million) Forecast, by Application 2019 & 2032
- Table 61: Global Mammography Industry Revenue Million Forecast, by Product Type 2019 & 2032
- Table 62: Global Mammography Industry Revenue Million Forecast, by End Users 2019 & 2032
- Table 63: Global Mammography Industry Revenue Million Forecast, by Country 2019 & 2032
- Table 64: Brazil Mammography Industry Revenue (Million) Forecast, by Application 2019 & 2032
- Table 65: Argentina Mammography Industry Revenue (Million) Forecast, by Application 2019 & 2032
- Table 66: Rest of South America Mammography Industry Revenue (Million) Forecast, by Application 2019 & 2032
Frequently Asked Questions
1. What is the projected Compound Annual Growth Rate (CAGR) of the Mammography Industry?
The projected CAGR is approximately 9.20%.
2. Which companies are prominent players in the Mammography Industry?
Key companies in the market include Konica Minolta Inc, Metaltronica SpA, Siemens Healthineers, Hologic Inc, GE Healthcare, Carestream Health, Koninklijke Philips NV, General Medical Merate SpA, Planmed Oy, Fujifilm Holdings Corporation, Canon Medical Systems.
3. What are the main segments of the Mammography Industry?
The market segments include Product Type, End Users.
4. Can you provide details about the market size?
The market size is estimated to be USD 2.49 Million as of 2022.
5. What are some drivers contributing to market growth?
Growing Burden of Breast Cancer; Technological Advancements in the Field of Breast Imaging; Investment from Various Organizations in Breast Cancer Screening Campaigns.
6. What are the notable trends driving market growth?
The Digital Mammography Segment is Expected to Account for the Large Market Share During the Forecast Period.
7. Are there any restraints impacting market growth?
Risk of Adverse Effects from Radiation Exposure; Reduction in Reimbursement.
8. Can you provide examples of recent developments in the market?
In May 2022, Volpara Health introduced updated products for its integrated platform for the delivery of personalized breast care at the SBI/ACR Breast Imaging Symposium 2022. Volpara's AI-driven breast software tools provide mammography quality and reporting, volumetric breast density measurements, and cancer risk assessment.
9. What pricing options are available for accessing the report?
Pricing options include single-user, multi-user, and enterprise licenses priced at USD 4750, USD 5250, and USD 8750 respectively.
10. Is the market size provided in terms of value or volume?
The market size is provided in terms of value, measured in Million.
11. Are there any specific market keywords associated with the report?
Yes, the market keyword associated with the report is "Mammography Industry," which aids in identifying and referencing the specific market segment covered.
12. How do I determine which pricing option suits my needs best?
The pricing options vary based on user requirements and access needs. Individual users may opt for single-user licenses, while businesses requiring broader access may choose multi-user or enterprise licenses for cost-effective access to the report.
13. Are there any additional resources or data provided in the Mammography Industry report?
While the report offers comprehensive insights, it's advisable to review the specific contents or supplementary materials provided to ascertain if additional resources or data are available.
14. How can I stay updated on further developments or reports in the Mammography Industry?
To stay informed about further developments, trends, and reports in the Mammography Industry, consider subscribing to industry newsletters, following relevant companies and organizations, or regularly checking reputable industry news sources and publications.
Methodology
Step 1 - Identification of Relevant Samples Size from Population Database


Step 2 - Approaches for Defining Global Market Size (Value, Volume* & Price*)

Note*: In applicable scenarios
Step 3 - Data Sources
Primary Research
- Web Analytics
- Survey Reports
- Research Institute
- Latest Research Reports
- Opinion Leaders
Secondary Research
- Annual Reports
- White Paper
- Latest Press Release
- Industry Association
- Paid Database
- Investor Presentations

Step 4 - Data Triangulation
Involves using different sources of information in order to increase the validity of a study
These sources are likely to be stakeholders in a program - participants, other researchers, program staff, other community members, and so on.
Then we put all data in single framework & apply various statistical tools to find out the dynamic on the market.
During the analysis stage, feedback from the stakeholder groups would be compared to determine areas of agreement as well as areas of divergence
