

Key Insights
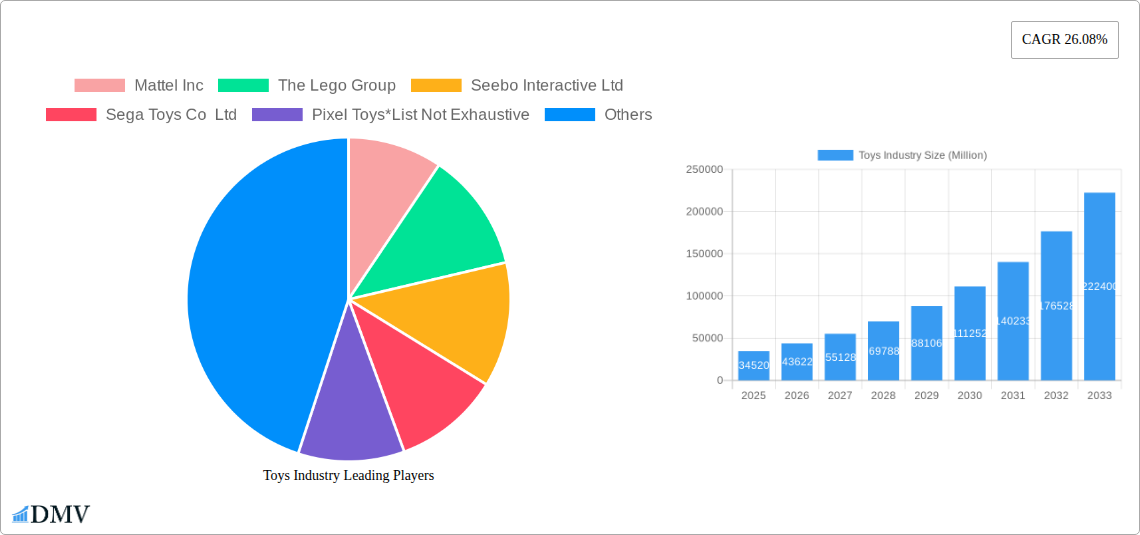
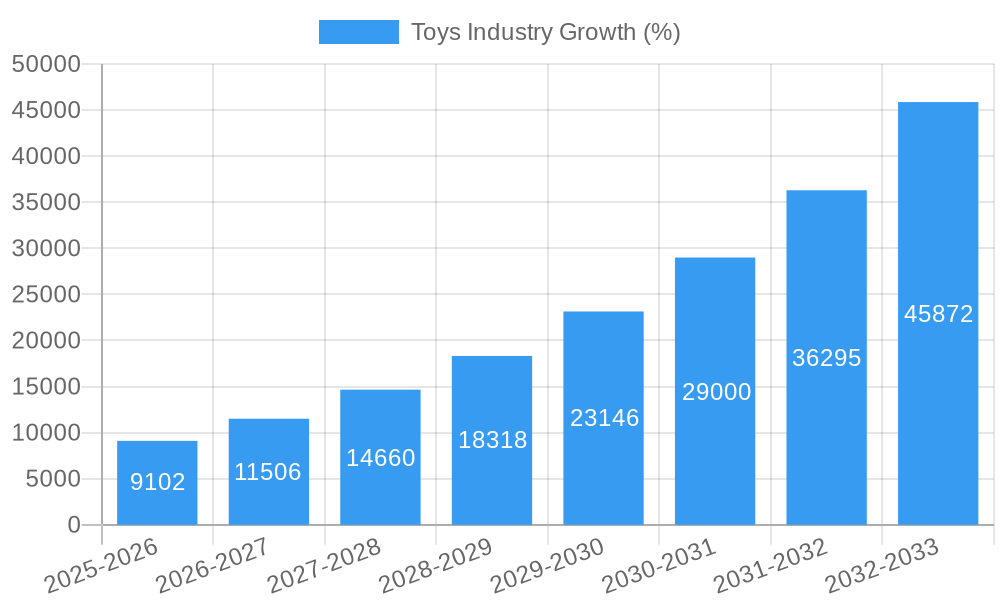
The global connected toys market, valued at $34.52 billion in 2025, is projected to experience robust growth, driven by a Compound Annual Growth Rate (CAGR) of 26.08% from 2025 to 2033. This expansion is fueled by several key factors. Firstly, the increasing penetration of smartphones and tablets, particularly among children, provides a readily available interface for interactive toys. Secondly, technological advancements in areas like Wi-Fi, Bluetooth, NFC, and RFID are enabling more sophisticated and engaging connected play experiences. Parents are increasingly drawn to educational and developmental benefits offered by these toys, further stimulating market demand. The diverse range of connected toys, from interactive learning tools to remote-controlled vehicles, caters to a broad spectrum of age groups and preferences. The market segmentation reveals a strong preference for smartphone-connected toys, reflecting the ubiquitous nature of smartphones. Online stores are leading the distribution channels, highlighting the convenience and reach of e-commerce. Major players like Mattel, Lego, and Sega Toys are at the forefront of innovation, continuously developing new products and features to maintain market competitiveness. Geographic growth is expected across all regions, with North America and Asia Pacific expected to remain key markets due to high levels of technology adoption and disposable income.
However, certain restraints could influence market growth. Concerns regarding data privacy and security related to children's data collected by connected toys represent a significant challenge. The high initial cost of connected toys compared to traditional toys could also limit market penetration, particularly in developing economies. Moreover, the reliance on technology and internet connectivity presents a barrier in regions with limited digital infrastructure. Future growth hinges on addressing these challenges through robust data security measures, competitive pricing strategies, and development of toys adaptable to varying levels of technological access. This involves creating innovative solutions and fostering a collaborative ecosystem between toy manufacturers, technology providers, and regulatory bodies to ensure responsible and sustainable growth of the connected toys market.
Toys Industry Market Report: 2019-2033
This comprehensive report provides an in-depth analysis of the global toys industry, forecasting market trends from 2019 to 2033. The study covers key market segments, leading players, technological advancements, and growth drivers, offering valuable insights for stakeholders across the value chain. With a base year of 2025 and an estimated year of 2025, this report provides crucial data for strategic decision-making. The market size is predicted to reach xx Million by 2033.
Toys Industry Market Composition & Trends
This section analyzes the competitive landscape, innovation drivers, regulatory environment, substitute products, and end-user profiles within the toys industry. The market exhibits moderate concentration, with key players such as Mattel Inc., The Lego Group, and Playmobil holding significant market share. However, the emergence of smaller, innovative companies like Seebo Interactive and Primo Toys is disrupting the traditional market structure.
- Market Share Distribution (2024): Mattel Inc. (xx%), The Lego Group (xx%), Playmobil (xx%), Others (xx%). These figures are estimates based on available data.
- M&A Activities (2019-2024): A total of xx Million in M&A deals were recorded during this period, primarily focused on acquiring smaller companies with specialized technologies or intellectual property.
- Innovation Catalysts: The rising demand for interactive and educational toys, coupled with advancements in artificial intelligence (AI) and augmented reality (AR), is driving innovation.
- Regulatory Landscape: Safety regulations and standards play a crucial role, particularly concerning materials and age appropriateness.
- Substitute Products: Digital entertainment, including video games and online platforms, pose a significant competitive threat.
- End-User Profiles: The primary end-users are children aged 0-14, with growing demand from parents seeking educational and developmental toys.
Toys Industry Industry Evolution
The toys industry is undergoing a significant transformation driven by technological advancements, shifting consumer preferences, and evolving play patterns. The historical period (2019-2024) witnessed a Compound Annual Growth Rate (CAGR) of xx%, primarily fueled by the increasing adoption of smart toys. The forecast period (2025-2033) is projected to see a CAGR of xx%, with considerable growth expected in the segments leveraging AI, AR, and VR technologies. The integration of smart devices, such as smartphones and tablets, is further accelerating market growth. Consumer demand is shifting towards toys that offer personalized experiences, educational value, and enhanced interactivity. The industry is increasingly focused on sustainability and ethical sourcing of materials. The growth is also influenced by the increasing disposable income and changing lifestyles across several key regions.
Leading Regions, Countries, or Segments in Toys Industry
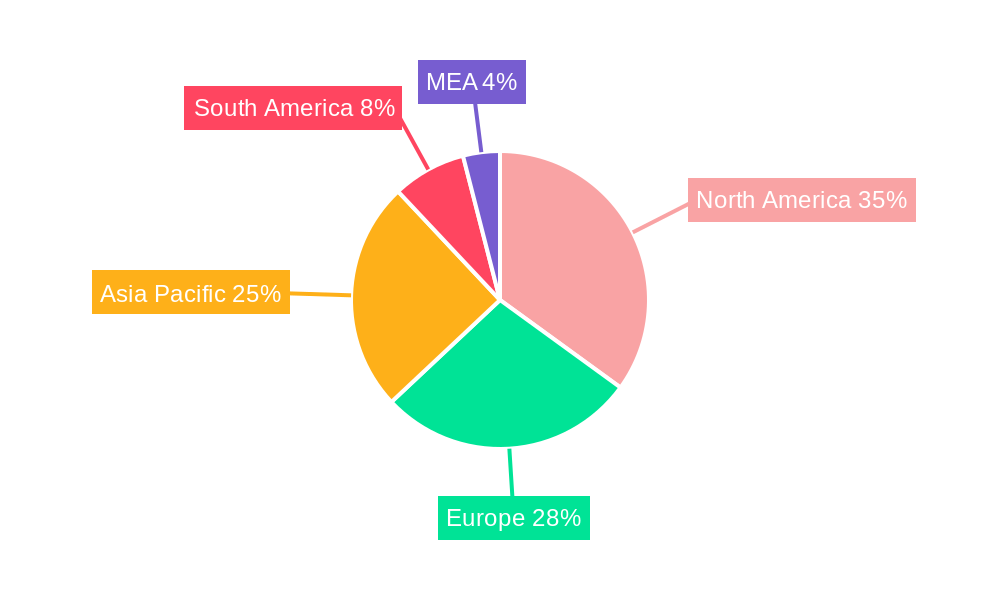
The North American market currently dominates the global toys industry, followed by Europe and Asia-Pacific. However, the growth of e-commerce is enabling expansion in emerging markets.
By Technology:
- Wi-Fi: High growth driven by the increasing adoption of smart toys with advanced features and connectivity.
- Bluetooth: Significant market share due to its established use in remote-controlled toys and interactive devices.
- Other Technologies (NFC and RFID): Emerging technologies offering potential for unique functionalities in toys, experiencing moderate growth.
By Distribution Channel:
- Online Stores: Experiencing rapid growth due to the convenience and reach offered by e-commerce platforms.
- Specialty Stores and Convenience Stores: Maintain significant market share, benefiting from direct customer interaction and brand loyalty.
By Interfacing Devices:
- Smartphone Connected: Dominates the market due to the widespread smartphone ownership and easy integration with apps and games.
- Tablet-Connected: Significant market segment, especially for educational toys and interactive learning platforms.
- Other Interfacing Devices (Console-connected): A niche market segment catering to gaming enthusiasts and console owners.
Key drivers for the dominant regions and segments include robust technological infrastructure, high disposable incomes, and supportive regulatory environments.
Toys Industry Product Innovations
Recent product innovations include the integration of AI, AR, and VR technologies, leading to toys with enhanced interactivity, personalization, and learning features. Smart toys offer sophisticated features like voice recognition, personalized feedback, and adaptive gameplay. The focus is shifting from purely entertainment-based toys to those offering educational and developmental benefits. The unique selling proposition lies in the integration of technology to create interactive experiences that engage and entertain children while enhancing their learning and developmental capabilities.
Propelling Factors for Toys Industry Growth
Several factors are driving the growth of the toys industry:
- Technological Advancements: The integration of AI, AR, and VR technologies is creating more interactive and engaging toys.
- Economic Growth: Rising disposable incomes, particularly in emerging markets, are fueling demand for toys.
- Favorable Regulatory Environment: Supportive government policies and initiatives promoting children's education and development are boosting the market. Examples include tax incentives for educational toy manufacturers in specific regions.
Obstacles in the Toys Industry Market
Challenges facing the toys industry include:
- Regulatory Challenges: Stringent safety regulations and compliance requirements increase costs and complexities for manufacturers.
- Supply Chain Disruptions: Global supply chain bottlenecks and disruptions can impact the availability and cost of raw materials and finished products.
- Competitive Pressure: Intense competition from established players and new entrants requires constant innovation and product differentiation. The estimated impact of supply chain issues on market growth in 2024 was approximately xx Million in lost revenue.
Future Opportunities in Toys Industry
Future opportunities lie in:
- Expansion into Emerging Markets: Untapped potential in developing countries with growing populations and increasing disposable incomes.
- Development of Educational and STEM Toys: Growing demand for toys that promote learning, creativity, and STEM skills.
- Integration of Sustainable and Eco-Friendly Materials: Growing consumer preference for environmentally responsible products.
Major Players in the Toys Industry Ecosystem
- Mattel Inc.
- The Lego Group
- Seebo Interactive Ltd
- Sega Toys Co Ltd
- Pixel Toys
- Playmobil (Brandstätter Group)
- Primo Toys
- Pillar Learning
- TOSY Robotics JSC
- Leapfrog Enterprises Inc
Key Developments in Toys Industry Industry
- November 2022: LeapFrog launched My Pal Scout and Violet Smarty Paws, interactive plush toys promoting cause-and-effect learning and mindfulness. This launch showcases the expanding market for educational and interactive plush toys.
- February 2023: Mattel launched Hot Wheels: Rift Rally, a mixed-reality racing game featuring the innovative Chameleon RC car. This launch highlights the increasing integration of technology and gaming into the toy industry.
Strategic Toys Industry Market Forecast
The toys industry is poised for continued growth driven by technological innovations, changing consumer preferences, and expanding market opportunities. The increasing integration of technology into toys, coupled with the rising demand for educational and developmental toys, presents significant market potential. The market is expected to witness a sustained growth trajectory in the coming years, with specific segments like smart toys and educational toys experiencing particularly strong growth. The forecast anticipates a xx Million increase in market value between 2025 and 2033.
Toys Industry Segmentation
-
1. Interfacing Devices
- 1.1. Smartphone Connected
- 1.2. Tablet-Connected
- 1.3. Other Interfacing Devices (Console-connected)
-
2. Technology
- 2.1. Wi-Fi
- 2.2. Bluetooth
- 2.3. Other Technologies (NFC and RFID)
-
3. Distribution Channel
- 3.1. Online Stores
- 3.2. Specialty Stores and Convenience Stores
Toys Industry Segmentation By Geography
- 1. North America
- 2. Europe
- 3. Asia Pacific
- 4. Rest of the World
Toys Industry REPORT HIGHLIGHTS
| Aspects | Details |
|---|---|
| Study Period | 2019-2033 |
| Base Year | 2024 |
| Estimated Year | 2025 |
| Forecast Period | 2025-2033 |
| Historical Period | 2019-2024 |
| Growth Rate | CAGR of 26.08% from 2019-2033 |
| Segmentation |
|
Table of Contents
- 1. Introduction
- 1.1. Research Scope
- 1.2. Market Segmentation
- 1.3. Research Methodology
- 1.4. Definitions and Assumptions
- 2. Executive Summary
- 2.1. Introduction
- 3. Market Dynamics
- 3.1. Introduction
- 3.2. Market Drivers
- 3.2.1 Increasing Awareness of Technology-Led Education; Increasing Adoption of Technologies like AI
- 3.2.2 IoT
- 3.2.3 Smart Homes
- 3.2.4 Cloud
- 3.2.5 and Connected Mobile Devices; Parents are Increasingly Willing to Invest Smart Toy Increase Usage To Drive the Market Growth
- 3.3. Market Restrains
- 3.3.1. Fragmented Market with Several Local Vendors
- 3.4. Market Trends
- 3.4.1. Increasing Awareness of Technology-Led Education to Witness the Growth
- 4. Market Factor Analysis
- 4.1. Porters Five Forces
- 4.2. Supply/Value Chain
- 4.3. PESTEL analysis
- 4.4. Market Entropy
- 4.5. Patent/Trademark Analysis
- 5. Global Toys Industry Analysis, Insights and Forecast, 2019-2031
- 5.1. Market Analysis, Insights and Forecast - by Interfacing Devices
- 5.1.1. Smartphone Connected
- 5.1.2. Tablet-Connected
- 5.1.3. Other Interfacing Devices (Console-connected)
- 5.2. Market Analysis, Insights and Forecast - by Technology
- 5.2.1. Wi-Fi
- 5.2.2. Bluetooth
- 5.2.3. Other Technologies (NFC and RFID)
- 5.3. Market Analysis, Insights and Forecast - by Distribution Channel
- 5.3.1. Online Stores
- 5.3.2. Specialty Stores and Convenience Stores
- 5.4. Market Analysis, Insights and Forecast - by Region
- 5.4.1. North America
- 5.4.2. Europe
- 5.4.3. Asia Pacific
- 5.4.4. Rest of the World
- 5.1. Market Analysis, Insights and Forecast - by Interfacing Devices
- 6. North America Toys Industry Analysis, Insights and Forecast, 2019-2031
- 6.1. Market Analysis, Insights and Forecast - by Interfacing Devices
- 6.1.1. Smartphone Connected
- 6.1.2. Tablet-Connected
- 6.1.3. Other Interfacing Devices (Console-connected)
- 6.2. Market Analysis, Insights and Forecast - by Technology
- 6.2.1. Wi-Fi
- 6.2.2. Bluetooth
- 6.2.3. Other Technologies (NFC and RFID)
- 6.3. Market Analysis, Insights and Forecast - by Distribution Channel
- 6.3.1. Online Stores
- 6.3.2. Specialty Stores and Convenience Stores
- 6.1. Market Analysis, Insights and Forecast - by Interfacing Devices
- 7. Europe Toys Industry Analysis, Insights and Forecast, 2019-2031
- 7.1. Market Analysis, Insights and Forecast - by Interfacing Devices
- 7.1.1. Smartphone Connected
- 7.1.2. Tablet-Connected
- 7.1.3. Other Interfacing Devices (Console-connected)
- 7.2. Market Analysis, Insights and Forecast - by Technology
- 7.2.1. Wi-Fi
- 7.2.2. Bluetooth
- 7.2.3. Other Technologies (NFC and RFID)
- 7.3. Market Analysis, Insights and Forecast - by Distribution Channel
- 7.3.1. Online Stores
- 7.3.2. Specialty Stores and Convenience Stores
- 7.1. Market Analysis, Insights and Forecast - by Interfacing Devices
- 8. Asia Pacific Toys Industry Analysis, Insights and Forecast, 2019-2031
- 8.1. Market Analysis, Insights and Forecast - by Interfacing Devices
- 8.1.1. Smartphone Connected
- 8.1.2. Tablet-Connected
- 8.1.3. Other Interfacing Devices (Console-connected)
- 8.2. Market Analysis, Insights and Forecast - by Technology
- 8.2.1. Wi-Fi
- 8.2.2. Bluetooth
- 8.2.3. Other Technologies (NFC and RFID)
- 8.3. Market Analysis, Insights and Forecast - by Distribution Channel
- 8.3.1. Online Stores
- 8.3.2. Specialty Stores and Convenience Stores
- 8.1. Market Analysis, Insights and Forecast - by Interfacing Devices
- 9. Rest of the World Toys Industry Analysis, Insights and Forecast, 2019-2031
- 9.1. Market Analysis, Insights and Forecast - by Interfacing Devices
- 9.1.1. Smartphone Connected
- 9.1.2. Tablet-Connected
- 9.1.3. Other Interfacing Devices (Console-connected)
- 9.2. Market Analysis, Insights and Forecast - by Technology
- 9.2.1. Wi-Fi
- 9.2.2. Bluetooth
- 9.2.3. Other Technologies (NFC and RFID)
- 9.3. Market Analysis, Insights and Forecast - by Distribution Channel
- 9.3.1. Online Stores
- 9.3.2. Specialty Stores and Convenience Stores
- 9.1. Market Analysis, Insights and Forecast - by Interfacing Devices
- 10. North America Toys Industry Analysis, Insights and Forecast, 2019-2031
- 10.1. Market Analysis, Insights and Forecast - By Country/Sub-region
- 10.1.1 United States
- 10.1.2 Canada
- 10.1.3 Mexico
- 11. Europe Toys Industry Analysis, Insights and Forecast, 2019-2031
- 11.1. Market Analysis, Insights and Forecast - By Country/Sub-region
- 11.1.1 Germany
- 11.1.2 United Kingdom
- 11.1.3 France
- 11.1.4 Spain
- 11.1.5 Italy
- 11.1.6 Spain
- 11.1.7 Belgium
- 11.1.8 Netherland
- 11.1.9 Nordics
- 11.1.10 Rest of Europe
- 12. Asia Pacific Toys Industry Analysis, Insights and Forecast, 2019-2031
- 12.1. Market Analysis, Insights and Forecast - By Country/Sub-region
- 12.1.1 China
- 12.1.2 Japan
- 12.1.3 India
- 12.1.4 South Korea
- 12.1.5 Southeast Asia
- 12.1.6 Australia
- 12.1.7 Indonesia
- 12.1.8 Phillipes
- 12.1.9 Singapore
- 12.1.10 Thailandc
- 12.1.11 Rest of Asia Pacific
- 13. South America Toys Industry Analysis, Insights and Forecast, 2019-2031
- 13.1. Market Analysis, Insights and Forecast - By Country/Sub-region
- 13.1.1 Brazil
- 13.1.2 Argentina
- 13.1.3 Peru
- 13.1.4 Chile
- 13.1.5 Colombia
- 13.1.6 Ecuador
- 13.1.7 Venezuela
- 13.1.8 Rest of South America
- 14. North America Toys Industry Analysis, Insights and Forecast, 2019-2031
- 14.1. Market Analysis, Insights and Forecast - By Country/Sub-region
- 14.1.1 United States
- 14.1.2 Canada
- 14.1.3 Mexico
- 15. MEA Toys Industry Analysis, Insights and Forecast, 2019-2031
- 15.1. Market Analysis, Insights and Forecast - By Country/Sub-region
- 15.1.1 United Arab Emirates
- 15.1.2 Saudi Arabia
- 15.1.3 South Africa
- 15.1.4 Rest of Middle East and Africa
- 16. Competitive Analysis
- 16.1. Global Market Share Analysis 2024
- 16.2. Company Profiles
- 16.2.1 Mattel Inc
- 16.2.1.1. Overview
- 16.2.1.2. Products
- 16.2.1.3. SWOT Analysis
- 16.2.1.4. Recent Developments
- 16.2.1.5. Financials (Based on Availability)
- 16.2.2 The Lego Group
- 16.2.2.1. Overview
- 16.2.2.2. Products
- 16.2.2.3. SWOT Analysis
- 16.2.2.4. Recent Developments
- 16.2.2.5. Financials (Based on Availability)
- 16.2.3 Seebo Interactive Ltd
- 16.2.3.1. Overview
- 16.2.3.2. Products
- 16.2.3.3. SWOT Analysis
- 16.2.3.4. Recent Developments
- 16.2.3.5. Financials (Based on Availability)
- 16.2.4 Sega Toys Co Ltd
- 16.2.4.1. Overview
- 16.2.4.2. Products
- 16.2.4.3. SWOT Analysis
- 16.2.4.4. Recent Developments
- 16.2.4.5. Financials (Based on Availability)
- 16.2.5 Pixel Toys*List Not Exhaustive
- 16.2.5.1. Overview
- 16.2.5.2. Products
- 16.2.5.3. SWOT Analysis
- 16.2.5.4. Recent Developments
- 16.2.5.5. Financials (Based on Availability)
- 16.2.6 Playmobil (Brandstätter Group)
- 16.2.6.1. Overview
- 16.2.6.2. Products
- 16.2.6.3. SWOT Analysis
- 16.2.6.4. Recent Developments
- 16.2.6.5. Financials (Based on Availability)
- 16.2.7 Primo Toys
- 16.2.7.1. Overview
- 16.2.7.2. Products
- 16.2.7.3. SWOT Analysis
- 16.2.7.4. Recent Developments
- 16.2.7.5. Financials (Based on Availability)
- 16.2.8 Pillar Learning
- 16.2.8.1. Overview
- 16.2.8.2. Products
- 16.2.8.3. SWOT Analysis
- 16.2.8.4. Recent Developments
- 16.2.8.5. Financials (Based on Availability)
- 16.2.9 TOSY Robotics JSC
- 16.2.9.1. Overview
- 16.2.9.2. Products
- 16.2.9.3. SWOT Analysis
- 16.2.9.4. Recent Developments
- 16.2.9.5. Financials (Based on Availability)
- 16.2.10 Leapfrog Enterprises Inc
- 16.2.10.1. Overview
- 16.2.10.2. Products
- 16.2.10.3. SWOT Analysis
- 16.2.10.4. Recent Developments
- 16.2.10.5. Financials (Based on Availability)
- 16.2.1 Mattel Inc
List of Figures
- Figure 1: Global Toys Industry Revenue Breakdown (Million, %) by Region 2024 & 2032
- Figure 2: North America Toys Industry Revenue (Million), by Country 2024 & 2032
- Figure 3: North America Toys Industry Revenue Share (%), by Country 2024 & 2032
- Figure 4: Europe Toys Industry Revenue (Million), by Country 2024 & 2032
- Figure 5: Europe Toys Industry Revenue Share (%), by Country 2024 & 2032
- Figure 6: Asia Pacific Toys Industry Revenue (Million), by Country 2024 & 2032
- Figure 7: Asia Pacific Toys Industry Revenue Share (%), by Country 2024 & 2032
- Figure 8: South America Toys Industry Revenue (Million), by Country 2024 & 2032
- Figure 9: South America Toys Industry Revenue Share (%), by Country 2024 & 2032
- Figure 10: North America Toys Industry Revenue (Million), by Country 2024 & 2032
- Figure 11: North America Toys Industry Revenue Share (%), by Country 2024 & 2032
- Figure 12: MEA Toys Industry Revenue (Million), by Country 2024 & 2032
- Figure 13: MEA Toys Industry Revenue Share (%), by Country 2024 & 2032
- Figure 14: North America Toys Industry Revenue (Million), by Interfacing Devices 2024 & 2032
- Figure 15: North America Toys Industry Revenue Share (%), by Interfacing Devices 2024 & 2032
- Figure 16: North America Toys Industry Revenue (Million), by Technology 2024 & 2032
- Figure 17: North America Toys Industry Revenue Share (%), by Technology 2024 & 2032
- Figure 18: North America Toys Industry Revenue (Million), by Distribution Channel 2024 & 2032
- Figure 19: North America Toys Industry Revenue Share (%), by Distribution Channel 2024 & 2032
- Figure 20: North America Toys Industry Revenue (Million), by Country 2024 & 2032
- Figure 21: North America Toys Industry Revenue Share (%), by Country 2024 & 2032
- Figure 22: Europe Toys Industry Revenue (Million), by Interfacing Devices 2024 & 2032
- Figure 23: Europe Toys Industry Revenue Share (%), by Interfacing Devices 2024 & 2032
- Figure 24: Europe Toys Industry Revenue (Million), by Technology 2024 & 2032
- Figure 25: Europe Toys Industry Revenue Share (%), by Technology 2024 & 2032
- Figure 26: Europe Toys Industry Revenue (Million), by Distribution Channel 2024 & 2032
- Figure 27: Europe Toys Industry Revenue Share (%), by Distribution Channel 2024 & 2032
- Figure 28: Europe Toys Industry Revenue (Million), by Country 2024 & 2032
- Figure 29: Europe Toys Industry Revenue Share (%), by Country 2024 & 2032
- Figure 30: Asia Pacific Toys Industry Revenue (Million), by Interfacing Devices 2024 & 2032
- Figure 31: Asia Pacific Toys Industry Revenue Share (%), by Interfacing Devices 2024 & 2032
- Figure 32: Asia Pacific Toys Industry Revenue (Million), by Technology 2024 & 2032
- Figure 33: Asia Pacific Toys Industry Revenue Share (%), by Technology 2024 & 2032
- Figure 34: Asia Pacific Toys Industry Revenue (Million), by Distribution Channel 2024 & 2032
- Figure 35: Asia Pacific Toys Industry Revenue Share (%), by Distribution Channel 2024 & 2032
- Figure 36: Asia Pacific Toys Industry Revenue (Million), by Country 2024 & 2032
- Figure 37: Asia Pacific Toys Industry Revenue Share (%), by Country 2024 & 2032
- Figure 38: Rest of the World Toys Industry Revenue (Million), by Interfacing Devices 2024 & 2032
- Figure 39: Rest of the World Toys Industry Revenue Share (%), by Interfacing Devices 2024 & 2032
- Figure 40: Rest of the World Toys Industry Revenue (Million), by Technology 2024 & 2032
- Figure 41: Rest of the World Toys Industry Revenue Share (%), by Technology 2024 & 2032
- Figure 42: Rest of the World Toys Industry Revenue (Million), by Distribution Channel 2024 & 2032
- Figure 43: Rest of the World Toys Industry Revenue Share (%), by Distribution Channel 2024 & 2032
- Figure 44: Rest of the World Toys Industry Revenue (Million), by Country 2024 & 2032
- Figure 45: Rest of the World Toys Industry Revenue Share (%), by Country 2024 & 2032
List of Tables
- Table 1: Global Toys Industry Revenue Million Forecast, by Region 2019 & 2032
- Table 2: Global Toys Industry Revenue Million Forecast, by Interfacing Devices 2019 & 2032
- Table 3: Global Toys Industry Revenue Million Forecast, by Technology 2019 & 2032
- Table 4: Global Toys Industry Revenue Million Forecast, by Distribution Channel 2019 & 2032
- Table 5: Global Toys Industry Revenue Million Forecast, by Region 2019 & 2032
- Table 6: Global Toys Industry Revenue Million Forecast, by Country 2019 & 2032
- Table 7: United States Toys Industry Revenue (Million) Forecast, by Application 2019 & 2032
- Table 8: Canada Toys Industry Revenue (Million) Forecast, by Application 2019 & 2032
- Table 9: Mexico Toys Industry Revenue (Million) Forecast, by Application 2019 & 2032
- Table 10: Global Toys Industry Revenue Million Forecast, by Country 2019 & 2032
- Table 11: Germany Toys Industry Revenue (Million) Forecast, by Application 2019 & 2032
- Table 12: United Kingdom Toys Industry Revenue (Million) Forecast, by Application 2019 & 2032
- Table 13: France Toys Industry Revenue (Million) Forecast, by Application 2019 & 2032
- Table 14: Spain Toys Industry Revenue (Million) Forecast, by Application 2019 & 2032
- Table 15: Italy Toys Industry Revenue (Million) Forecast, by Application 2019 & 2032
- Table 16: Spain Toys Industry Revenue (Million) Forecast, by Application 2019 & 2032
- Table 17: Belgium Toys Industry Revenue (Million) Forecast, by Application 2019 & 2032
- Table 18: Netherland Toys Industry Revenue (Million) Forecast, by Application 2019 & 2032
- Table 19: Nordics Toys Industry Revenue (Million) Forecast, by Application 2019 & 2032
- Table 20: Rest of Europe Toys Industry Revenue (Million) Forecast, by Application 2019 & 2032
- Table 21: Global Toys Industry Revenue Million Forecast, by Country 2019 & 2032
- Table 22: China Toys Industry Revenue (Million) Forecast, by Application 2019 & 2032
- Table 23: Japan Toys Industry Revenue (Million) Forecast, by Application 2019 & 2032
- Table 24: India Toys Industry Revenue (Million) Forecast, by Application 2019 & 2032
- Table 25: South Korea Toys Industry Revenue (Million) Forecast, by Application 2019 & 2032
- Table 26: Southeast Asia Toys Industry Revenue (Million) Forecast, by Application 2019 & 2032
- Table 27: Australia Toys Industry Revenue (Million) Forecast, by Application 2019 & 2032
- Table 28: Indonesia Toys Industry Revenue (Million) Forecast, by Application 2019 & 2032
- Table 29: Phillipes Toys Industry Revenue (Million) Forecast, by Application 2019 & 2032
- Table 30: Singapore Toys Industry Revenue (Million) Forecast, by Application 2019 & 2032
- Table 31: Thailandc Toys Industry Revenue (Million) Forecast, by Application 2019 & 2032
- Table 32: Rest of Asia Pacific Toys Industry Revenue (Million) Forecast, by Application 2019 & 2032
- Table 33: Global Toys Industry Revenue Million Forecast, by Country 2019 & 2032
- Table 34: Brazil Toys Industry Revenue (Million) Forecast, by Application 2019 & 2032
- Table 35: Argentina Toys Industry Revenue (Million) Forecast, by Application 2019 & 2032
- Table 36: Peru Toys Industry Revenue (Million) Forecast, by Application 2019 & 2032
- Table 37: Chile Toys Industry Revenue (Million) Forecast, by Application 2019 & 2032
- Table 38: Colombia Toys Industry Revenue (Million) Forecast, by Application 2019 & 2032
- Table 39: Ecuador Toys Industry Revenue (Million) Forecast, by Application 2019 & 2032
- Table 40: Venezuela Toys Industry Revenue (Million) Forecast, by Application 2019 & 2032
- Table 41: Rest of South America Toys Industry Revenue (Million) Forecast, by Application 2019 & 2032
- Table 42: Global Toys Industry Revenue Million Forecast, by Country 2019 & 2032
- Table 43: United States Toys Industry Revenue (Million) Forecast, by Application 2019 & 2032
- Table 44: Canada Toys Industry Revenue (Million) Forecast, by Application 2019 & 2032
- Table 45: Mexico Toys Industry Revenue (Million) Forecast, by Application 2019 & 2032
- Table 46: Global Toys Industry Revenue Million Forecast, by Country 2019 & 2032
- Table 47: United Arab Emirates Toys Industry Revenue (Million) Forecast, by Application 2019 & 2032
- Table 48: Saudi Arabia Toys Industry Revenue (Million) Forecast, by Application 2019 & 2032
- Table 49: South Africa Toys Industry Revenue (Million) Forecast, by Application 2019 & 2032
- Table 50: Rest of Middle East and Africa Toys Industry Revenue (Million) Forecast, by Application 2019 & 2032
- Table 51: Global Toys Industry Revenue Million Forecast, by Interfacing Devices 2019 & 2032
- Table 52: Global Toys Industry Revenue Million Forecast, by Technology 2019 & 2032
- Table 53: Global Toys Industry Revenue Million Forecast, by Distribution Channel 2019 & 2032
- Table 54: Global Toys Industry Revenue Million Forecast, by Country 2019 & 2032
- Table 55: Global Toys Industry Revenue Million Forecast, by Interfacing Devices 2019 & 2032
- Table 56: Global Toys Industry Revenue Million Forecast, by Technology 2019 & 2032
- Table 57: Global Toys Industry Revenue Million Forecast, by Distribution Channel 2019 & 2032
- Table 58: Global Toys Industry Revenue Million Forecast, by Country 2019 & 2032
- Table 59: Global Toys Industry Revenue Million Forecast, by Interfacing Devices 2019 & 2032
- Table 60: Global Toys Industry Revenue Million Forecast, by Technology 2019 & 2032
- Table 61: Global Toys Industry Revenue Million Forecast, by Distribution Channel 2019 & 2032
- Table 62: Global Toys Industry Revenue Million Forecast, by Country 2019 & 2032
- Table 63: Global Toys Industry Revenue Million Forecast, by Interfacing Devices 2019 & 2032
- Table 64: Global Toys Industry Revenue Million Forecast, by Technology 2019 & 2032
- Table 65: Global Toys Industry Revenue Million Forecast, by Distribution Channel 2019 & 2032
- Table 66: Global Toys Industry Revenue Million Forecast, by Country 2019 & 2032
Frequently Asked Questions
1. What is the projected Compound Annual Growth Rate (CAGR) of the Toys Industry?
The projected CAGR is approximately 26.08%.
2. Which companies are prominent players in the Toys Industry?
Key companies in the market include Mattel Inc, The Lego Group, Seebo Interactive Ltd, Sega Toys Co Ltd, Pixel Toys*List Not Exhaustive, Playmobil (Brandstätter Group), Primo Toys, Pillar Learning, TOSY Robotics JSC, Leapfrog Enterprises Inc.
3. What are the main segments of the Toys Industry?
The market segments include Interfacing Devices, Technology, Distribution Channel.
4. Can you provide details about the market size?
The market size is estimated to be USD 34.52 Million as of 2022.
5. What are some drivers contributing to market growth?
Increasing Awareness of Technology-Led Education; Increasing Adoption of Technologies like AI. IoT. Smart Homes. Cloud. and Connected Mobile Devices; Parents are Increasingly Willing to Invest Smart Toy Increase Usage To Drive the Market Growth.
6. What are the notable trends driving market growth?
Increasing Awareness of Technology-Led Education to Witness the Growth.
7. Are there any restraints impacting market growth?
Fragmented Market with Several Local Vendors.
8. Can you provide examples of recent developments in the market?
February 2023: Mattel, Inc, in partnership with Velan Studios, announced the launch of Hot Wheels: Rift Rally, an exciting mixed-reality racing experience that will be available on the App Store for iOS, PlayStation 4, and PlayStation 5. This immersive experience allows players to take control of their beloved Hot Wheels vehicles using the innovative Chameleon RC car, which can digitally transform into over 140 different vehicle variations. Players can race with iconic Hot Wheels models like Twin Mill, Bone Shaker, Mach Speeder, Gotta Go, and many other fan favorites. Get ready for an adrenaline-fueled adventure like never before.
9. What pricing options are available for accessing the report?
Pricing options include single-user, multi-user, and enterprise licenses priced at USD 4750, USD 5250, and USD 8750 respectively.
10. Is the market size provided in terms of value or volume?
The market size is provided in terms of value, measured in Million.
11. Are there any specific market keywords associated with the report?
Yes, the market keyword associated with the report is "Toys Industry," which aids in identifying and referencing the specific market segment covered.
12. How do I determine which pricing option suits my needs best?
The pricing options vary based on user requirements and access needs. Individual users may opt for single-user licenses, while businesses requiring broader access may choose multi-user or enterprise licenses for cost-effective access to the report.
13. Are there any additional resources or data provided in the Toys Industry report?
While the report offers comprehensive insights, it's advisable to review the specific contents or supplementary materials provided to ascertain if additional resources or data are available.
14. How can I stay updated on further developments or reports in the Toys Industry?
To stay informed about further developments, trends, and reports in the Toys Industry, consider subscribing to industry newsletters, following relevant companies and organizations, or regularly checking reputable industry news sources and publications.
Methodology
Step 1 - Identification of Relevant Samples Size from Population Database


Step 2 - Approaches for Defining Global Market Size (Value, Volume* & Price*)

Note*: In applicable scenarios
Step 3 - Data Sources
Primary Research
- Web Analytics
- Survey Reports
- Research Institute
- Latest Research Reports
- Opinion Leaders
Secondary Research
- Annual Reports
- White Paper
- Latest Press Release
- Industry Association
- Paid Database
- Investor Presentations

Step 4 - Data Triangulation
Involves using different sources of information in order to increase the validity of a study
These sources are likely to be stakeholders in a program - participants, other researchers, program staff, other community members, and so on.
Then we put all data in single framework & apply various statistical tools to find out the dynamic on the market.
During the analysis stage, feedback from the stakeholder groups would be compared to determine areas of agreement as well as areas of divergence
