

Key Insights
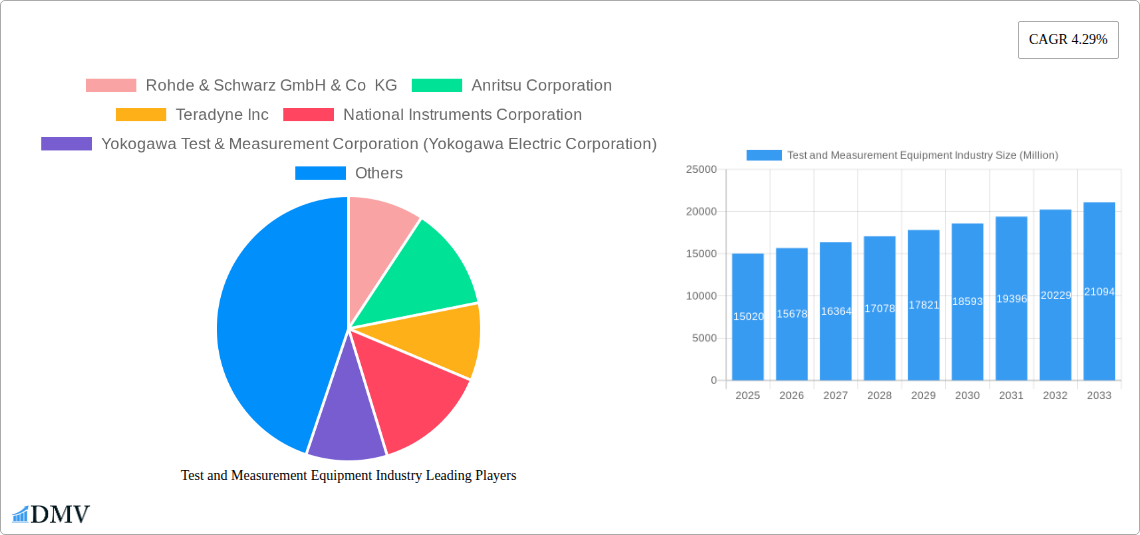
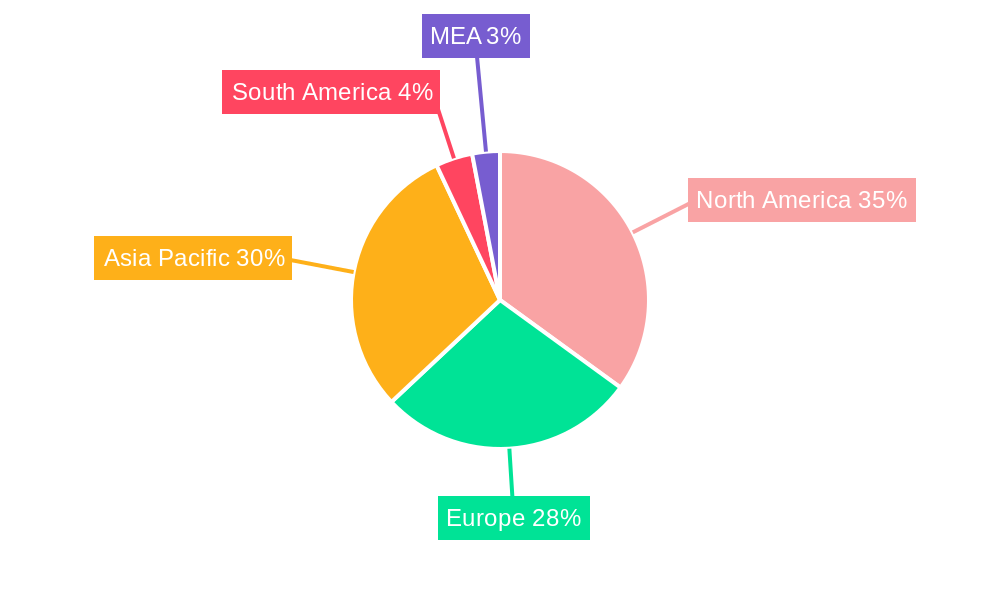
The global Test and Measurement Equipment market is poised for robust growth, projected to reach \$15.02 billion in 2025 and expanding at a Compound Annual Growth Rate (CAGR) of 4.29% from 2025 to 2033. This expansion is driven by several key factors. The escalating demand for high-speed data communication networks, fueled by the proliferation of 5G and IoT technologies, necessitates advanced testing solutions. Simultaneously, the burgeoning semiconductor industry, particularly in advanced node manufacturing, demands increasingly sophisticated ATE solutions for ensuring product quality and reliability. Further growth drivers include the rising adoption of electric vehicles (EVs), requiring stringent testing for power electronics and battery management systems, and the continuous innovation in aerospace and defense systems pushing the need for robust testing methodologies. The market's segmentation reveals significant opportunities across diverse equipment types, including Semiconductor ATE, RF Test Equipment, and Digital Test Equipment, reflecting the varying needs of different industries. Geographical expansion is also a significant contributor, with North America and Asia Pacific anticipated to lead market growth, driven by strong technological advancements and robust manufacturing sectors.
Market restraints include the high cost of advanced test equipment, particularly in specialized sectors like semiconductor ATE. The cyclical nature of some end-user industries, like consumer electronics, can influence demand fluctuations. However, the long-term outlook remains positive, driven by continuous technological advancements, particularly in areas such as artificial intelligence (AI) driven automation and cloud-based test solutions, which promise to enhance efficiency and reduce testing costs. Competition amongst major players like Rohde & Schwarz, Anritsu, Teradyne, and Keysight Technologies drives innovation and provides a wide range of solutions catering to the diverse needs of the market. The increasing complexity of electronic systems necessitates more comprehensive and sophisticated testing, fueling sustained demand for advanced test and measurement equipment throughout the forecast period.
Test and Measurement Equipment Industry Market Report: 2019-2033
This comprehensive report provides a detailed analysis of the Test and Measurement Equipment industry, offering invaluable insights for stakeholders seeking to navigate this dynamic market. With a study period spanning 2019-2033, a base year of 2025, and a forecast period of 2025-2033, this report unveils the key trends, challenges, and opportunities shaping the future of this multi-billion dollar sector. The market is projected to reach xx Million by 2033, demonstrating significant growth potential.
Test and Measurement Equipment Industry Market Composition & Trends
The Test and Measurement Equipment market is characterized by a moderately concentrated landscape, with key players such as Rohde & Schwarz GmbH & Co KG, Anritsu Corporation, Teradyne Inc, National Instruments Corporation, Yokogawa Test & Measurement Corporation, Advantest Corporation, Chauvin Arnoux Group, Fortive Corporation, Teledyne Lecroy, and Keysight Technologies Inc holding significant market share. Market share distribution is estimated at xx Million for the top 5 players in 2025. Innovation is driven by the increasing demand for higher precision, faster testing speeds, and advanced functionalities across various end-user industries. Stringent regulatory compliance requirements, particularly in sectors like aerospace and defense, further shape the market dynamics. Substitute products are limited due to the specialized nature of the equipment, though software-based solutions are increasingly challenging traditional hardware.
- Market Concentration: Moderately concentrated, with top players commanding xx% of the market share in 2025.
- Innovation Catalysts: Increasing demand for higher precision, faster testing, and advanced functionalities.
- Regulatory Landscape: Stringent compliance requirements, particularly in aerospace and defense.
- Substitute Products: Limited, with software solutions emerging as a challenge.
- End-User Profiles: Diverse, encompassing communications, semiconductors, aerospace, consumer electronics, and EVs.
- M&A Activities: Significant M&A activity observed, with deal values exceeding xx Million in the last five years. The recent acquisition of Test Inspire by Microtest Group exemplifies this trend.
Test and Measurement Equipment Industry Evolution
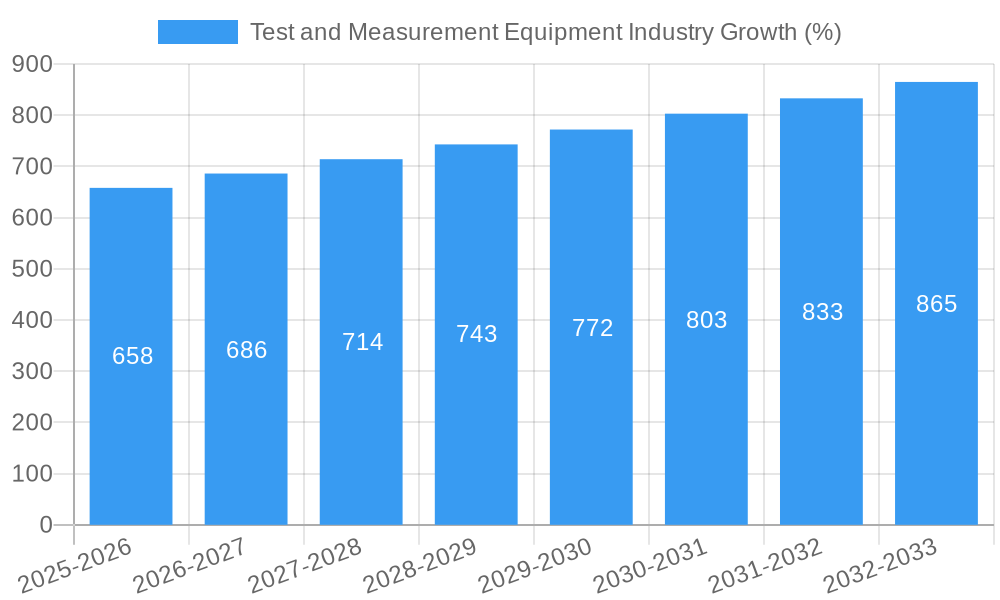
The Test and Measurement Equipment market has witnessed consistent growth over the historical period (2019-2024), exhibiting a Compound Annual Growth Rate (CAGR) of xx%. This growth is projected to continue during the forecast period (2025-2033), with a projected CAGR of xx%, driven by technological advancements like AI-powered testing, miniaturization of components, and the increasing demand for higher throughput testing in high-volume manufacturing environments. The market is also witnessing a shift in consumer demand towards cloud-based solutions and integrated test systems, requiring vendors to adapt their offerings and strategies. The evolution reflects the need for faster, more efficient, and more cost-effective testing solutions to meet the demands of rapidly advancing technologies in various industries. This includes the increasing complexity of semiconductor devices and the growing adoption of 5G and other advanced communication technologies.
Leading Regions, Countries, or Segments in Test and Measurement Equipment Industry
The North American region currently holds the leading position in the Test and Measurement Equipment market, driven by substantial investments in research and development, a robust semiconductor industry, and a strong presence of major players. Within the segment breakdown:
- By Type: Semiconductor Automatic Test Equipment (ATE) holds the largest market share, driven by the booming semiconductor industry. Radio Frequency (RF) Test Equipment is also a rapidly growing segment due to the expanding 5G and wireless communication infrastructure.
- By End-user Industry: The Semiconductors and Computing sector is the dominant end-user, followed by the Communications and Aerospace and Defense sectors. Electric Vehicles (EVs) represent a rapidly emerging high-growth segment.
Key Drivers:
- High R&D investment: Especially in North America and Asia-Pacific regions.
- Government support & incentives: Focusing on technological advancement and domestic manufacturing.
- Growing adoption of advanced technologies: such as 5G, AI, and IoT, across various sectors.
Test and Measurement Equipment Industry Product Innovations
Recent innovations focus on improving accuracy, speed, and automation. Products incorporating artificial intelligence (AI) for predictive maintenance and automated test sequence generation are gaining traction. Miniaturization, enabling more compact and portable equipment, is also a key trend. The introduction of cloud-based solutions facilitates remote access and data analysis, boosting efficiency and collaboration. Unique selling propositions often emphasize improved accuracy, reduced test times, and integrated software solutions for enhanced data analysis and reporting.
Propelling Factors for Test and Measurement Equipment Industry Growth
Several factors are driving growth, including:
- Technological advancements: AI, miniaturization, and cloud-based solutions are key drivers.
- Economic growth: Increased demand in key end-user industries fuels market expansion.
- Stringent regulatory requirements: Driving the adoption of advanced and compliant testing solutions.
Obstacles in the Test and Measurement Equipment Industry Market
Challenges include:
- Supply chain disruptions: Impacting production and delivery times with a projected xx% increase in costs in 2025.
- Intense competition: Pressuring pricing and margins.
- Regulatory complexities: Increasing compliance costs and timelines.
Future Opportunities in Test and Measurement Equipment Industry
Future opportunities lie in:
- Expansion into emerging markets: Significant growth potential in developing economies.
- Development of specialized testing solutions: Addressing the needs of niche applications.
- Integration of IoT and AI: Enabling predictive maintenance and improved testing efficiency.
Major Players in the Test and Measurement Equipment Industry Ecosystem
- Rohde & Schwarz GmbH & Co KG
- Anritsu Corporation
- Teradyne Inc
- National Instruments Corporation
- Yokogawa Test & Measurement Corporation (Yokogawa Electric Corporation)
- Advantest Corporation
- Chauvin Arnoux Group
- Fortive Corporation
- Teledyne Lecroy (Teledyne Technologies Incorporated)
- Keysight Technologies Inc
Key Developments in Test and Measurement Equipment Industry Industry
- July 2023: Teradyne unveiled the Archimedes Analytics Solution, enhancing semiconductor testing efficiency and security.
- June 2023: Microtest Group acquired Test Inspire, strengthening its position in European semiconductor testing.
Strategic Test and Measurement Equipment Industry Market Forecast
The Test and Measurement Equipment market is poised for continued growth, driven by technological advancements, increasing demand across various end-user industries, and opportunities in emerging markets. The market is expected to experience substantial growth in the coming years, fueled by the continued adoption of advanced technologies and the need for reliable, high-precision testing solutions in a wide range of applications.
Test and Measurement Equipment Industry Segmentation
-
1. Type
- 1.1. Semiconductor Automatic Test Equipment (ATE)
- 1.2. Radio Frequency (RF) Test Equipment
- 1.3. Digital Test Equipment
- 1.4. Electrical and Environmental Test
- 1.5. Data Acquisition (DAQ)
-
2. End-user Industry
- 2.1. Communications
- 2.2. Semiconductors and Computing
- 2.3. Aerospace and Defense
- 2.4. Consumer Electronics
- 2.5. Electric Vehicles (EVs)
- 2.6. Other End-user Industries
Test and Measurement Equipment Industry Segmentation By Geography
- 1. North America
- 2. Europe
- 3. Asia
- 4. Australia and New Zealand
- 5. Latin America
- 6. Middle East and Africa
Test and Measurement Equipment Industry REPORT HIGHLIGHTS
| Aspects | Details |
|---|---|
| Study Period | 2019-2033 |
| Base Year | 2024 |
| Estimated Year | 2025 |
| Forecast Period | 2025-2033 |
| Historical Period | 2019-2024 |
| Growth Rate | CAGR of 4.29% from 2019-2033 |
| Segmentation |
|
Table of Contents
- 1. Introduction
- 1.1. Research Scope
- 1.2. Market Segmentation
- 1.3. Research Methodology
- 1.4. Definitions and Assumptions
- 2. Executive Summary
- 2.1. Introduction
- 3. Market Dynamics
- 3.1. Introduction
- 3.2. Market Drivers
- 3.2.1. Technological Advancements Leading to the need for Test and Measurement Equipment; Emerging Trend of Electric and Hybrid Vehicle
- 3.3. Market Restrains
- 3.3.1. Difficulty in Integrating Firewalls with Existing Network Infrastructure; Complexity of Deploying and Managing Firewalls due to Limited Expertise
- 3.4. Market Trends
- 3.4.1. Semiconductors and Computing to be the Largest End-user Industry
- 4. Market Factor Analysis
- 4.1. Porters Five Forces
- 4.2. Supply/Value Chain
- 4.3. PESTEL analysis
- 4.4. Market Entropy
- 4.5. Patent/Trademark Analysis
- 5. Global Test and Measurement Equipment Industry Analysis, Insights and Forecast, 2019-2031
- 5.1. Market Analysis, Insights and Forecast - by Type
- 5.1.1. Semiconductor Automatic Test Equipment (ATE)
- 5.1.2. Radio Frequency (RF) Test Equipment
- 5.1.3. Digital Test Equipment
- 5.1.4. Electrical and Environmental Test
- 5.1.5. Data Acquisition (DAQ)
- 5.2. Market Analysis, Insights and Forecast - by End-user Industry
- 5.2.1. Communications
- 5.2.2. Semiconductors and Computing
- 5.2.3. Aerospace and Defense
- 5.2.4. Consumer Electronics
- 5.2.5. Electric Vehicles (EVs)
- 5.2.6. Other End-user Industries
- 5.3. Market Analysis, Insights and Forecast - by Region
- 5.3.1. North America
- 5.3.2. Europe
- 5.3.3. Asia
- 5.3.4. Australia and New Zealand
- 5.3.5. Latin America
- 5.3.6. Middle East and Africa
- 5.1. Market Analysis, Insights and Forecast - by Type
- 6. North America Test and Measurement Equipment Industry Analysis, Insights and Forecast, 2019-2031
- 6.1. Market Analysis, Insights and Forecast - by Type
- 6.1.1. Semiconductor Automatic Test Equipment (ATE)
- 6.1.2. Radio Frequency (RF) Test Equipment
- 6.1.3. Digital Test Equipment
- 6.1.4. Electrical and Environmental Test
- 6.1.5. Data Acquisition (DAQ)
- 6.2. Market Analysis, Insights and Forecast - by End-user Industry
- 6.2.1. Communications
- 6.2.2. Semiconductors and Computing
- 6.2.3. Aerospace and Defense
- 6.2.4. Consumer Electronics
- 6.2.5. Electric Vehicles (EVs)
- 6.2.6. Other End-user Industries
- 6.1. Market Analysis, Insights and Forecast - by Type
- 7. Europe Test and Measurement Equipment Industry Analysis, Insights and Forecast, 2019-2031
- 7.1. Market Analysis, Insights and Forecast - by Type
- 7.1.1. Semiconductor Automatic Test Equipment (ATE)
- 7.1.2. Radio Frequency (RF) Test Equipment
- 7.1.3. Digital Test Equipment
- 7.1.4. Electrical and Environmental Test
- 7.1.5. Data Acquisition (DAQ)
- 7.2. Market Analysis, Insights and Forecast - by End-user Industry
- 7.2.1. Communications
- 7.2.2. Semiconductors and Computing
- 7.2.3. Aerospace and Defense
- 7.2.4. Consumer Electronics
- 7.2.5. Electric Vehicles (EVs)
- 7.2.6. Other End-user Industries
- 7.1. Market Analysis, Insights and Forecast - by Type
- 8. Asia Test and Measurement Equipment Industry Analysis, Insights and Forecast, 2019-2031
- 8.1. Market Analysis, Insights and Forecast - by Type
- 8.1.1. Semiconductor Automatic Test Equipment (ATE)
- 8.1.2. Radio Frequency (RF) Test Equipment
- 8.1.3. Digital Test Equipment
- 8.1.4. Electrical and Environmental Test
- 8.1.5. Data Acquisition (DAQ)
- 8.2. Market Analysis, Insights and Forecast - by End-user Industry
- 8.2.1. Communications
- 8.2.2. Semiconductors and Computing
- 8.2.3. Aerospace and Defense
- 8.2.4. Consumer Electronics
- 8.2.5. Electric Vehicles (EVs)
- 8.2.6. Other End-user Industries
- 8.1. Market Analysis, Insights and Forecast - by Type
- 9. Australia and New Zealand Test and Measurement Equipment Industry Analysis, Insights and Forecast, 2019-2031
- 9.1. Market Analysis, Insights and Forecast - by Type
- 9.1.1. Semiconductor Automatic Test Equipment (ATE)
- 9.1.2. Radio Frequency (RF) Test Equipment
- 9.1.3. Digital Test Equipment
- 9.1.4. Electrical and Environmental Test
- 9.1.5. Data Acquisition (DAQ)
- 9.2. Market Analysis, Insights and Forecast - by End-user Industry
- 9.2.1. Communications
- 9.2.2. Semiconductors and Computing
- 9.2.3. Aerospace and Defense
- 9.2.4. Consumer Electronics
- 9.2.5. Electric Vehicles (EVs)
- 9.2.6. Other End-user Industries
- 9.1. Market Analysis, Insights and Forecast - by Type
- 10. Latin America Test and Measurement Equipment Industry Analysis, Insights and Forecast, 2019-2031
- 10.1. Market Analysis, Insights and Forecast - by Type
- 10.1.1. Semiconductor Automatic Test Equipment (ATE)
- 10.1.2. Radio Frequency (RF) Test Equipment
- 10.1.3. Digital Test Equipment
- 10.1.4. Electrical and Environmental Test
- 10.1.5. Data Acquisition (DAQ)
- 10.2. Market Analysis, Insights and Forecast - by End-user Industry
- 10.2.1. Communications
- 10.2.2. Semiconductors and Computing
- 10.2.3. Aerospace and Defense
- 10.2.4. Consumer Electronics
- 10.2.5. Electric Vehicles (EVs)
- 10.2.6. Other End-user Industries
- 10.1. Market Analysis, Insights and Forecast - by Type
- 11. Middle East and Africa Test and Measurement Equipment Industry Analysis, Insights and Forecast, 2019-2031
- 11.1. Market Analysis, Insights and Forecast - by Type
- 11.1.1. Semiconductor Automatic Test Equipment (ATE)
- 11.1.2. Radio Frequency (RF) Test Equipment
- 11.1.3. Digital Test Equipment
- 11.1.4. Electrical and Environmental Test
- 11.1.5. Data Acquisition (DAQ)
- 11.2. Market Analysis, Insights and Forecast - by End-user Industry
- 11.2.1. Communications
- 11.2.2. Semiconductors and Computing
- 11.2.3. Aerospace and Defense
- 11.2.4. Consumer Electronics
- 11.2.5. Electric Vehicles (EVs)
- 11.2.6. Other End-user Industries
- 11.1. Market Analysis, Insights and Forecast - by Type
- 12. North America Test and Measurement Equipment Industry Analysis, Insights and Forecast, 2019-2031
- 12.1. Market Analysis, Insights and Forecast - By Country/Sub-region
- 12.1.1 United States
- 12.1.2 Canada
- 12.1.3 Mexico
- 13. Europe Test and Measurement Equipment Industry Analysis, Insights and Forecast, 2019-2031
- 13.1. Market Analysis, Insights and Forecast - By Country/Sub-region
- 13.1.1 Germany
- 13.1.2 United Kingdom
- 13.1.3 France
- 13.1.4 Spain
- 13.1.5 Italy
- 13.1.6 Spain
- 13.1.7 Belgium
- 13.1.8 Netherland
- 13.1.9 Nordics
- 13.1.10 Rest of Europe
- 14. Asia Pacific Test and Measurement Equipment Industry Analysis, Insights and Forecast, 2019-2031
- 14.1. Market Analysis, Insights and Forecast - By Country/Sub-region
- 14.1.1 China
- 14.1.2 Japan
- 14.1.3 India
- 14.1.4 South Korea
- 14.1.5 Southeast Asia
- 14.1.6 Australia
- 14.1.7 Indonesia
- 14.1.8 Phillipes
- 14.1.9 Singapore
- 14.1.10 Thailandc
- 14.1.11 Rest of Asia Pacific
- 15. South America Test and Measurement Equipment Industry Analysis, Insights and Forecast, 2019-2031
- 15.1. Market Analysis, Insights and Forecast - By Country/Sub-region
- 15.1.1 Brazil
- 15.1.2 Argentina
- 15.1.3 Peru
- 15.1.4 Chile
- 15.1.5 Colombia
- 15.1.6 Ecuador
- 15.1.7 Venezuela
- 15.1.8 Rest of South America
- 16. North America Test and Measurement Equipment Industry Analysis, Insights and Forecast, 2019-2031
- 16.1. Market Analysis, Insights and Forecast - By Country/Sub-region
- 16.1.1 United States
- 16.1.2 Canada
- 16.1.3 Mexico
- 17. MEA Test and Measurement Equipment Industry Analysis, Insights and Forecast, 2019-2031
- 17.1. Market Analysis, Insights and Forecast - By Country/Sub-region
- 17.1.1 United Arab Emirates
- 17.1.2 Saudi Arabia
- 17.1.3 South Africa
- 17.1.4 Rest of Middle East and Africa
- 18. Competitive Analysis
- 18.1. Global Market Share Analysis 2024
- 18.2. Company Profiles
- 18.2.1 Rohde & Schwarz GmbH & Co KG
- 18.2.1.1. Overview
- 18.2.1.2. Products
- 18.2.1.3. SWOT Analysis
- 18.2.1.4. Recent Developments
- 18.2.1.5. Financials (Based on Availability)
- 18.2.2 Anritsu Corporation
- 18.2.2.1. Overview
- 18.2.2.2. Products
- 18.2.2.3. SWOT Analysis
- 18.2.2.4. Recent Developments
- 18.2.2.5. Financials (Based on Availability)
- 18.2.3 Teradyne Inc
- 18.2.3.1. Overview
- 18.2.3.2. Products
- 18.2.3.3. SWOT Analysis
- 18.2.3.4. Recent Developments
- 18.2.3.5. Financials (Based on Availability)
- 18.2.4 National Instruments Corporation
- 18.2.4.1. Overview
- 18.2.4.2. Products
- 18.2.4.3. SWOT Analysis
- 18.2.4.4. Recent Developments
- 18.2.4.5. Financials (Based on Availability)
- 18.2.5 Yokogawa Test & Measurement Corporation (Yokogawa Electric Corporation)
- 18.2.5.1. Overview
- 18.2.5.2. Products
- 18.2.5.3. SWOT Analysis
- 18.2.5.4. Recent Developments
- 18.2.5.5. Financials (Based on Availability)
- 18.2.6 Advantest Corporatio
- 18.2.6.1. Overview
- 18.2.6.2. Products
- 18.2.6.3. SWOT Analysis
- 18.2.6.4. Recent Developments
- 18.2.6.5. Financials (Based on Availability)
- 18.2.7 Chauvin Arnoux Group
- 18.2.7.1. Overview
- 18.2.7.2. Products
- 18.2.7.3. SWOT Analysis
- 18.2.7.4. Recent Developments
- 18.2.7.5. Financials (Based on Availability)
- 18.2.8 Fortive Corporation
- 18.2.8.1. Overview
- 18.2.8.2. Products
- 18.2.8.3. SWOT Analysis
- 18.2.8.4. Recent Developments
- 18.2.8.5. Financials (Based on Availability)
- 18.2.9 Teledyne Lecroy (Teledyne Technologies Incorporated)
- 18.2.9.1. Overview
- 18.2.9.2. Products
- 18.2.9.3. SWOT Analysis
- 18.2.9.4. Recent Developments
- 18.2.9.5. Financials (Based on Availability)
- 18.2.10 Keysight Technologies Inc
- 18.2.10.1. Overview
- 18.2.10.2. Products
- 18.2.10.3. SWOT Analysis
- 18.2.10.4. Recent Developments
- 18.2.10.5. Financials (Based on Availability)
- 18.2.1 Rohde & Schwarz GmbH & Co KG
List of Figures
- Figure 1: Global Test and Measurement Equipment Industry Revenue Breakdown (Million, %) by Region 2024 & 2032
- Figure 2: Global Test and Measurement Equipment Industry Volume Breakdown (K Unit, %) by Region 2024 & 2032
- Figure 3: North America Test and Measurement Equipment Industry Revenue (Million), by Country 2024 & 2032
- Figure 4: North America Test and Measurement Equipment Industry Volume (K Unit), by Country 2024 & 2032
- Figure 5: North America Test and Measurement Equipment Industry Revenue Share (%), by Country 2024 & 2032
- Figure 6: North America Test and Measurement Equipment Industry Volume Share (%), by Country 2024 & 2032
- Figure 7: Europe Test and Measurement Equipment Industry Revenue (Million), by Country 2024 & 2032
- Figure 8: Europe Test and Measurement Equipment Industry Volume (K Unit), by Country 2024 & 2032
- Figure 9: Europe Test and Measurement Equipment Industry Revenue Share (%), by Country 2024 & 2032
- Figure 10: Europe Test and Measurement Equipment Industry Volume Share (%), by Country 2024 & 2032
- Figure 11: Asia Pacific Test and Measurement Equipment Industry Revenue (Million), by Country 2024 & 2032
- Figure 12: Asia Pacific Test and Measurement Equipment Industry Volume (K Unit), by Country 2024 & 2032
- Figure 13: Asia Pacific Test and Measurement Equipment Industry Revenue Share (%), by Country 2024 & 2032
- Figure 14: Asia Pacific Test and Measurement Equipment Industry Volume Share (%), by Country 2024 & 2032
- Figure 15: South America Test and Measurement Equipment Industry Revenue (Million), by Country 2024 & 2032
- Figure 16: South America Test and Measurement Equipment Industry Volume (K Unit), by Country 2024 & 2032
- Figure 17: South America Test and Measurement Equipment Industry Revenue Share (%), by Country 2024 & 2032
- Figure 18: South America Test and Measurement Equipment Industry Volume Share (%), by Country 2024 & 2032
- Figure 19: North America Test and Measurement Equipment Industry Revenue (Million), by Country 2024 & 2032
- Figure 20: North America Test and Measurement Equipment Industry Volume (K Unit), by Country 2024 & 2032
- Figure 21: North America Test and Measurement Equipment Industry Revenue Share (%), by Country 2024 & 2032
- Figure 22: North America Test and Measurement Equipment Industry Volume Share (%), by Country 2024 & 2032
- Figure 23: MEA Test and Measurement Equipment Industry Revenue (Million), by Country 2024 & 2032
- Figure 24: MEA Test and Measurement Equipment Industry Volume (K Unit), by Country 2024 & 2032
- Figure 25: MEA Test and Measurement Equipment Industry Revenue Share (%), by Country 2024 & 2032
- Figure 26: MEA Test and Measurement Equipment Industry Volume Share (%), by Country 2024 & 2032
- Figure 27: North America Test and Measurement Equipment Industry Revenue (Million), by Type 2024 & 2032
- Figure 28: North America Test and Measurement Equipment Industry Volume (K Unit), by Type 2024 & 2032
- Figure 29: North America Test and Measurement Equipment Industry Revenue Share (%), by Type 2024 & 2032
- Figure 30: North America Test and Measurement Equipment Industry Volume Share (%), by Type 2024 & 2032
- Figure 31: North America Test and Measurement Equipment Industry Revenue (Million), by End-user Industry 2024 & 2032
- Figure 32: North America Test and Measurement Equipment Industry Volume (K Unit), by End-user Industry 2024 & 2032
- Figure 33: North America Test and Measurement Equipment Industry Revenue Share (%), by End-user Industry 2024 & 2032
- Figure 34: North America Test and Measurement Equipment Industry Volume Share (%), by End-user Industry 2024 & 2032
- Figure 35: North America Test and Measurement Equipment Industry Revenue (Million), by Country 2024 & 2032
- Figure 36: North America Test and Measurement Equipment Industry Volume (K Unit), by Country 2024 & 2032
- Figure 37: North America Test and Measurement Equipment Industry Revenue Share (%), by Country 2024 & 2032
- Figure 38: North America Test and Measurement Equipment Industry Volume Share (%), by Country 2024 & 2032
- Figure 39: Europe Test and Measurement Equipment Industry Revenue (Million), by Type 2024 & 2032
- Figure 40: Europe Test and Measurement Equipment Industry Volume (K Unit), by Type 2024 & 2032
- Figure 41: Europe Test and Measurement Equipment Industry Revenue Share (%), by Type 2024 & 2032
- Figure 42: Europe Test and Measurement Equipment Industry Volume Share (%), by Type 2024 & 2032
- Figure 43: Europe Test and Measurement Equipment Industry Revenue (Million), by End-user Industry 2024 & 2032
- Figure 44: Europe Test and Measurement Equipment Industry Volume (K Unit), by End-user Industry 2024 & 2032
- Figure 45: Europe Test and Measurement Equipment Industry Revenue Share (%), by End-user Industry 2024 & 2032
- Figure 46: Europe Test and Measurement Equipment Industry Volume Share (%), by End-user Industry 2024 & 2032
- Figure 47: Europe Test and Measurement Equipment Industry Revenue (Million), by Country 2024 & 2032
- Figure 48: Europe Test and Measurement Equipment Industry Volume (K Unit), by Country 2024 & 2032
- Figure 49: Europe Test and Measurement Equipment Industry Revenue Share (%), by Country 2024 & 2032
- Figure 50: Europe Test and Measurement Equipment Industry Volume Share (%), by Country 2024 & 2032
- Figure 51: Asia Test and Measurement Equipment Industry Revenue (Million), by Type 2024 & 2032
- Figure 52: Asia Test and Measurement Equipment Industry Volume (K Unit), by Type 2024 & 2032
- Figure 53: Asia Test and Measurement Equipment Industry Revenue Share (%), by Type 2024 & 2032
- Figure 54: Asia Test and Measurement Equipment Industry Volume Share (%), by Type 2024 & 2032
- Figure 55: Asia Test and Measurement Equipment Industry Revenue (Million), by End-user Industry 2024 & 2032
- Figure 56: Asia Test and Measurement Equipment Industry Volume (K Unit), by End-user Industry 2024 & 2032
- Figure 57: Asia Test and Measurement Equipment Industry Revenue Share (%), by End-user Industry 2024 & 2032
- Figure 58: Asia Test and Measurement Equipment Industry Volume Share (%), by End-user Industry 2024 & 2032
- Figure 59: Asia Test and Measurement Equipment Industry Revenue (Million), by Country 2024 & 2032
- Figure 60: Asia Test and Measurement Equipment Industry Volume (K Unit), by Country 2024 & 2032
- Figure 61: Asia Test and Measurement Equipment Industry Revenue Share (%), by Country 2024 & 2032
- Figure 62: Asia Test and Measurement Equipment Industry Volume Share (%), by Country 2024 & 2032
- Figure 63: Australia and New Zealand Test and Measurement Equipment Industry Revenue (Million), by Type 2024 & 2032
- Figure 64: Australia and New Zealand Test and Measurement Equipment Industry Volume (K Unit), by Type 2024 & 2032
- Figure 65: Australia and New Zealand Test and Measurement Equipment Industry Revenue Share (%), by Type 2024 & 2032
- Figure 66: Australia and New Zealand Test and Measurement Equipment Industry Volume Share (%), by Type 2024 & 2032
- Figure 67: Australia and New Zealand Test and Measurement Equipment Industry Revenue (Million), by End-user Industry 2024 & 2032
- Figure 68: Australia and New Zealand Test and Measurement Equipment Industry Volume (K Unit), by End-user Industry 2024 & 2032
- Figure 69: Australia and New Zealand Test and Measurement Equipment Industry Revenue Share (%), by End-user Industry 2024 & 2032
- Figure 70: Australia and New Zealand Test and Measurement Equipment Industry Volume Share (%), by End-user Industry 2024 & 2032
- Figure 71: Australia and New Zealand Test and Measurement Equipment Industry Revenue (Million), by Country 2024 & 2032
- Figure 72: Australia and New Zealand Test and Measurement Equipment Industry Volume (K Unit), by Country 2024 & 2032
- Figure 73: Australia and New Zealand Test and Measurement Equipment Industry Revenue Share (%), by Country 2024 & 2032
- Figure 74: Australia and New Zealand Test and Measurement Equipment Industry Volume Share (%), by Country 2024 & 2032
- Figure 75: Latin America Test and Measurement Equipment Industry Revenue (Million), by Type 2024 & 2032
- Figure 76: Latin America Test and Measurement Equipment Industry Volume (K Unit), by Type 2024 & 2032
- Figure 77: Latin America Test and Measurement Equipment Industry Revenue Share (%), by Type 2024 & 2032
- Figure 78: Latin America Test and Measurement Equipment Industry Volume Share (%), by Type 2024 & 2032
- Figure 79: Latin America Test and Measurement Equipment Industry Revenue (Million), by End-user Industry 2024 & 2032
- Figure 80: Latin America Test and Measurement Equipment Industry Volume (K Unit), by End-user Industry 2024 & 2032
- Figure 81: Latin America Test and Measurement Equipment Industry Revenue Share (%), by End-user Industry 2024 & 2032
- Figure 82: Latin America Test and Measurement Equipment Industry Volume Share (%), by End-user Industry 2024 & 2032
- Figure 83: Latin America Test and Measurement Equipment Industry Revenue (Million), by Country 2024 & 2032
- Figure 84: Latin America Test and Measurement Equipment Industry Volume (K Unit), by Country 2024 & 2032
- Figure 85: Latin America Test and Measurement Equipment Industry Revenue Share (%), by Country 2024 & 2032
- Figure 86: Latin America Test and Measurement Equipment Industry Volume Share (%), by Country 2024 & 2032
- Figure 87: Middle East and Africa Test and Measurement Equipment Industry Revenue (Million), by Type 2024 & 2032
- Figure 88: Middle East and Africa Test and Measurement Equipment Industry Volume (K Unit), by Type 2024 & 2032
- Figure 89: Middle East and Africa Test and Measurement Equipment Industry Revenue Share (%), by Type 2024 & 2032
- Figure 90: Middle East and Africa Test and Measurement Equipment Industry Volume Share (%), by Type 2024 & 2032
- Figure 91: Middle East and Africa Test and Measurement Equipment Industry Revenue (Million), by End-user Industry 2024 & 2032
- Figure 92: Middle East and Africa Test and Measurement Equipment Industry Volume (K Unit), by End-user Industry 2024 & 2032
- Figure 93: Middle East and Africa Test and Measurement Equipment Industry Revenue Share (%), by End-user Industry 2024 & 2032
- Figure 94: Middle East and Africa Test and Measurement Equipment Industry Volume Share (%), by End-user Industry 2024 & 2032
- Figure 95: Middle East and Africa Test and Measurement Equipment Industry Revenue (Million), by Country 2024 & 2032
- Figure 96: Middle East and Africa Test and Measurement Equipment Industry Volume (K Unit), by Country 2024 & 2032
- Figure 97: Middle East and Africa Test and Measurement Equipment Industry Revenue Share (%), by Country 2024 & 2032
- Figure 98: Middle East and Africa Test and Measurement Equipment Industry Volume Share (%), by Country 2024 & 2032
List of Tables
- Table 1: Global Test and Measurement Equipment Industry Revenue Million Forecast, by Region 2019 & 2032
- Table 2: Global Test and Measurement Equipment Industry Volume K Unit Forecast, by Region 2019 & 2032
- Table 3: Global Test and Measurement Equipment Industry Revenue Million Forecast, by Type 2019 & 2032
- Table 4: Global Test and Measurement Equipment Industry Volume K Unit Forecast, by Type 2019 & 2032
- Table 5: Global Test and Measurement Equipment Industry Revenue Million Forecast, by End-user Industry 2019 & 2032
- Table 6: Global Test and Measurement Equipment Industry Volume K Unit Forecast, by End-user Industry 2019 & 2032
- Table 7: Global Test and Measurement Equipment Industry Revenue Million Forecast, by Region 2019 & 2032
- Table 8: Global Test and Measurement Equipment Industry Volume K Unit Forecast, by Region 2019 & 2032
- Table 9: Global Test and Measurement Equipment Industry Revenue Million Forecast, by Country 2019 & 2032
- Table 10: Global Test and Measurement Equipment Industry Volume K Unit Forecast, by Country 2019 & 2032
- Table 11: United States Test and Measurement Equipment Industry Revenue (Million) Forecast, by Application 2019 & 2032
- Table 12: United States Test and Measurement Equipment Industry Volume (K Unit) Forecast, by Application 2019 & 2032
- Table 13: Canada Test and Measurement Equipment Industry Revenue (Million) Forecast, by Application 2019 & 2032
- Table 14: Canada Test and Measurement Equipment Industry Volume (K Unit) Forecast, by Application 2019 & 2032
- Table 15: Mexico Test and Measurement Equipment Industry Revenue (Million) Forecast, by Application 2019 & 2032
- Table 16: Mexico Test and Measurement Equipment Industry Volume (K Unit) Forecast, by Application 2019 & 2032
- Table 17: Global Test and Measurement Equipment Industry Revenue Million Forecast, by Country 2019 & 2032
- Table 18: Global Test and Measurement Equipment Industry Volume K Unit Forecast, by Country 2019 & 2032
- Table 19: Germany Test and Measurement Equipment Industry Revenue (Million) Forecast, by Application 2019 & 2032
- Table 20: Germany Test and Measurement Equipment Industry Volume (K Unit) Forecast, by Application 2019 & 2032
- Table 21: United Kingdom Test and Measurement Equipment Industry Revenue (Million) Forecast, by Application 2019 & 2032
- Table 22: United Kingdom Test and Measurement Equipment Industry Volume (K Unit) Forecast, by Application 2019 & 2032
- Table 23: France Test and Measurement Equipment Industry Revenue (Million) Forecast, by Application 2019 & 2032
- Table 24: France Test and Measurement Equipment Industry Volume (K Unit) Forecast, by Application 2019 & 2032
- Table 25: Spain Test and Measurement Equipment Industry Revenue (Million) Forecast, by Application 2019 & 2032
- Table 26: Spain Test and Measurement Equipment Industry Volume (K Unit) Forecast, by Application 2019 & 2032
- Table 27: Italy Test and Measurement Equipment Industry Revenue (Million) Forecast, by Application 2019 & 2032
- Table 28: Italy Test and Measurement Equipment Industry Volume (K Unit) Forecast, by Application 2019 & 2032
- Table 29: Spain Test and Measurement Equipment Industry Revenue (Million) Forecast, by Application 2019 & 2032
- Table 30: Spain Test and Measurement Equipment Industry Volume (K Unit) Forecast, by Application 2019 & 2032
- Table 31: Belgium Test and Measurement Equipment Industry Revenue (Million) Forecast, by Application 2019 & 2032
- Table 32: Belgium Test and Measurement Equipment Industry Volume (K Unit) Forecast, by Application 2019 & 2032
- Table 33: Netherland Test and Measurement Equipment Industry Revenue (Million) Forecast, by Application 2019 & 2032
- Table 34: Netherland Test and Measurement Equipment Industry Volume (K Unit) Forecast, by Application 2019 & 2032
- Table 35: Nordics Test and Measurement Equipment Industry Revenue (Million) Forecast, by Application 2019 & 2032
- Table 36: Nordics Test and Measurement Equipment Industry Volume (K Unit) Forecast, by Application 2019 & 2032
- Table 37: Rest of Europe Test and Measurement Equipment Industry Revenue (Million) Forecast, by Application 2019 & 2032
- Table 38: Rest of Europe Test and Measurement Equipment Industry Volume (K Unit) Forecast, by Application 2019 & 2032
- Table 39: Global Test and Measurement Equipment Industry Revenue Million Forecast, by Country 2019 & 2032
- Table 40: Global Test and Measurement Equipment Industry Volume K Unit Forecast, by Country 2019 & 2032
- Table 41: China Test and Measurement Equipment Industry Revenue (Million) Forecast, by Application 2019 & 2032
- Table 42: China Test and Measurement Equipment Industry Volume (K Unit) Forecast, by Application 2019 & 2032
- Table 43: Japan Test and Measurement Equipment Industry Revenue (Million) Forecast, by Application 2019 & 2032
- Table 44: Japan Test and Measurement Equipment Industry Volume (K Unit) Forecast, by Application 2019 & 2032
- Table 45: India Test and Measurement Equipment Industry Revenue (Million) Forecast, by Application 2019 & 2032
- Table 46: India Test and Measurement Equipment Industry Volume (K Unit) Forecast, by Application 2019 & 2032
- Table 47: South Korea Test and Measurement Equipment Industry Revenue (Million) Forecast, by Application 2019 & 2032
- Table 48: South Korea Test and Measurement Equipment Industry Volume (K Unit) Forecast, by Application 2019 & 2032
- Table 49: Southeast Asia Test and Measurement Equipment Industry Revenue (Million) Forecast, by Application 2019 & 2032
- Table 50: Southeast Asia Test and Measurement Equipment Industry Volume (K Unit) Forecast, by Application 2019 & 2032
- Table 51: Australia Test and Measurement Equipment Industry Revenue (Million) Forecast, by Application 2019 & 2032
- Table 52: Australia Test and Measurement Equipment Industry Volume (K Unit) Forecast, by Application 2019 & 2032
- Table 53: Indonesia Test and Measurement Equipment Industry Revenue (Million) Forecast, by Application 2019 & 2032
- Table 54: Indonesia Test and Measurement Equipment Industry Volume (K Unit) Forecast, by Application 2019 & 2032
- Table 55: Phillipes Test and Measurement Equipment Industry Revenue (Million) Forecast, by Application 2019 & 2032
- Table 56: Phillipes Test and Measurement Equipment Industry Volume (K Unit) Forecast, by Application 2019 & 2032
- Table 57: Singapore Test and Measurement Equipment Industry Revenue (Million) Forecast, by Application 2019 & 2032
- Table 58: Singapore Test and Measurement Equipment Industry Volume (K Unit) Forecast, by Application 2019 & 2032
- Table 59: Thailandc Test and Measurement Equipment Industry Revenue (Million) Forecast, by Application 2019 & 2032
- Table 60: Thailandc Test and Measurement Equipment Industry Volume (K Unit) Forecast, by Application 2019 & 2032
- Table 61: Rest of Asia Pacific Test and Measurement Equipment Industry Revenue (Million) Forecast, by Application 2019 & 2032
- Table 62: Rest of Asia Pacific Test and Measurement Equipment Industry Volume (K Unit) Forecast, by Application 2019 & 2032
- Table 63: Global Test and Measurement Equipment Industry Revenue Million Forecast, by Country 2019 & 2032
- Table 64: Global Test and Measurement Equipment Industry Volume K Unit Forecast, by Country 2019 & 2032
- Table 65: Brazil Test and Measurement Equipment Industry Revenue (Million) Forecast, by Application 2019 & 2032
- Table 66: Brazil Test and Measurement Equipment Industry Volume (K Unit) Forecast, by Application 2019 & 2032
- Table 67: Argentina Test and Measurement Equipment Industry Revenue (Million) Forecast, by Application 2019 & 2032
- Table 68: Argentina Test and Measurement Equipment Industry Volume (K Unit) Forecast, by Application 2019 & 2032
- Table 69: Peru Test and Measurement Equipment Industry Revenue (Million) Forecast, by Application 2019 & 2032
- Table 70: Peru Test and Measurement Equipment Industry Volume (K Unit) Forecast, by Application 2019 & 2032
- Table 71: Chile Test and Measurement Equipment Industry Revenue (Million) Forecast, by Application 2019 & 2032
- Table 72: Chile Test and Measurement Equipment Industry Volume (K Unit) Forecast, by Application 2019 & 2032
- Table 73: Colombia Test and Measurement Equipment Industry Revenue (Million) Forecast, by Application 2019 & 2032
- Table 74: Colombia Test and Measurement Equipment Industry Volume (K Unit) Forecast, by Application 2019 & 2032
- Table 75: Ecuador Test and Measurement Equipment Industry Revenue (Million) Forecast, by Application 2019 & 2032
- Table 76: Ecuador Test and Measurement Equipment Industry Volume (K Unit) Forecast, by Application 2019 & 2032
- Table 77: Venezuela Test and Measurement Equipment Industry Revenue (Million) Forecast, by Application 2019 & 2032
- Table 78: Venezuela Test and Measurement Equipment Industry Volume (K Unit) Forecast, by Application 2019 & 2032
- Table 79: Rest of South America Test and Measurement Equipment Industry Revenue (Million) Forecast, by Application 2019 & 2032
- Table 80: Rest of South America Test and Measurement Equipment Industry Volume (K Unit) Forecast, by Application 2019 & 2032
- Table 81: Global Test and Measurement Equipment Industry Revenue Million Forecast, by Country 2019 & 2032
- Table 82: Global Test and Measurement Equipment Industry Volume K Unit Forecast, by Country 2019 & 2032
- Table 83: United States Test and Measurement Equipment Industry Revenue (Million) Forecast, by Application 2019 & 2032
- Table 84: United States Test and Measurement Equipment Industry Volume (K Unit) Forecast, by Application 2019 & 2032
- Table 85: Canada Test and Measurement Equipment Industry Revenue (Million) Forecast, by Application 2019 & 2032
- Table 86: Canada Test and Measurement Equipment Industry Volume (K Unit) Forecast, by Application 2019 & 2032
- Table 87: Mexico Test and Measurement Equipment Industry Revenue (Million) Forecast, by Application 2019 & 2032
- Table 88: Mexico Test and Measurement Equipment Industry Volume (K Unit) Forecast, by Application 2019 & 2032
- Table 89: Global Test and Measurement Equipment Industry Revenue Million Forecast, by Country 2019 & 2032
- Table 90: Global Test and Measurement Equipment Industry Volume K Unit Forecast, by Country 2019 & 2032
- Table 91: United Arab Emirates Test and Measurement Equipment Industry Revenue (Million) Forecast, by Application 2019 & 2032
- Table 92: United Arab Emirates Test and Measurement Equipment Industry Volume (K Unit) Forecast, by Application 2019 & 2032
- Table 93: Saudi Arabia Test and Measurement Equipment Industry Revenue (Million) Forecast, by Application 2019 & 2032
- Table 94: Saudi Arabia Test and Measurement Equipment Industry Volume (K Unit) Forecast, by Application 2019 & 2032
- Table 95: South Africa Test and Measurement Equipment Industry Revenue (Million) Forecast, by Application 2019 & 2032
- Table 96: South Africa Test and Measurement Equipment Industry Volume (K Unit) Forecast, by Application 2019 & 2032
- Table 97: Rest of Middle East and Africa Test and Measurement Equipment Industry Revenue (Million) Forecast, by Application 2019 & 2032
- Table 98: Rest of Middle East and Africa Test and Measurement Equipment Industry Volume (K Unit) Forecast, by Application 2019 & 2032
- Table 99: Global Test and Measurement Equipment Industry Revenue Million Forecast, by Type 2019 & 2032
- Table 100: Global Test and Measurement Equipment Industry Volume K Unit Forecast, by Type 2019 & 2032
- Table 101: Global Test and Measurement Equipment Industry Revenue Million Forecast, by End-user Industry 2019 & 2032
- Table 102: Global Test and Measurement Equipment Industry Volume K Unit Forecast, by End-user Industry 2019 & 2032
- Table 103: Global Test and Measurement Equipment Industry Revenue Million Forecast, by Country 2019 & 2032
- Table 104: Global Test and Measurement Equipment Industry Volume K Unit Forecast, by Country 2019 & 2032
- Table 105: Global Test and Measurement Equipment Industry Revenue Million Forecast, by Type 2019 & 2032
- Table 106: Global Test and Measurement Equipment Industry Volume K Unit Forecast, by Type 2019 & 2032
- Table 107: Global Test and Measurement Equipment Industry Revenue Million Forecast, by End-user Industry 2019 & 2032
- Table 108: Global Test and Measurement Equipment Industry Volume K Unit Forecast, by End-user Industry 2019 & 2032
- Table 109: Global Test and Measurement Equipment Industry Revenue Million Forecast, by Country 2019 & 2032
- Table 110: Global Test and Measurement Equipment Industry Volume K Unit Forecast, by Country 2019 & 2032
- Table 111: Global Test and Measurement Equipment Industry Revenue Million Forecast, by Type 2019 & 2032
- Table 112: Global Test and Measurement Equipment Industry Volume K Unit Forecast, by Type 2019 & 2032
- Table 113: Global Test and Measurement Equipment Industry Revenue Million Forecast, by End-user Industry 2019 & 2032
- Table 114: Global Test and Measurement Equipment Industry Volume K Unit Forecast, by End-user Industry 2019 & 2032
- Table 115: Global Test and Measurement Equipment Industry Revenue Million Forecast, by Country 2019 & 2032
- Table 116: Global Test and Measurement Equipment Industry Volume K Unit Forecast, by Country 2019 & 2032
- Table 117: Global Test and Measurement Equipment Industry Revenue Million Forecast, by Type 2019 & 2032
- Table 118: Global Test and Measurement Equipment Industry Volume K Unit Forecast, by Type 2019 & 2032
- Table 119: Global Test and Measurement Equipment Industry Revenue Million Forecast, by End-user Industry 2019 & 2032
- Table 120: Global Test and Measurement Equipment Industry Volume K Unit Forecast, by End-user Industry 2019 & 2032
- Table 121: Global Test and Measurement Equipment Industry Revenue Million Forecast, by Country 2019 & 2032
- Table 122: Global Test and Measurement Equipment Industry Volume K Unit Forecast, by Country 2019 & 2032
- Table 123: Global Test and Measurement Equipment Industry Revenue Million Forecast, by Type 2019 & 2032
- Table 124: Global Test and Measurement Equipment Industry Volume K Unit Forecast, by Type 2019 & 2032
- Table 125: Global Test and Measurement Equipment Industry Revenue Million Forecast, by End-user Industry 2019 & 2032
- Table 126: Global Test and Measurement Equipment Industry Volume K Unit Forecast, by End-user Industry 2019 & 2032
- Table 127: Global Test and Measurement Equipment Industry Revenue Million Forecast, by Country 2019 & 2032
- Table 128: Global Test and Measurement Equipment Industry Volume K Unit Forecast, by Country 2019 & 2032
- Table 129: Global Test and Measurement Equipment Industry Revenue Million Forecast, by Type 2019 & 2032
- Table 130: Global Test and Measurement Equipment Industry Volume K Unit Forecast, by Type 2019 & 2032
- Table 131: Global Test and Measurement Equipment Industry Revenue Million Forecast, by End-user Industry 2019 & 2032
- Table 132: Global Test and Measurement Equipment Industry Volume K Unit Forecast, by End-user Industry 2019 & 2032
- Table 133: Global Test and Measurement Equipment Industry Revenue Million Forecast, by Country 2019 & 2032
- Table 134: Global Test and Measurement Equipment Industry Volume K Unit Forecast, by Country 2019 & 2032
Frequently Asked Questions
1. What is the projected Compound Annual Growth Rate (CAGR) of the Test and Measurement Equipment Industry?
The projected CAGR is approximately 4.29%.
2. Which companies are prominent players in the Test and Measurement Equipment Industry?
Key companies in the market include Rohde & Schwarz GmbH & Co KG, Anritsu Corporation, Teradyne Inc, National Instruments Corporation, Yokogawa Test & Measurement Corporation (Yokogawa Electric Corporation), Advantest Corporatio, Chauvin Arnoux Group, Fortive Corporation, Teledyne Lecroy (Teledyne Technologies Incorporated), Keysight Technologies Inc.
3. What are the main segments of the Test and Measurement Equipment Industry?
The market segments include Type, End-user Industry.
4. Can you provide details about the market size?
The market size is estimated to be USD 15.02 Million as of 2022.
5. What are some drivers contributing to market growth?
Technological Advancements Leading to the need for Test and Measurement Equipment; Emerging Trend of Electric and Hybrid Vehicle.
6. What are the notable trends driving market growth?
Semiconductors and Computing to be the Largest End-user Industry.
7. Are there any restraints impacting market growth?
Difficulty in Integrating Firewalls with Existing Network Infrastructure; Complexity of Deploying and Managing Firewalls due to Limited Expertise.
8. Can you provide examples of recent developments in the market?
July 2023: Teradyne Unveils Archimedes Analytics Solution officially launched the Teradyne Archimedes Analytics Solution, a groundbreaking open architecture that introduces real-time analytics into semiconductor testing. This innovation streamlines test processes, enhances yield rates, and reduces costs, all while mitigating security concerns associated with cloud-based alternatives. With the semiconductor industry witnessing a growing demand for high-quality devices employing advanced processes, comprehensive test and analytics solutions have become indispensable.
9. What pricing options are available for accessing the report?
Pricing options include single-user, multi-user, and enterprise licenses priced at USD 4750, USD 5250, and USD 8750 respectively.
10. Is the market size provided in terms of value or volume?
The market size is provided in terms of value, measured in Million and volume, measured in K Unit.
11. Are there any specific market keywords associated with the report?
Yes, the market keyword associated with the report is "Test and Measurement Equipment Industry," which aids in identifying and referencing the specific market segment covered.
12. How do I determine which pricing option suits my needs best?
The pricing options vary based on user requirements and access needs. Individual users may opt for single-user licenses, while businesses requiring broader access may choose multi-user or enterprise licenses for cost-effective access to the report.
13. Are there any additional resources or data provided in the Test and Measurement Equipment Industry report?
While the report offers comprehensive insights, it's advisable to review the specific contents or supplementary materials provided to ascertain if additional resources or data are available.
14. How can I stay updated on further developments or reports in the Test and Measurement Equipment Industry?
To stay informed about further developments, trends, and reports in the Test and Measurement Equipment Industry, consider subscribing to industry newsletters, following relevant companies and organizations, or regularly checking reputable industry news sources and publications.
Methodology
Step 1 - Identification of Relevant Samples Size from Population Database


Step 2 - Approaches for Defining Global Market Size (Value, Volume* & Price*)

Note*: In applicable scenarios
Step 3 - Data Sources
Primary Research
- Web Analytics
- Survey Reports
- Research Institute
- Latest Research Reports
- Opinion Leaders
Secondary Research
- Annual Reports
- White Paper
- Latest Press Release
- Industry Association
- Paid Database
- Investor Presentations

Step 4 - Data Triangulation
Involves using different sources of information in order to increase the validity of a study
These sources are likely to be stakeholders in a program - participants, other researchers, program staff, other community members, and so on.
Then we put all data in single framework & apply various statistical tools to find out the dynamic on the market.
During the analysis stage, feedback from the stakeholder groups would be compared to determine areas of agreement as well as areas of divergence
