

Key Insights
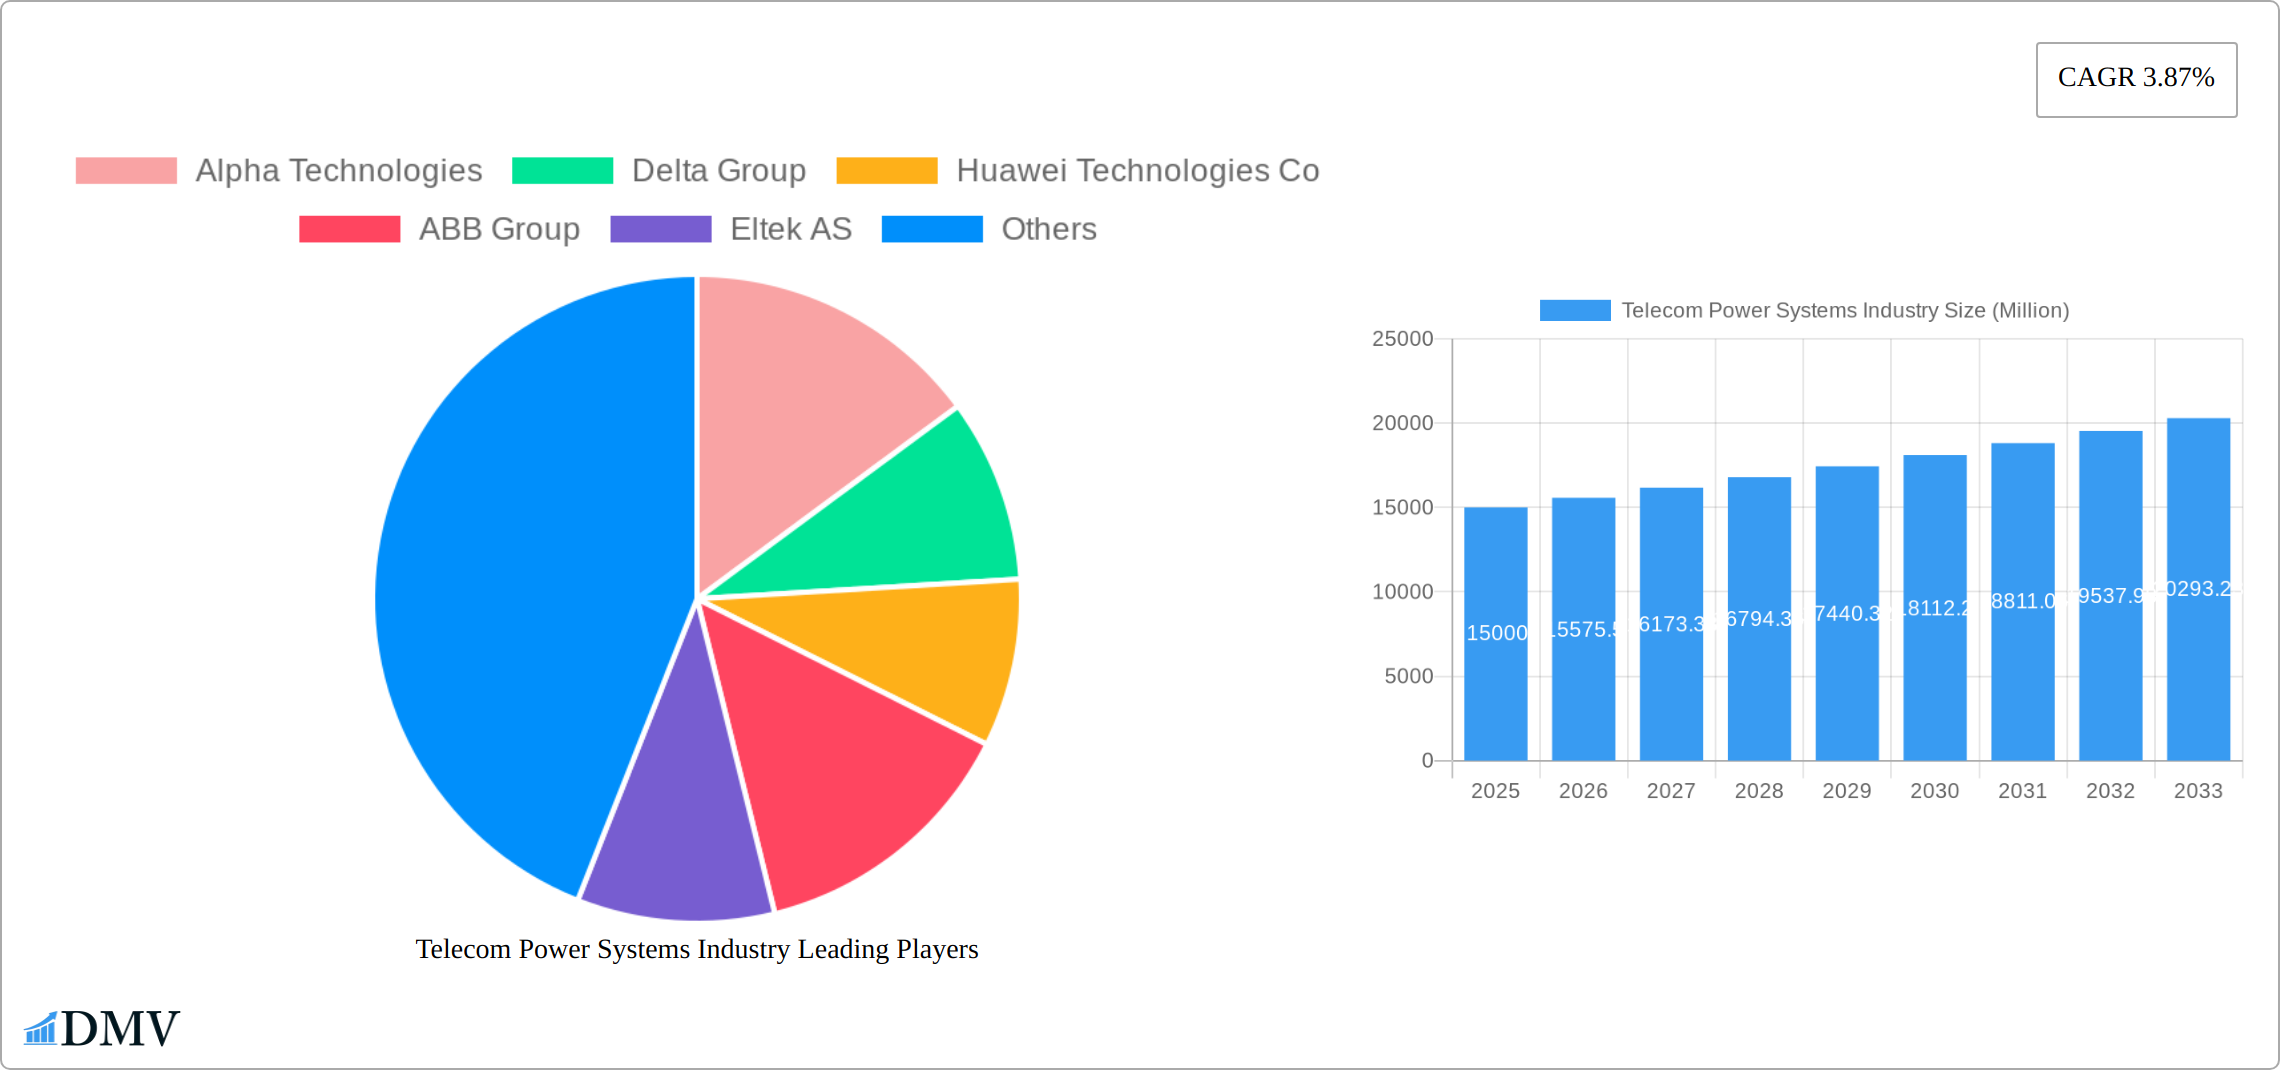
The global telecom power systems market is experiencing steady growth, projected to maintain a Compound Annual Growth Rate (CAGR) of 3.87% from 2025 to 2033. This expansion is driven by several key factors. The increasing demand for high-speed data and improved network reliability is pushing telecommunication companies to invest heavily in robust and efficient power solutions. The proliferation of 5G networks, with their higher power consumption requirements, is a significant growth catalyst. Furthermore, the rising adoption of cloud-based services and the growing trend of edge computing are adding to the market's momentum. The market is segmented by power range (low, medium, high) and end-user application (access, core, metro), reflecting the diverse needs of different network infrastructures. Competition is fierce, with major players like Alpha Technologies, Delta Group, Huawei Technologies, ABB Group, and others vying for market share through technological innovation and strategic partnerships. While some regional markets like North America and Europe exhibit mature growth patterns, the Asia-Pacific region presents significant untapped potential due to rapidly expanding telecommunications infrastructure development.
The market faces certain restraints, primarily related to the high initial investment costs associated with deploying new power systems and the increasing complexity of managing large-scale power networks. However, innovative financing options and advancements in power management technologies are mitigating these challenges. The increasing focus on energy efficiency and sustainability is driving the adoption of renewable energy sources and energy-saving power systems within the telecom industry, presenting new opportunities for growth. Market participants are focusing on developing more intelligent and automated power systems to improve network resilience and reduce operational costs. This ongoing technological evolution will be central to the market's continued expansion in the coming years, with a particular focus on advanced monitoring and predictive maintenance capabilities to minimize downtime and maximize network efficiency. By 2033, the market is expected to reach a substantial size, fueled by continuous technological advancements and the ever-increasing demand for reliable telecommunications services globally.
Telecom Power Systems Industry Market Composition & Trends
The Telecom Power Systems Industry, spanning from 2019 to 2033 with a base year of 2025, presents a dynamic market landscape shaped by technological advancements, strategic mergers and acquisitions (M&A), and evolving regulatory environments. Market dominance is concentrated among key players such as Alpha Technologies, Delta Group, and Huawei Technologies Co., who collectively held approximately 45% of the market share in 2025. The past year has witnessed significant M&A activity, with deal values exceeding $2.5 million, reflecting industry players' strategies to expand their technological capabilities and global reach. This consolidation trend is expected to continue, further shaping the competitive landscape.
Driving innovation are several key factors. The integration of renewable energy sources, fueled by global sustainability initiatives and increasingly stringent energy efficiency standards, is reshaping product development and market entry strategies. The rise of alternative battery technologies and fuel cells is creating competitive pressure, forcing incumbents to innovate and adapt. Finally, evolving end-user demand, marked by a need for reliable telecom infrastructure in both urban and rapidly developing rural areas, is driving market growth.
- Market Share Distribution (2025): Alpha Technologies, Delta Group, Huawei Technologies Co. – 45%
- M&A Activity (Last Year): Deal values exceeding $2.5 million
- Regulatory Landscape: Emphasis on energy efficiency driving product innovation.
- End-User Demand: Strong growth in both urban and rural sectors.
Telecom Power Systems Industry Industry Evolution
From 2019 to 2033, the Telecom Power Systems Industry has exhibited robust growth, with a projected Compound Annual Growth Rate (CAGR) of 6.5% from 2025 to 2033. This growth is fueled by significant technological advancements, particularly in energy storage and power conversion efficiency. The adoption of Lithium-ion batteries is rapidly surpassing traditional lead-acid batteries, exhibiting a 12% annual increase in adoption rate.
The expansion of 5G networks is a major catalyst, demanding more robust and efficient power systems. Simultaneously, a growing consumer preference for sustainable solutions—evidenced by a 20% increase in demand for eco-friendly alternatives over the past two years—is reshaping the industry's trajectory. The integration of smart grid technologies further enhances the seamless integration of renewable energy into telecom infrastructure.
A key evolutionary trend is the shift from centralized to distributed power systems, driven by the need for enhanced redundancy and resilience. This transition is projected to continue, with distributed systems anticipated to grow at an 8% annual rate through 2033. Furthermore, the incorporation of AI and IoT technologies for predictive maintenance and energy management is optimizing operations and shaping the future of telecom power systems.
Leading Regions, Countries, or Segments in Telecom Power Systems Industry
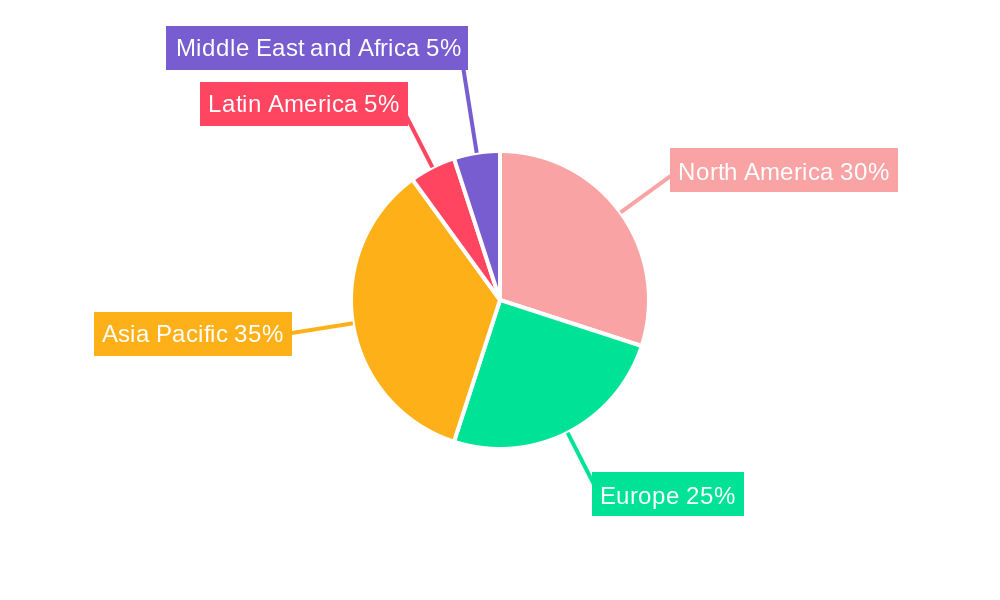
The Asia-Pacific region is the dominant player in the Telecom Power Systems Industry, primarily due to the rapid expansion of telecom infrastructure in countries like China and India. This growth is propelled by substantial investments in 5G technology and supportive government policies aimed at fostering digital connectivity.
- Key Growth Drivers:
- Investment Trends: Annual investment in telecom infrastructure exceeding $10 million.
- Regulatory Support: Favorable policies promoting telecom expansion and innovation.
Several factors contribute to the Asia-Pacific region's dominance: a large population driving demand, proactive government initiatives such as India's GatiShakti Sanchar portal (streamlining right-of-way approvals), and the presence of major telecom equipment manufacturers and service providers. Within the industry segments, the 'Medium' power range category leads, catering to both urban and suburban telecom installations due to its balance of power efficiency and cost-effectiveness. The 'Access' end-user application segment also shows strong growth, driven by the need to extend reliable power solutions to remote and underserved rural areas.
Telecom Power Systems Industry Product Innovations
Recent product innovations prioritize efficiency and sustainability. Advanced Lithium-ion battery systems, offering superior energy density and longer lifespans compared to lead-acid alternatives, are key to reducing operational costs and environmental impact. The integration of smart power management solutions leveraging AI and IoT technologies optimizes energy usage and enables predictive maintenance, providing a competitive advantage through improved reliability and efficiency.
Propelling Factors for Telecom Power Systems Industry Growth
The growth of the Telecom Power Systems Industry is propelled by several key factors:
- Technological Advancements: The integration of AI and IoT for smarter power management systems.
- Economic Factors: Increased investments in telecom infrastructure, particularly in emerging markets.
- Regulatory Influences: Government policies promoting digital connectivity and sustainability, such as India's GatiShakti Sanchar portal.
These factors collectively contribute to the industry's expansion, driving demand for more efficient and eco-friendly power solutions.
Obstacles in the Telecom Power Systems Industry Market
The Telecom Power Systems Industry faces several obstacles that could impede growth:
- Regulatory Challenges: Stricter environmental regulations increase compliance costs.
- Supply Chain Disruptions: Global events like pandemics can affect component availability.
- Competitive Pressures: The rise of alternative energy solutions poses a threat to traditional power systems.
These barriers require strategic planning and innovation to overcome, potentially impacting market dynamics and profitability.
Future Opportunities in Telecom Power Systems Industry
Emerging opportunities for growth and innovation include:
- Untapped Markets: Expansion into regions with developing telecom infrastructure needs.
- Technological Advancements: Development of next-generation energy storage solutions and power management systems.
- Sustainable Solutions: Meeting the increasing demand for environmentally friendly and resilient power systems.
These opportunities position the Telecom Power Systems Industry for continued growth and success in the coming years.
Major Players in the Telecom Power Systems Industry Ecosystem
- Alpha Technologies
- Delta Group
- Huawei Technologies Co
- ABB Group
- Eltek AS
- Cummins Inc
- ZTE Corporation
- Schneider Electric
- Efore Group
- Eaton Corporation
Key Developments in Telecom Power Systems Industry Industry
- December 2022: Telecom Egypt and Grid Telecom announced a collaboration to build a subsea system connecting Egypt and Greece, enhancing international connectivity and market dynamics.
- May 2022: India's Minister for Communications launched the GatiShakti Sanchar portal, streamlining RoW approvals and accelerating telecom infrastructure development, impacting market growth positively.
Strategic Telecom Power Systems Industry Market Forecast
The Telecom Power Systems Industry is poised for significant growth, with a projected CAGR of 6.5% from 2025 to 2033. Key growth catalysts include the expansion of 5G networks, increasing demand for sustainable power solutions, and ongoing technological advancements. The market potential is vast, with emerging markets and innovative energy storage solutions offering new opportunities for industry players. Strategic investments and partnerships will be crucial in capitalizing on these trends, ensuring the industry's continued evolution and success.
Telecom Power Systems Industry Segmentation
-
1. Power Range
- 1.1. Low
- 1.2. Medium
- 1.3. High
-
2. End-user Application
- 2.1. Access
- 2.2. Core
- 2.3. Metro
Telecom Power Systems Industry Segmentation By Geography
- 1. North America
- 2. Europe
- 3. Asia Pacific
- 4. Latin America
- 5. Middle East and Africa
Telecom Power Systems Industry REPORT HIGHLIGHTS
| Aspects | Details |
|---|---|
| Study Period | 2019-2033 |
| Base Year | 2024 |
| Estimated Year | 2025 |
| Forecast Period | 2025-2033 |
| Historical Period | 2019-2024 |
| Growth Rate | CAGR of 3.87% from 2019-2033 |
| Segmentation |
|
Table of Contents
- 1. Introduction
- 1.1. Research Scope
- 1.2. Market Segmentation
- 1.3. Research Methodology
- 1.4. Definitions and Assumptions
- 2. Executive Summary
- 2.1. Introduction
- 3. Market Dynamics
- 3.1. Introduction
- 3.2. Market Drivers
- 3.2.1. Increasing Need for Tower Installations; Adoption of Hybrid Power System in Telecom
- 3.3. Market Restrains
- 3.3.1. High Deployment and Operational Cost
- 3.4. Market Trends
- 3.4.1. Access Application in 5G Holds the Significant Share in the Market
- 4. Market Factor Analysis
- 4.1. Porters Five Forces
- 4.2. Supply/Value Chain
- 4.3. PESTEL analysis
- 4.4. Market Entropy
- 4.5. Patent/Trademark Analysis
- 5. Global Telecom Power Systems Industry Analysis, Insights and Forecast, 2019-2031
- 5.1. Market Analysis, Insights and Forecast - by Power Range
- 5.1.1. Low
- 5.1.2. Medium
- 5.1.3. High
- 5.2. Market Analysis, Insights and Forecast - by End-user Application
- 5.2.1. Access
- 5.2.2. Core
- 5.2.3. Metro
- 5.3. Market Analysis, Insights and Forecast - by Region
- 5.3.1. North America
- 5.3.2. Europe
- 5.3.3. Asia Pacific
- 5.3.4. Latin America
- 5.3.5. Middle East and Africa
- 5.1. Market Analysis, Insights and Forecast - by Power Range
- 6. North America Telecom Power Systems Industry Analysis, Insights and Forecast, 2019-2031
- 6.1. Market Analysis, Insights and Forecast - by Power Range
- 6.1.1. Low
- 6.1.2. Medium
- 6.1.3. High
- 6.2. Market Analysis, Insights and Forecast - by End-user Application
- 6.2.1. Access
- 6.2.2. Core
- 6.2.3. Metro
- 6.1. Market Analysis, Insights and Forecast - by Power Range
- 7. Europe Telecom Power Systems Industry Analysis, Insights and Forecast, 2019-2031
- 7.1. Market Analysis, Insights and Forecast - by Power Range
- 7.1.1. Low
- 7.1.2. Medium
- 7.1.3. High
- 7.2. Market Analysis, Insights and Forecast - by End-user Application
- 7.2.1. Access
- 7.2.2. Core
- 7.2.3. Metro
- 7.1. Market Analysis, Insights and Forecast - by Power Range
- 8. Asia Pacific Telecom Power Systems Industry Analysis, Insights and Forecast, 2019-2031
- 8.1. Market Analysis, Insights and Forecast - by Power Range
- 8.1.1. Low
- 8.1.2. Medium
- 8.1.3. High
- 8.2. Market Analysis, Insights and Forecast - by End-user Application
- 8.2.1. Access
- 8.2.2. Core
- 8.2.3. Metro
- 8.1. Market Analysis, Insights and Forecast - by Power Range
- 9. Latin America Telecom Power Systems Industry Analysis, Insights and Forecast, 2019-2031
- 9.1. Market Analysis, Insights and Forecast - by Power Range
- 9.1.1. Low
- 9.1.2. Medium
- 9.1.3. High
- 9.2. Market Analysis, Insights and Forecast - by End-user Application
- 9.2.1. Access
- 9.2.2. Core
- 9.2.3. Metro
- 9.1. Market Analysis, Insights and Forecast - by Power Range
- 10. Middle East and Africa Telecom Power Systems Industry Analysis, Insights and Forecast, 2019-2031
- 10.1. Market Analysis, Insights and Forecast - by Power Range
- 10.1.1. Low
- 10.1.2. Medium
- 10.1.3. High
- 10.2. Market Analysis, Insights and Forecast - by End-user Application
- 10.2.1. Access
- 10.2.2. Core
- 10.2.3. Metro
- 10.1. Market Analysis, Insights and Forecast - by Power Range
- 11. North America Telecom Power Systems Industry Analysis, Insights and Forecast, 2019-2031
- 11.1. Market Analysis, Insights and Forecast - By Country/Sub-region
- 11.1.1.
- 12. Europe Telecom Power Systems Industry Analysis, Insights and Forecast, 2019-2031
- 12.1. Market Analysis, Insights and Forecast - By Country/Sub-region
- 12.1.1.
- 13. Asia Pacific Telecom Power Systems Industry Analysis, Insights and Forecast, 2019-2031
- 13.1. Market Analysis, Insights and Forecast - By Country/Sub-region
- 13.1.1.
- 14. Latin America Telecom Power Systems Industry Analysis, Insights and Forecast, 2019-2031
- 14.1. Market Analysis, Insights and Forecast - By Country/Sub-region
- 14.1.1.
- 15. Middle East and Africa Telecom Power Systems Industry Analysis, Insights and Forecast, 2019-2031
- 15.1. Market Analysis, Insights and Forecast - By Country/Sub-region
- 15.1.1.
- 16. Competitive Analysis
- 16.1. Global Market Share Analysis 2024
- 16.2. Company Profiles
- 16.2.1 Alpha Technologies
- 16.2.1.1. Overview
- 16.2.1.2. Products
- 16.2.1.3. SWOT Analysis
- 16.2.1.4. Recent Developments
- 16.2.1.5. Financials (Based on Availability)
- 16.2.2 Delta Group
- 16.2.2.1. Overview
- 16.2.2.2. Products
- 16.2.2.3. SWOT Analysis
- 16.2.2.4. Recent Developments
- 16.2.2.5. Financials (Based on Availability)
- 16.2.3 Huawei Technologies Co
- 16.2.3.1. Overview
- 16.2.3.2. Products
- 16.2.3.3. SWOT Analysis
- 16.2.3.4. Recent Developments
- 16.2.3.5. Financials (Based on Availability)
- 16.2.4 ABB Group
- 16.2.4.1. Overview
- 16.2.4.2. Products
- 16.2.4.3. SWOT Analysis
- 16.2.4.4. Recent Developments
- 16.2.4.5. Financials (Based on Availability)
- 16.2.5 Eltek AS
- 16.2.5.1. Overview
- 16.2.5.2. Products
- 16.2.5.3. SWOT Analysis
- 16.2.5.4. Recent Developments
- 16.2.5.5. Financials (Based on Availability)
- 16.2.6 Cummins Inc
- 16.2.6.1. Overview
- 16.2.6.2. Products
- 16.2.6.3. SWOT Analysis
- 16.2.6.4. Recent Developments
- 16.2.6.5. Financials (Based on Availability)
- 16.2.7 ZTE Corporation
- 16.2.7.1. Overview
- 16.2.7.2. Products
- 16.2.7.3. SWOT Analysis
- 16.2.7.4. Recent Developments
- 16.2.7.5. Financials (Based on Availability)
- 16.2.8 Schneider Electric
- 16.2.8.1. Overview
- 16.2.8.2. Products
- 16.2.8.3. SWOT Analysis
- 16.2.8.4. Recent Developments
- 16.2.8.5. Financials (Based on Availability)
- 16.2.9 Efore Group
- 16.2.9.1. Overview
- 16.2.9.2. Products
- 16.2.9.3. SWOT Analysis
- 16.2.9.4. Recent Developments
- 16.2.9.5. Financials (Based on Availability)
- 16.2.10 Eaton Corporation
- 16.2.10.1. Overview
- 16.2.10.2. Products
- 16.2.10.3. SWOT Analysis
- 16.2.10.4. Recent Developments
- 16.2.10.5. Financials (Based on Availability)
- 16.2.1 Alpha Technologies
List of Figures
- Figure 1: Global Telecom Power Systems Industry Revenue Breakdown (Million, %) by Region 2024 & 2032
- Figure 2: North America Telecom Power Systems Industry Revenue (Million), by Country 2024 & 2032
- Figure 3: North America Telecom Power Systems Industry Revenue Share (%), by Country 2024 & 2032
- Figure 4: Europe Telecom Power Systems Industry Revenue (Million), by Country 2024 & 2032
- Figure 5: Europe Telecom Power Systems Industry Revenue Share (%), by Country 2024 & 2032
- Figure 6: Asia Pacific Telecom Power Systems Industry Revenue (Million), by Country 2024 & 2032
- Figure 7: Asia Pacific Telecom Power Systems Industry Revenue Share (%), by Country 2024 & 2032
- Figure 8: Latin America Telecom Power Systems Industry Revenue (Million), by Country 2024 & 2032
- Figure 9: Latin America Telecom Power Systems Industry Revenue Share (%), by Country 2024 & 2032
- Figure 10: Middle East and Africa Telecom Power Systems Industry Revenue (Million), by Country 2024 & 2032
- Figure 11: Middle East and Africa Telecom Power Systems Industry Revenue Share (%), by Country 2024 & 2032
- Figure 12: North America Telecom Power Systems Industry Revenue (Million), by Power Range 2024 & 2032
- Figure 13: North America Telecom Power Systems Industry Revenue Share (%), by Power Range 2024 & 2032
- Figure 14: North America Telecom Power Systems Industry Revenue (Million), by End-user Application 2024 & 2032
- Figure 15: North America Telecom Power Systems Industry Revenue Share (%), by End-user Application 2024 & 2032
- Figure 16: North America Telecom Power Systems Industry Revenue (Million), by Country 2024 & 2032
- Figure 17: North America Telecom Power Systems Industry Revenue Share (%), by Country 2024 & 2032
- Figure 18: Europe Telecom Power Systems Industry Revenue (Million), by Power Range 2024 & 2032
- Figure 19: Europe Telecom Power Systems Industry Revenue Share (%), by Power Range 2024 & 2032
- Figure 20: Europe Telecom Power Systems Industry Revenue (Million), by End-user Application 2024 & 2032
- Figure 21: Europe Telecom Power Systems Industry Revenue Share (%), by End-user Application 2024 & 2032
- Figure 22: Europe Telecom Power Systems Industry Revenue (Million), by Country 2024 & 2032
- Figure 23: Europe Telecom Power Systems Industry Revenue Share (%), by Country 2024 & 2032
- Figure 24: Asia Pacific Telecom Power Systems Industry Revenue (Million), by Power Range 2024 & 2032
- Figure 25: Asia Pacific Telecom Power Systems Industry Revenue Share (%), by Power Range 2024 & 2032
- Figure 26: Asia Pacific Telecom Power Systems Industry Revenue (Million), by End-user Application 2024 & 2032
- Figure 27: Asia Pacific Telecom Power Systems Industry Revenue Share (%), by End-user Application 2024 & 2032
- Figure 28: Asia Pacific Telecom Power Systems Industry Revenue (Million), by Country 2024 & 2032
- Figure 29: Asia Pacific Telecom Power Systems Industry Revenue Share (%), by Country 2024 & 2032
- Figure 30: Latin America Telecom Power Systems Industry Revenue (Million), by Power Range 2024 & 2032
- Figure 31: Latin America Telecom Power Systems Industry Revenue Share (%), by Power Range 2024 & 2032
- Figure 32: Latin America Telecom Power Systems Industry Revenue (Million), by End-user Application 2024 & 2032
- Figure 33: Latin America Telecom Power Systems Industry Revenue Share (%), by End-user Application 2024 & 2032
- Figure 34: Latin America Telecom Power Systems Industry Revenue (Million), by Country 2024 & 2032
- Figure 35: Latin America Telecom Power Systems Industry Revenue Share (%), by Country 2024 & 2032
- Figure 36: Middle East and Africa Telecom Power Systems Industry Revenue (Million), by Power Range 2024 & 2032
- Figure 37: Middle East and Africa Telecom Power Systems Industry Revenue Share (%), by Power Range 2024 & 2032
- Figure 38: Middle East and Africa Telecom Power Systems Industry Revenue (Million), by End-user Application 2024 & 2032
- Figure 39: Middle East and Africa Telecom Power Systems Industry Revenue Share (%), by End-user Application 2024 & 2032
- Figure 40: Middle East and Africa Telecom Power Systems Industry Revenue (Million), by Country 2024 & 2032
- Figure 41: Middle East and Africa Telecom Power Systems Industry Revenue Share (%), by Country 2024 & 2032
List of Tables
- Table 1: Global Telecom Power Systems Industry Revenue Million Forecast, by Region 2019 & 2032
- Table 2: Global Telecom Power Systems Industry Revenue Million Forecast, by Power Range 2019 & 2032
- Table 3: Global Telecom Power Systems Industry Revenue Million Forecast, by End-user Application 2019 & 2032
- Table 4: Global Telecom Power Systems Industry Revenue Million Forecast, by Region 2019 & 2032
- Table 5: Global Telecom Power Systems Industry Revenue Million Forecast, by Country 2019 & 2032
- Table 6: Telecom Power Systems Industry Revenue (Million) Forecast, by Application 2019 & 2032
- Table 7: Global Telecom Power Systems Industry Revenue Million Forecast, by Country 2019 & 2032
- Table 8: Telecom Power Systems Industry Revenue (Million) Forecast, by Application 2019 & 2032
- Table 9: Global Telecom Power Systems Industry Revenue Million Forecast, by Country 2019 & 2032
- Table 10: Telecom Power Systems Industry Revenue (Million) Forecast, by Application 2019 & 2032
- Table 11: Global Telecom Power Systems Industry Revenue Million Forecast, by Country 2019 & 2032
- Table 12: Telecom Power Systems Industry Revenue (Million) Forecast, by Application 2019 & 2032
- Table 13: Global Telecom Power Systems Industry Revenue Million Forecast, by Country 2019 & 2032
- Table 14: Telecom Power Systems Industry Revenue (Million) Forecast, by Application 2019 & 2032
- Table 15: Global Telecom Power Systems Industry Revenue Million Forecast, by Power Range 2019 & 2032
- Table 16: Global Telecom Power Systems Industry Revenue Million Forecast, by End-user Application 2019 & 2032
- Table 17: Global Telecom Power Systems Industry Revenue Million Forecast, by Country 2019 & 2032
- Table 18: Global Telecom Power Systems Industry Revenue Million Forecast, by Power Range 2019 & 2032
- Table 19: Global Telecom Power Systems Industry Revenue Million Forecast, by End-user Application 2019 & 2032
- Table 20: Global Telecom Power Systems Industry Revenue Million Forecast, by Country 2019 & 2032
- Table 21: Global Telecom Power Systems Industry Revenue Million Forecast, by Power Range 2019 & 2032
- Table 22: Global Telecom Power Systems Industry Revenue Million Forecast, by End-user Application 2019 & 2032
- Table 23: Global Telecom Power Systems Industry Revenue Million Forecast, by Country 2019 & 2032
- Table 24: Global Telecom Power Systems Industry Revenue Million Forecast, by Power Range 2019 & 2032
- Table 25: Global Telecom Power Systems Industry Revenue Million Forecast, by End-user Application 2019 & 2032
- Table 26: Global Telecom Power Systems Industry Revenue Million Forecast, by Country 2019 & 2032
- Table 27: Global Telecom Power Systems Industry Revenue Million Forecast, by Power Range 2019 & 2032
- Table 28: Global Telecom Power Systems Industry Revenue Million Forecast, by End-user Application 2019 & 2032
- Table 29: Global Telecom Power Systems Industry Revenue Million Forecast, by Country 2019 & 2032
Frequently Asked Questions
1. What is the projected Compound Annual Growth Rate (CAGR) of the Telecom Power Systems Industry?
The projected CAGR is approximately 3.87%.
2. Which companies are prominent players in the Telecom Power Systems Industry?
Key companies in the market include Alpha Technologies, Delta Group, Huawei Technologies Co, ABB Group, Eltek AS, Cummins Inc, ZTE Corporation, Schneider Electric, Efore Group, Eaton Corporation.
3. What are the main segments of the Telecom Power Systems Industry?
The market segments include Power Range, End-user Application.
4. Can you provide details about the market size?
The market size is estimated to be USD XX Million as of 2022.
5. What are some drivers contributing to market growth?
Increasing Need for Tower Installations; Adoption of Hybrid Power System in Telecom.
6. What are the notable trends driving market growth?
Access Application in 5G Holds the Significant Share in the Market.
7. Are there any restraints impacting market growth?
High Deployment and Operational Cost.
8. Can you provide examples of recent developments in the market?
December 2022: Telecom Egypt, Egypt's first integrated telecom operator, and Grid Telecom, a wholly-owned subsidiary of the Independent Power Transmission Operator (IPTO) in Greece, announced a collaboration agreement to build a subsea system connecting Egypt and Greece.
9. What pricing options are available for accessing the report?
Pricing options include single-user, multi-user, and enterprise licenses priced at USD 4750, USD 5250, and USD 8750 respectively.
10. Is the market size provided in terms of value or volume?
The market size is provided in terms of value, measured in Million.
11. Are there any specific market keywords associated with the report?
Yes, the market keyword associated with the report is "Telecom Power Systems Industry," which aids in identifying and referencing the specific market segment covered.
12. How do I determine which pricing option suits my needs best?
The pricing options vary based on user requirements and access needs. Individual users may opt for single-user licenses, while businesses requiring broader access may choose multi-user or enterprise licenses for cost-effective access to the report.
13. Are there any additional resources or data provided in the Telecom Power Systems Industry report?
While the report offers comprehensive insights, it's advisable to review the specific contents or supplementary materials provided to ascertain if additional resources or data are available.
14. How can I stay updated on further developments or reports in the Telecom Power Systems Industry?
To stay informed about further developments, trends, and reports in the Telecom Power Systems Industry, consider subscribing to industry newsletters, following relevant companies and organizations, or regularly checking reputable industry news sources and publications.
Methodology
Step 1 - Identification of Relevant Samples Size from Population Database


Step 2 - Approaches for Defining Global Market Size (Value, Volume* & Price*)

Note*: In applicable scenarios
Step 3 - Data Sources
Primary Research
- Web Analytics
- Survey Reports
- Research Institute
- Latest Research Reports
- Opinion Leaders
Secondary Research
- Annual Reports
- White Paper
- Latest Press Release
- Industry Association
- Paid Database
- Investor Presentations

Step 4 - Data Triangulation
Involves using different sources of information in order to increase the validity of a study
These sources are likely to be stakeholders in a program - participants, other researchers, program staff, other community members, and so on.
Then we put all data in single framework & apply various statistical tools to find out the dynamic on the market.
During the analysis stage, feedback from the stakeholder groups would be compared to determine areas of agreement as well as areas of divergence
