

Key Insights
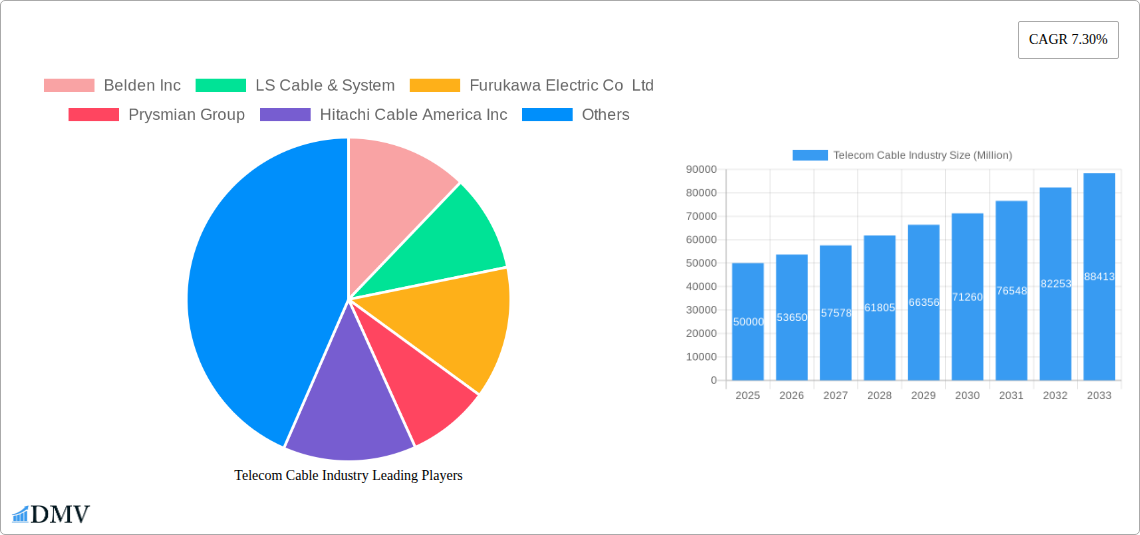
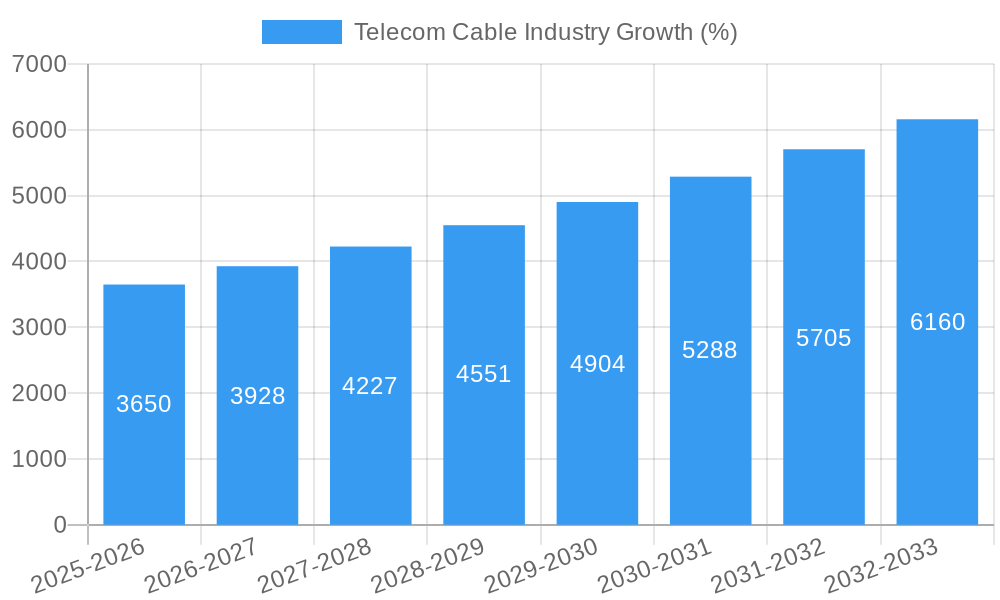
The global telecom cable market, valued at approximately $XX million in 2025, is projected to experience robust growth, driven by a compound annual growth rate (CAGR) of 7.30% from 2025 to 2033. This expansion is fueled by several key factors. The proliferation of 5G networks globally necessitates substantial infrastructure upgrades, significantly boosting demand for high-bandwidth fiber optic cables and advanced data center cabling solutions. Simultaneously, the rising adoption of cloud computing and the Internet of Things (IoT) further intensifies the need for reliable and high-capacity telecom cables to support the increased data transmission requirements. Growth in data centers, both hyperscale and colocation facilities, is a significant contributor, demanding substantial investments in high-density cabling infrastructure. Furthermore, ongoing expansion of broadband networks, particularly in developing economies, is creating lucrative opportunities for telecom cable manufacturers. While technological advancements continually improve cable performance and efficiency, the market faces challenges such as fluctuating raw material prices and intense competition among established players. Market segmentation reveals that fiber optic cables hold a leading position, driven by their superior bandwidth capacity, while the data center segment is experiencing particularly rapid growth. Geographic expansion also plays a key role, with North America and Asia-Pacific regions currently leading the market but substantial growth potential expected from emerging markets in other regions.
The competitive landscape is characterized by a mix of established global players and regional manufacturers. Major companies such as Belden Inc., Prysmian Group, and Sumitomo Electric Industries Ltd. are investing heavily in research and development to innovate their product offerings and meet the evolving needs of the telecom industry. Strategic partnerships, mergers, and acquisitions are also shaping the market dynamics, leading to consolidation and increased market share for leading players. The future outlook for the telecom cable market remains optimistic, with continued growth anticipated through 2033, driven by the sustained expansion of digital infrastructure globally. However, companies must focus on optimizing their supply chains, embracing sustainable practices, and continually adapting to technological advancements to maintain their competitiveness in this rapidly evolving market.
Telecom Cable Industry Market Report: 2019-2033
This comprehensive report provides a detailed analysis of the Telecom Cable Industry, offering invaluable insights for stakeholders seeking to navigate this dynamic market. The study period spans 2019-2033, with 2025 serving as both the base and estimated year. The forecast period covers 2025-2033, while the historical period encompasses 2019-2024. The report delves into market segmentation, competitive landscape, technological advancements, and future growth prospects, providing a robust foundation for strategic decision-making. The global market size is projected to reach xx Million by 2033.
Telecom Cable Industry Market Composition & Trends
This section evaluates the Telecom Cable Industry's competitive intensity, innovation drivers, regulatory environment, substitute products, and end-user trends. The market is characterized by a moderately concentrated landscape, with key players such as Prysmian Group, Belden Inc, and Sumitomo Electric Industries Ltd holding significant market share. The exact distribution varies across segments and regions, with Fiber Optic cables currently dominating and experiencing the fastest growth rate, followed by Data Center Cables and Mobile Networks. Innovation is fueled by advancements in fiber optic technology, higher bandwidth demands, and the need for enhanced data transmission speeds. Regulatory changes concerning 5G infrastructure rollout and data privacy significantly impact market dynamics. The increasing adoption of wireless technologies presents a key challenge as a substitute product. Significant M&A activity is observed, with deals valued at an estimated xx Million annually.
- Market Concentration: Moderately concentrated, with top 5 players holding approximately xx% market share in 2024.
- Innovation Catalysts: Advancements in fiber optics, 5G deployment, and data center expansion.
- Regulatory Landscape: Government regulations influencing 5G infrastructure and data privacy.
- Substitute Products: Wireless technologies pose a growing competitive threat.
- End-User Profiles: Telecom operators, data centers, CATV providers, and enterprise networks.
- M&A Activity: Significant activity with an estimated annual deal value of xx Million (2019-2024).
Telecom Cable Industry Industry Evolution
The Telecom Cable Industry has experienced significant growth driven by increasing bandwidth demands and the proliferation of data-intensive applications. From 2019 to 2024, the market registered a Compound Annual Growth Rate (CAGR) of approximately xx%. Technological advancements, such as the widespread adoption of fiber optics and the development of high-speed data center cables, have propelled market expansion. Consumer demand for faster internet speeds and reliable connectivity fuels continuous growth. The shift towards cloud computing and the Internet of Things (IoT) has further intensified the demand for high-bandwidth solutions. This trend is expected to persist in the forecast period, with a projected CAGR of xx% from 2025 to 2033. The transition to 5G networks promises to accelerate market expansion further in the coming years.
Leading Regions, Countries, or Segments in Telecom Cable Industry
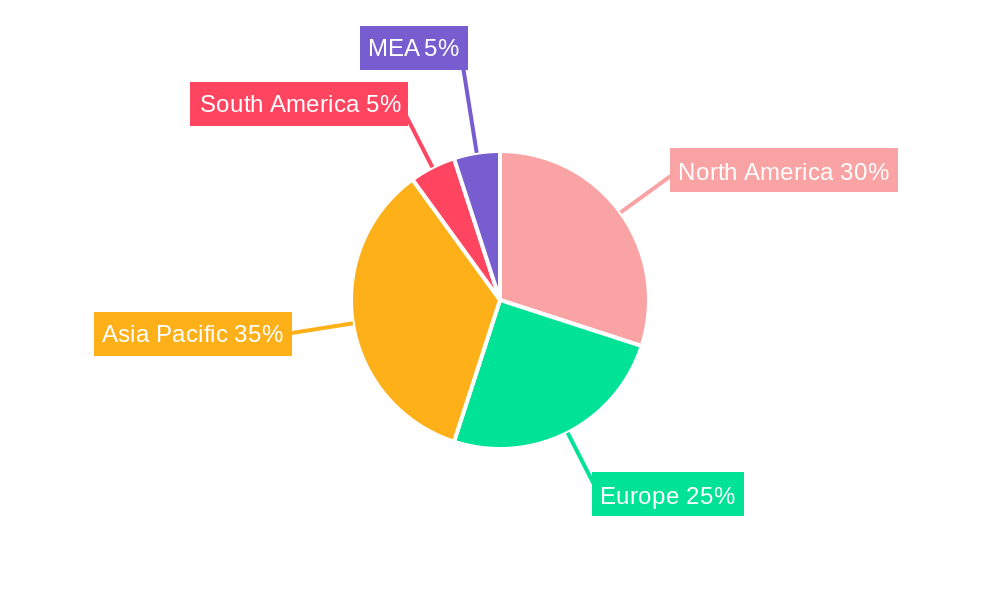
North America and Asia-Pacific currently dominate the Telecom Cable Industry, driven by substantial investments in infrastructure and high consumer demand for advanced telecommunications services. Within the segmentation, Fiber Optic cables lead due to their capacity for high-speed data transmission, followed closely by Data Center Cables.
- Key Drivers (North America): Significant investments in 5G infrastructure, government incentives for broadband expansion, and a robust data center market.
- Key Drivers (Asia-Pacific): Rapid urbanization, rising disposable incomes, increasing smartphone penetration, and growing demand for high-speed internet access.
- Dominant Segment (By Type): Fiber Optic cables, owing to their superior bandwidth capacity and long-distance transmission capabilities.
- Dominant Segment (By Application): Telecommunication applications and data centers represent the largest market segments, driven by the expanding telecom infrastructure and the rapid growth of cloud computing.
Telecom Cable Industry Product Innovations
Recent innovations focus on enhancing bandwidth, improving signal quality, and increasing durability. This includes the development of next-generation fiber optic cables with higher core counts, advanced data center cabling solutions optimized for high-density environments, and improved coaxial cables for improved signal transmission. These advancements are accompanied by the development of innovative materials and manufacturing techniques, leading to improved performance metrics and reduced costs. Unique selling propositions often revolve around superior performance, reduced signal loss, and enhanced durability.
Propelling Factors for Telecom Cable Industry Growth
Several factors drive Telecom Cable Industry growth. Technological advancements, such as higher-capacity fiber optics and improved data center cabling solutions, are key drivers. Economic growth and increased investments in telecom infrastructure globally boost demand. Government regulations supporting broadband expansion and 5G deployment further fuel market expansion. The increasing adoption of cloud computing and the IoT is another major driver.
Obstacles in the Telecom Cable Industry Market
The Telecom Cable Industry faces challenges such as fluctuating raw material prices, impacting production costs and profitability. Supply chain disruptions can lead to delays and increased costs. Intense competition from existing players and the emergence of new technologies also put pressure on margins. Stringent regulatory compliance requirements add to the operational complexity.
Future Opportunities in Telecom Cable Industry
Emerging opportunities lie in expanding into new markets with developing telecom infrastructure. Further advancements in fiber optics and development of new high-bandwidth solutions cater to increasing data demands. The growth of the IoT and 5G technologies creates substantial opportunities for cable manufacturers. Smart cities and autonomous vehicle initiatives drive additional growth potential.
Major Players in the Telecom Cable Industry Ecosystem
- Belden Inc (Belden Inc)
- LS Cable & System (LS Cable & System)
- Furukawa Electric Co Ltd (Furukawa Electric Co Ltd)
- Prysmian Group (Prysmian Group)
- Hitachi Cable America Inc
- Fujikura Ltd (Fujikura Ltd)
- Leoni AG (Leoni AG)
- Commscope Inc (Commscope Inc)
- Hengtong Group Co Ltd
- Sumitomo Electric Industries Ltd (Sumitomo Electric Industries Ltd)
Key Developments in Telecom Cable Industry Industry
- April 2021: Hitachi Cable America launched CableSuite (CableERP), an advanced ERP solution for wire and cable manufacturers.
- May 2022: Prysmian Group invested an additional USD 30 Million in expanding optical fiber cable capacity in North America, driven by government stimulus packages.
Strategic Telecom Cable Industry Market Forecast
The Telecom Cable Industry is poised for sustained growth, driven by the ongoing expansion of 5G networks, increasing demand for high-bandwidth data transmission, and the proliferation of data-intensive applications. The market is expected to witness significant expansion, particularly in developing economies and regions undergoing rapid infrastructure development. The integration of advanced technologies and innovative solutions will further fuel growth and reshape the industry landscape in the coming years.
Telecom Cable Industry Segmentation
-
1. Type
- 1.1. Coaxial Cable
- 1.2. Fiber Optic
- 1.3. Data Center Cables
- 1.4. Mobile Networks
- 1.5. Twisted Pair Cable
- 1.6. LAN Cables
-
2. Application
- 2.1. Telecommunication applications
- 2.2. Data Centers
- 2.3. CATV
- 2.4. Computer Network
- 2.5. Others
Telecom Cable Industry Segmentation By Geography
-
1. North America
- 1.1. United States
- 1.2. Canada
- 1.3. Mexico
-
2. Europe
- 2.1. Germany
- 2.2. France
- 2.3. Uk
- 2.4. Rest of Europe
-
3. Asia Pacific
- 3.1. Japan
- 3.2. China
- 3.3. India
- 3.4. Rest of Asia Pacific
- 4. Rest of the World
Telecom Cable Industry REPORT HIGHLIGHTS
| Aspects | Details |
|---|---|
| Study Period | 2019-2033 |
| Base Year | 2024 |
| Estimated Year | 2025 |
| Forecast Period | 2025-2033 |
| Historical Period | 2019-2024 |
| Growth Rate | CAGR of 7.30% from 2019-2033 |
| Segmentation |
|
Table of Contents
- 1. Introduction
- 1.1. Research Scope
- 1.2. Market Segmentation
- 1.3. Research Methodology
- 1.4. Definitions and Assumptions
- 2. Executive Summary
- 2.1. Introduction
- 3. Market Dynamics
- 3.1. Introduction
- 3.2. Market Drivers
- 3.2.1. Rise in the use of Internet and increasing acceptance of smartphones; Increased demand for Internet of Things (IoT)
- 3.3. Market Restrains
- 3.3.1. High cost of operation and maintenance of Telecom Cable
- 3.4. Market Trends
- 3.4.1. Rising Internet Penetration and Adoption of Smartphones
- 4. Market Factor Analysis
- 4.1. Porters Five Forces
- 4.2. Supply/Value Chain
- 4.3. PESTEL analysis
- 4.4. Market Entropy
- 4.5. Patent/Trademark Analysis
- 5. Global Telecom Cable Industry Analysis, Insights and Forecast, 2019-2031
- 5.1. Market Analysis, Insights and Forecast - by Type
- 5.1.1. Coaxial Cable
- 5.1.2. Fiber Optic
- 5.1.3. Data Center Cables
- 5.1.4. Mobile Networks
- 5.1.5. Twisted Pair Cable
- 5.1.6. LAN Cables
- 5.2. Market Analysis, Insights and Forecast - by Application
- 5.2.1. Telecommunication applications
- 5.2.2. Data Centers
- 5.2.3. CATV
- 5.2.4. Computer Network
- 5.2.5. Others
- 5.3. Market Analysis, Insights and Forecast - by Region
- 5.3.1. North America
- 5.3.2. Europe
- 5.3.3. Asia Pacific
- 5.3.4. Rest of the World
- 5.1. Market Analysis, Insights and Forecast - by Type
- 6. North America Telecom Cable Industry Analysis, Insights and Forecast, 2019-2031
- 6.1. Market Analysis, Insights and Forecast - by Type
- 6.1.1. Coaxial Cable
- 6.1.2. Fiber Optic
- 6.1.3. Data Center Cables
- 6.1.4. Mobile Networks
- 6.1.5. Twisted Pair Cable
- 6.1.6. LAN Cables
- 6.2. Market Analysis, Insights and Forecast - by Application
- 6.2.1. Telecommunication applications
- 6.2.2. Data Centers
- 6.2.3. CATV
- 6.2.4. Computer Network
- 6.2.5. Others
- 6.1. Market Analysis, Insights and Forecast - by Type
- 7. Europe Telecom Cable Industry Analysis, Insights and Forecast, 2019-2031
- 7.1. Market Analysis, Insights and Forecast - by Type
- 7.1.1. Coaxial Cable
- 7.1.2. Fiber Optic
- 7.1.3. Data Center Cables
- 7.1.4. Mobile Networks
- 7.1.5. Twisted Pair Cable
- 7.1.6. LAN Cables
- 7.2. Market Analysis, Insights and Forecast - by Application
- 7.2.1. Telecommunication applications
- 7.2.2. Data Centers
- 7.2.3. CATV
- 7.2.4. Computer Network
- 7.2.5. Others
- 7.1. Market Analysis, Insights and Forecast - by Type
- 8. Asia Pacific Telecom Cable Industry Analysis, Insights and Forecast, 2019-2031
- 8.1. Market Analysis, Insights and Forecast - by Type
- 8.1.1. Coaxial Cable
- 8.1.2. Fiber Optic
- 8.1.3. Data Center Cables
- 8.1.4. Mobile Networks
- 8.1.5. Twisted Pair Cable
- 8.1.6. LAN Cables
- 8.2. Market Analysis, Insights and Forecast - by Application
- 8.2.1. Telecommunication applications
- 8.2.2. Data Centers
- 8.2.3. CATV
- 8.2.4. Computer Network
- 8.2.5. Others
- 8.1. Market Analysis, Insights and Forecast - by Type
- 9. Rest of the World Telecom Cable Industry Analysis, Insights and Forecast, 2019-2031
- 9.1. Market Analysis, Insights and Forecast - by Type
- 9.1.1. Coaxial Cable
- 9.1.2. Fiber Optic
- 9.1.3. Data Center Cables
- 9.1.4. Mobile Networks
- 9.1.5. Twisted Pair Cable
- 9.1.6. LAN Cables
- 9.2. Market Analysis, Insights and Forecast - by Application
- 9.2.1. Telecommunication applications
- 9.2.2. Data Centers
- 9.2.3. CATV
- 9.2.4. Computer Network
- 9.2.5. Others
- 9.1. Market Analysis, Insights and Forecast - by Type
- 10. North America Telecom Cable Industry Analysis, Insights and Forecast, 2019-2031
- 10.1. Market Analysis, Insights and Forecast - By Country/Sub-region
- 10.1.1 United States
- 10.1.2 Canada
- 10.1.3 Mexico
- 11. Europe Telecom Cable Industry Analysis, Insights and Forecast, 2019-2031
- 11.1. Market Analysis, Insights and Forecast - By Country/Sub-region
- 11.1.1 Germany
- 11.1.2 United Kingdom
- 11.1.3 France
- 11.1.4 Spain
- 11.1.5 Italy
- 11.1.6 Spain
- 11.1.7 Belgium
- 11.1.8 Netherland
- 11.1.9 Nordics
- 11.1.10 Rest of Europe
- 12. Asia Pacific Telecom Cable Industry Analysis, Insights and Forecast, 2019-2031
- 12.1. Market Analysis, Insights and Forecast - By Country/Sub-region
- 12.1.1 China
- 12.1.2 Japan
- 12.1.3 India
- 12.1.4 South Korea
- 12.1.5 Southeast Asia
- 12.1.6 Australia
- 12.1.7 Indonesia
- 12.1.8 Phillipes
- 12.1.9 Singapore
- 12.1.10 Thailandc
- 12.1.11 Rest of Asia Pacific
- 13. South America Telecom Cable Industry Analysis, Insights and Forecast, 2019-2031
- 13.1. Market Analysis, Insights and Forecast - By Country/Sub-region
- 13.1.1 Brazil
- 13.1.2 Argentina
- 13.1.3 Peru
- 13.1.4 Chile
- 13.1.5 Colombia
- 13.1.6 Ecuador
- 13.1.7 Venezuela
- 13.1.8 Rest of South America
- 14. North America Telecom Cable Industry Analysis, Insights and Forecast, 2019-2031
- 14.1. Market Analysis, Insights and Forecast - By Country/Sub-region
- 14.1.1 United States
- 14.1.2 Canada
- 14.1.3 Mexico
- 15. MEA Telecom Cable Industry Analysis, Insights and Forecast, 2019-2031
- 15.1. Market Analysis, Insights and Forecast - By Country/Sub-region
- 15.1.1 United Arab Emirates
- 15.1.2 Saudi Arabia
- 15.1.3 South Africa
- 15.1.4 Rest of Middle East and Africa
- 16. Competitive Analysis
- 16.1. Global Market Share Analysis 2024
- 16.2. Company Profiles
- 16.2.1 Belden Inc
- 16.2.1.1. Overview
- 16.2.1.2. Products
- 16.2.1.3. SWOT Analysis
- 16.2.1.4. Recent Developments
- 16.2.1.5. Financials (Based on Availability)
- 16.2.2 LS Cable & System
- 16.2.2.1. Overview
- 16.2.2.2. Products
- 16.2.2.3. SWOT Analysis
- 16.2.2.4. Recent Developments
- 16.2.2.5. Financials (Based on Availability)
- 16.2.3 Furukawa Electric Co Ltd
- 16.2.3.1. Overview
- 16.2.3.2. Products
- 16.2.3.3. SWOT Analysis
- 16.2.3.4. Recent Developments
- 16.2.3.5. Financials (Based on Availability)
- 16.2.4 Prysmian Group
- 16.2.4.1. Overview
- 16.2.4.2. Products
- 16.2.4.3. SWOT Analysis
- 16.2.4.4. Recent Developments
- 16.2.4.5. Financials (Based on Availability)
- 16.2.5 Hitachi Cable America Inc
- 16.2.5.1. Overview
- 16.2.5.2. Products
- 16.2.5.3. SWOT Analysis
- 16.2.5.4. Recent Developments
- 16.2.5.5. Financials (Based on Availability)
- 16.2.6 Fujikura Ltd
- 16.2.6.1. Overview
- 16.2.6.2. Products
- 16.2.6.3. SWOT Analysis
- 16.2.6.4. Recent Developments
- 16.2.6.5. Financials (Based on Availability)
- 16.2.7 Leoni AG
- 16.2.7.1. Overview
- 16.2.7.2. Products
- 16.2.7.3. SWOT Analysis
- 16.2.7.4. Recent Developments
- 16.2.7.5. Financials (Based on Availability)
- 16.2.8 Commscope Inc
- 16.2.8.1. Overview
- 16.2.8.2. Products
- 16.2.8.3. SWOT Analysis
- 16.2.8.4. Recent Developments
- 16.2.8.5. Financials (Based on Availability)
- 16.2.9 Hengtong Group Co Ltd
- 16.2.9.1. Overview
- 16.2.9.2. Products
- 16.2.9.3. SWOT Analysis
- 16.2.9.4. Recent Developments
- 16.2.9.5. Financials (Based on Availability)
- 16.2.10 Sumitomo Electric Industries Ltd
- 16.2.10.1. Overview
- 16.2.10.2. Products
- 16.2.10.3. SWOT Analysis
- 16.2.10.4. Recent Developments
- 16.2.10.5. Financials (Based on Availability)
- 16.2.1 Belden Inc
List of Figures
- Figure 1: Global Telecom Cable Industry Revenue Breakdown (Million, %) by Region 2024 & 2032
- Figure 2: North America Telecom Cable Industry Revenue (Million), by Country 2024 & 2032
- Figure 3: North America Telecom Cable Industry Revenue Share (%), by Country 2024 & 2032
- Figure 4: Europe Telecom Cable Industry Revenue (Million), by Country 2024 & 2032
- Figure 5: Europe Telecom Cable Industry Revenue Share (%), by Country 2024 & 2032
- Figure 6: Asia Pacific Telecom Cable Industry Revenue (Million), by Country 2024 & 2032
- Figure 7: Asia Pacific Telecom Cable Industry Revenue Share (%), by Country 2024 & 2032
- Figure 8: South America Telecom Cable Industry Revenue (Million), by Country 2024 & 2032
- Figure 9: South America Telecom Cable Industry Revenue Share (%), by Country 2024 & 2032
- Figure 10: North America Telecom Cable Industry Revenue (Million), by Country 2024 & 2032
- Figure 11: North America Telecom Cable Industry Revenue Share (%), by Country 2024 & 2032
- Figure 12: MEA Telecom Cable Industry Revenue (Million), by Country 2024 & 2032
- Figure 13: MEA Telecom Cable Industry Revenue Share (%), by Country 2024 & 2032
- Figure 14: North America Telecom Cable Industry Revenue (Million), by Type 2024 & 2032
- Figure 15: North America Telecom Cable Industry Revenue Share (%), by Type 2024 & 2032
- Figure 16: North America Telecom Cable Industry Revenue (Million), by Application 2024 & 2032
- Figure 17: North America Telecom Cable Industry Revenue Share (%), by Application 2024 & 2032
- Figure 18: North America Telecom Cable Industry Revenue (Million), by Country 2024 & 2032
- Figure 19: North America Telecom Cable Industry Revenue Share (%), by Country 2024 & 2032
- Figure 20: Europe Telecom Cable Industry Revenue (Million), by Type 2024 & 2032
- Figure 21: Europe Telecom Cable Industry Revenue Share (%), by Type 2024 & 2032
- Figure 22: Europe Telecom Cable Industry Revenue (Million), by Application 2024 & 2032
- Figure 23: Europe Telecom Cable Industry Revenue Share (%), by Application 2024 & 2032
- Figure 24: Europe Telecom Cable Industry Revenue (Million), by Country 2024 & 2032
- Figure 25: Europe Telecom Cable Industry Revenue Share (%), by Country 2024 & 2032
- Figure 26: Asia Pacific Telecom Cable Industry Revenue (Million), by Type 2024 & 2032
- Figure 27: Asia Pacific Telecom Cable Industry Revenue Share (%), by Type 2024 & 2032
- Figure 28: Asia Pacific Telecom Cable Industry Revenue (Million), by Application 2024 & 2032
- Figure 29: Asia Pacific Telecom Cable Industry Revenue Share (%), by Application 2024 & 2032
- Figure 30: Asia Pacific Telecom Cable Industry Revenue (Million), by Country 2024 & 2032
- Figure 31: Asia Pacific Telecom Cable Industry Revenue Share (%), by Country 2024 & 2032
- Figure 32: Rest of the World Telecom Cable Industry Revenue (Million), by Type 2024 & 2032
- Figure 33: Rest of the World Telecom Cable Industry Revenue Share (%), by Type 2024 & 2032
- Figure 34: Rest of the World Telecom Cable Industry Revenue (Million), by Application 2024 & 2032
- Figure 35: Rest of the World Telecom Cable Industry Revenue Share (%), by Application 2024 & 2032
- Figure 36: Rest of the World Telecom Cable Industry Revenue (Million), by Country 2024 & 2032
- Figure 37: Rest of the World Telecom Cable Industry Revenue Share (%), by Country 2024 & 2032
List of Tables
- Table 1: Global Telecom Cable Industry Revenue Million Forecast, by Region 2019 & 2032
- Table 2: Global Telecom Cable Industry Revenue Million Forecast, by Type 2019 & 2032
- Table 3: Global Telecom Cable Industry Revenue Million Forecast, by Application 2019 & 2032
- Table 4: Global Telecom Cable Industry Revenue Million Forecast, by Region 2019 & 2032
- Table 5: Global Telecom Cable Industry Revenue Million Forecast, by Country 2019 & 2032
- Table 6: United States Telecom Cable Industry Revenue (Million) Forecast, by Application 2019 & 2032
- Table 7: Canada Telecom Cable Industry Revenue (Million) Forecast, by Application 2019 & 2032
- Table 8: Mexico Telecom Cable Industry Revenue (Million) Forecast, by Application 2019 & 2032
- Table 9: Global Telecom Cable Industry Revenue Million Forecast, by Country 2019 & 2032
- Table 10: Germany Telecom Cable Industry Revenue (Million) Forecast, by Application 2019 & 2032
- Table 11: United Kingdom Telecom Cable Industry Revenue (Million) Forecast, by Application 2019 & 2032
- Table 12: France Telecom Cable Industry Revenue (Million) Forecast, by Application 2019 & 2032
- Table 13: Spain Telecom Cable Industry Revenue (Million) Forecast, by Application 2019 & 2032
- Table 14: Italy Telecom Cable Industry Revenue (Million) Forecast, by Application 2019 & 2032
- Table 15: Spain Telecom Cable Industry Revenue (Million) Forecast, by Application 2019 & 2032
- Table 16: Belgium Telecom Cable Industry Revenue (Million) Forecast, by Application 2019 & 2032
- Table 17: Netherland Telecom Cable Industry Revenue (Million) Forecast, by Application 2019 & 2032
- Table 18: Nordics Telecom Cable Industry Revenue (Million) Forecast, by Application 2019 & 2032
- Table 19: Rest of Europe Telecom Cable Industry Revenue (Million) Forecast, by Application 2019 & 2032
- Table 20: Global Telecom Cable Industry Revenue Million Forecast, by Country 2019 & 2032
- Table 21: China Telecom Cable Industry Revenue (Million) Forecast, by Application 2019 & 2032
- Table 22: Japan Telecom Cable Industry Revenue (Million) Forecast, by Application 2019 & 2032
- Table 23: India Telecom Cable Industry Revenue (Million) Forecast, by Application 2019 & 2032
- Table 24: South Korea Telecom Cable Industry Revenue (Million) Forecast, by Application 2019 & 2032
- Table 25: Southeast Asia Telecom Cable Industry Revenue (Million) Forecast, by Application 2019 & 2032
- Table 26: Australia Telecom Cable Industry Revenue (Million) Forecast, by Application 2019 & 2032
- Table 27: Indonesia Telecom Cable Industry Revenue (Million) Forecast, by Application 2019 & 2032
- Table 28: Phillipes Telecom Cable Industry Revenue (Million) Forecast, by Application 2019 & 2032
- Table 29: Singapore Telecom Cable Industry Revenue (Million) Forecast, by Application 2019 & 2032
- Table 30: Thailandc Telecom Cable Industry Revenue (Million) Forecast, by Application 2019 & 2032
- Table 31: Rest of Asia Pacific Telecom Cable Industry Revenue (Million) Forecast, by Application 2019 & 2032
- Table 32: Global Telecom Cable Industry Revenue Million Forecast, by Country 2019 & 2032
- Table 33: Brazil Telecom Cable Industry Revenue (Million) Forecast, by Application 2019 & 2032
- Table 34: Argentina Telecom Cable Industry Revenue (Million) Forecast, by Application 2019 & 2032
- Table 35: Peru Telecom Cable Industry Revenue (Million) Forecast, by Application 2019 & 2032
- Table 36: Chile Telecom Cable Industry Revenue (Million) Forecast, by Application 2019 & 2032
- Table 37: Colombia Telecom Cable Industry Revenue (Million) Forecast, by Application 2019 & 2032
- Table 38: Ecuador Telecom Cable Industry Revenue (Million) Forecast, by Application 2019 & 2032
- Table 39: Venezuela Telecom Cable Industry Revenue (Million) Forecast, by Application 2019 & 2032
- Table 40: Rest of South America Telecom Cable Industry Revenue (Million) Forecast, by Application 2019 & 2032
- Table 41: Global Telecom Cable Industry Revenue Million Forecast, by Country 2019 & 2032
- Table 42: United States Telecom Cable Industry Revenue (Million) Forecast, by Application 2019 & 2032
- Table 43: Canada Telecom Cable Industry Revenue (Million) Forecast, by Application 2019 & 2032
- Table 44: Mexico Telecom Cable Industry Revenue (Million) Forecast, by Application 2019 & 2032
- Table 45: Global Telecom Cable Industry Revenue Million Forecast, by Country 2019 & 2032
- Table 46: United Arab Emirates Telecom Cable Industry Revenue (Million) Forecast, by Application 2019 & 2032
- Table 47: Saudi Arabia Telecom Cable Industry Revenue (Million) Forecast, by Application 2019 & 2032
- Table 48: South Africa Telecom Cable Industry Revenue (Million) Forecast, by Application 2019 & 2032
- Table 49: Rest of Middle East and Africa Telecom Cable Industry Revenue (Million) Forecast, by Application 2019 & 2032
- Table 50: Global Telecom Cable Industry Revenue Million Forecast, by Type 2019 & 2032
- Table 51: Global Telecom Cable Industry Revenue Million Forecast, by Application 2019 & 2032
- Table 52: Global Telecom Cable Industry Revenue Million Forecast, by Country 2019 & 2032
- Table 53: United States Telecom Cable Industry Revenue (Million) Forecast, by Application 2019 & 2032
- Table 54: Canada Telecom Cable Industry Revenue (Million) Forecast, by Application 2019 & 2032
- Table 55: Mexico Telecom Cable Industry Revenue (Million) Forecast, by Application 2019 & 2032
- Table 56: Global Telecom Cable Industry Revenue Million Forecast, by Type 2019 & 2032
- Table 57: Global Telecom Cable Industry Revenue Million Forecast, by Application 2019 & 2032
- Table 58: Global Telecom Cable Industry Revenue Million Forecast, by Country 2019 & 2032
- Table 59: Germany Telecom Cable Industry Revenue (Million) Forecast, by Application 2019 & 2032
- Table 60: France Telecom Cable Industry Revenue (Million) Forecast, by Application 2019 & 2032
- Table 61: Uk Telecom Cable Industry Revenue (Million) Forecast, by Application 2019 & 2032
- Table 62: Rest of Europe Telecom Cable Industry Revenue (Million) Forecast, by Application 2019 & 2032
- Table 63: Global Telecom Cable Industry Revenue Million Forecast, by Type 2019 & 2032
- Table 64: Global Telecom Cable Industry Revenue Million Forecast, by Application 2019 & 2032
- Table 65: Global Telecom Cable Industry Revenue Million Forecast, by Country 2019 & 2032
- Table 66: Japan Telecom Cable Industry Revenue (Million) Forecast, by Application 2019 & 2032
- Table 67: China Telecom Cable Industry Revenue (Million) Forecast, by Application 2019 & 2032
- Table 68: India Telecom Cable Industry Revenue (Million) Forecast, by Application 2019 & 2032
- Table 69: Rest of Asia Pacific Telecom Cable Industry Revenue (Million) Forecast, by Application 2019 & 2032
- Table 70: Global Telecom Cable Industry Revenue Million Forecast, by Type 2019 & 2032
- Table 71: Global Telecom Cable Industry Revenue Million Forecast, by Application 2019 & 2032
- Table 72: Global Telecom Cable Industry Revenue Million Forecast, by Country 2019 & 2032
Frequently Asked Questions
1. What is the projected Compound Annual Growth Rate (CAGR) of the Telecom Cable Industry?
The projected CAGR is approximately 7.30%.
2. Which companies are prominent players in the Telecom Cable Industry?
Key companies in the market include Belden Inc, LS Cable & System, Furukawa Electric Co Ltd, Prysmian Group, Hitachi Cable America Inc, Fujikura Ltd, Leoni AG, Commscope Inc, Hengtong Group Co Ltd, Sumitomo Electric Industries Ltd.
3. What are the main segments of the Telecom Cable Industry?
The market segments include Type, Application.
4. Can you provide details about the market size?
The market size is estimated to be USD XX Million as of 2022.
5. What are some drivers contributing to market growth?
Rise in the use of Internet and increasing acceptance of smartphones; Increased demand for Internet of Things (IoT).
6. What are the notable trends driving market growth?
Rising Internet Penetration and Adoption of Smartphones.
7. Are there any restraints impacting market growth?
High cost of operation and maintenance of Telecom Cable.
8. Can you provide examples of recent developments in the market?
April 2021 - Hitachi Cable America completed the roll-out of CableSuite as an innovative IT platform called CableERP. It is the complete ERP solution for wire and cable manufacturers, based on the advanced Microsoft Dynamics D365. It comes with all features that are needed for this specific industry.
9. What pricing options are available for accessing the report?
Pricing options include single-user, multi-user, and enterprise licenses priced at USD 4750, USD 5250, and USD 8750 respectively.
10. Is the market size provided in terms of value or volume?
The market size is provided in terms of value, measured in Million.
11. Are there any specific market keywords associated with the report?
Yes, the market keyword associated with the report is "Telecom Cable Industry," which aids in identifying and referencing the specific market segment covered.
12. How do I determine which pricing option suits my needs best?
The pricing options vary based on user requirements and access needs. Individual users may opt for single-user licenses, while businesses requiring broader access may choose multi-user or enterprise licenses for cost-effective access to the report.
13. Are there any additional resources or data provided in the Telecom Cable Industry report?
While the report offers comprehensive insights, it's advisable to review the specific contents or supplementary materials provided to ascertain if additional resources or data are available.
14. How can I stay updated on further developments or reports in the Telecom Cable Industry?
To stay informed about further developments, trends, and reports in the Telecom Cable Industry, consider subscribing to industry newsletters, following relevant companies and organizations, or regularly checking reputable industry news sources and publications.
Methodology
Step 1 - Identification of Relevant Samples Size from Population Database


Step 2 - Approaches for Defining Global Market Size (Value, Volume* & Price*)

Note*: In applicable scenarios
Step 3 - Data Sources
Primary Research
- Web Analytics
- Survey Reports
- Research Institute
- Latest Research Reports
- Opinion Leaders
Secondary Research
- Annual Reports
- White Paper
- Latest Press Release
- Industry Association
- Paid Database
- Investor Presentations

Step 4 - Data Triangulation
Involves using different sources of information in order to increase the validity of a study
These sources are likely to be stakeholders in a program - participants, other researchers, program staff, other community members, and so on.
Then we put all data in single framework & apply various statistical tools to find out the dynamic on the market.
During the analysis stage, feedback from the stakeholder groups would be compared to determine areas of agreement as well as areas of divergence
