

Key Insights
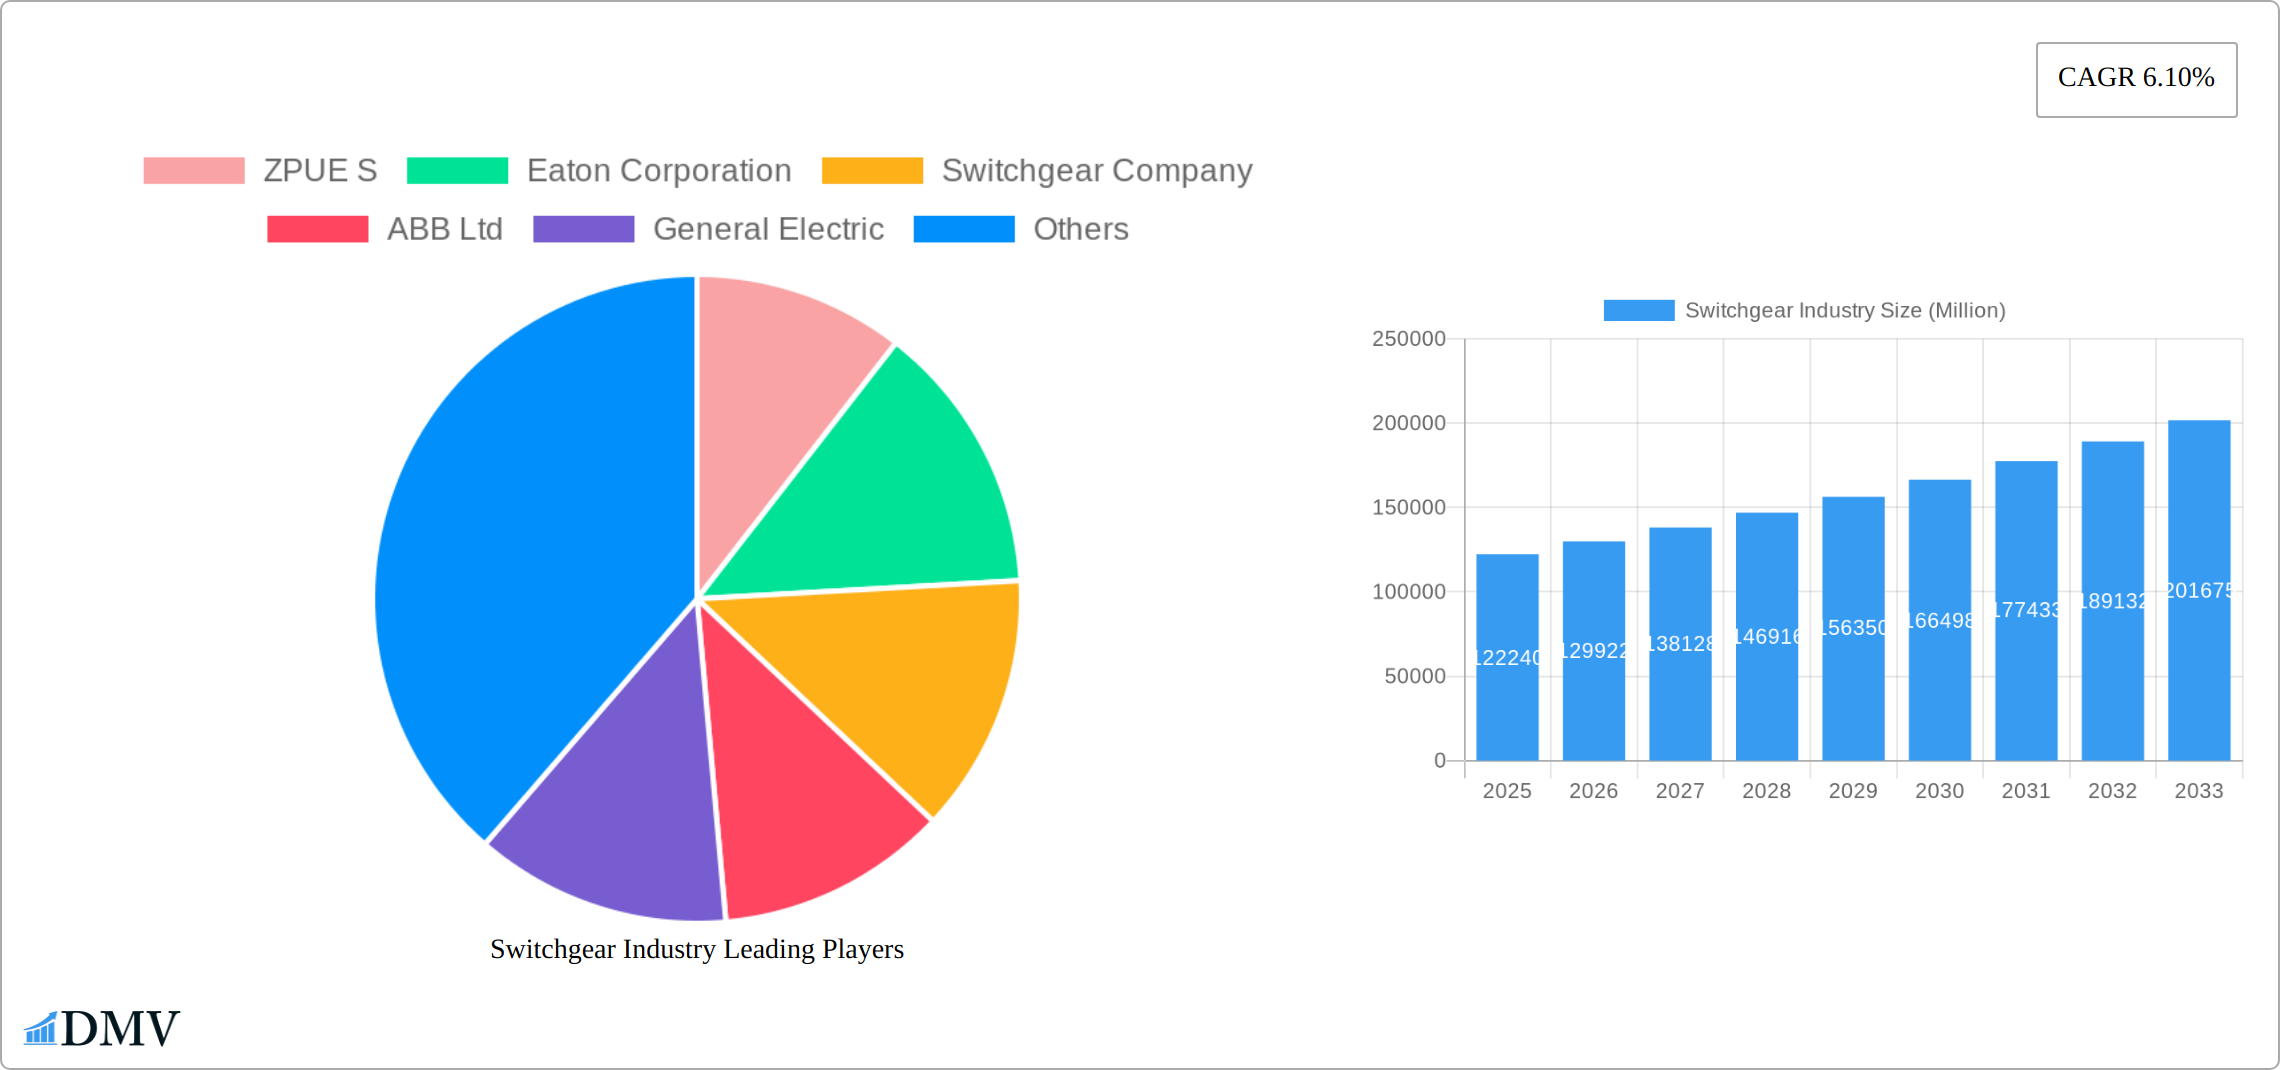
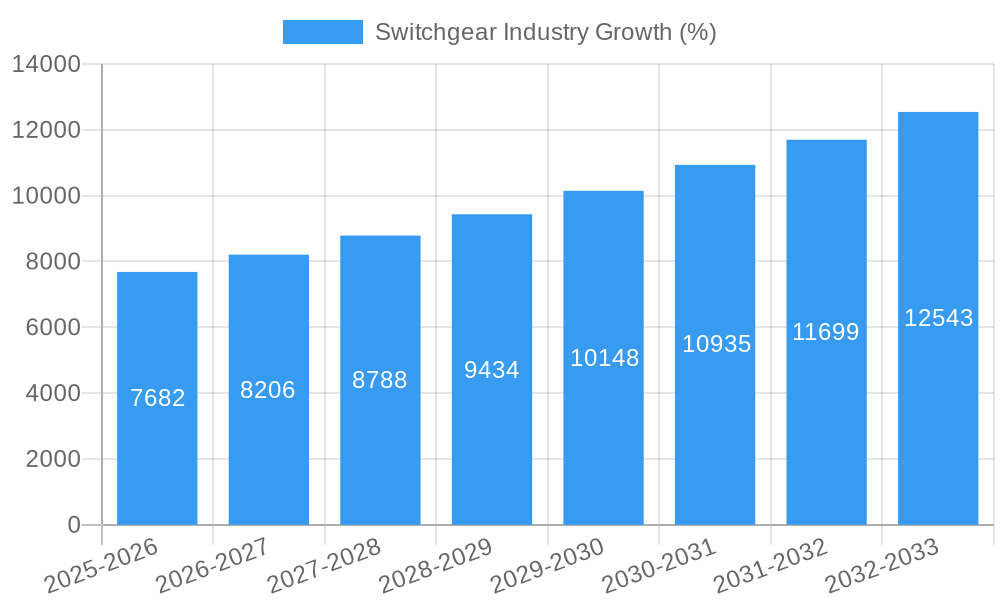
The global switchgear market, valued at $122.24 billion in 2025, is projected to experience robust growth, driven by the increasing demand for reliable power distribution across residential, commercial, and industrial sectors. A Compound Annual Growth Rate (CAGR) of 6.10% from 2025 to 2033 indicates a significant expansion, primarily fueled by the rising adoption of smart grids and renewable energy sources. The integration of advanced technologies like IoT sensors and digital monitoring systems within switchgear enhances operational efficiency and grid stability, further stimulating market growth. Furthermore, stringent government regulations promoting energy conservation and grid modernization initiatives in developed and developing economies are creating favorable market conditions. The high-voltage segment within the switchgear market is anticipated to dominate due to its critical role in large-scale power transmission and distribution.
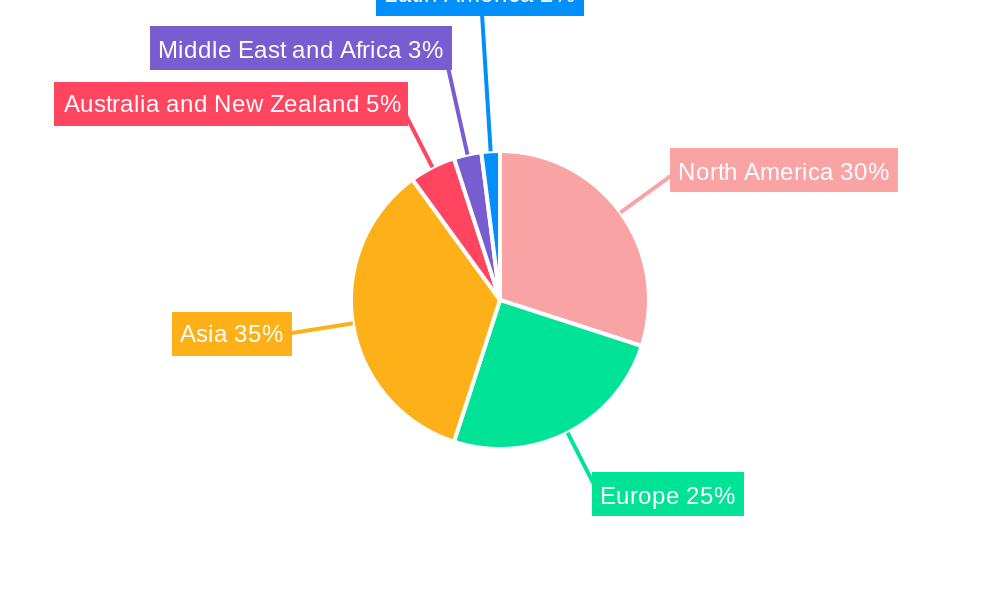
Significant regional variations are expected. North America and Europe, with their established infrastructure and technological advancements, will continue to hold substantial market share. However, the Asia-Pacific region is poised for rapid growth owing to ongoing industrialization, urbanization, and increasing investments in power infrastructure projects. While the residential sector represents a significant user base, the industrial sector's demand for high-capacity and sophisticated switchgear is expected to drive segment growth. Competition among major players such as ABB, Siemens, Eaton, and Schneider Electric, along with regional players like ZPUE and Crompton Greaves, will intensify as they focus on product innovation, strategic partnerships, and expansion into emerging markets. The market's growth trajectory is also influenced by factors such as raw material prices, supply chain disruptions, and global economic conditions.
Switchgear Industry Market Composition & Trends
The Switchgear Industry is witnessing a dynamic transformation, shaped by various factors including market concentration, innovation catalysts, regulatory landscapes, substitute products, end-user profiles, and merger and acquisition (M&A) activities. Market concentration within the switchgear sector is relatively high, with leading players such as Eaton Corporation, ABB Ltd, and Siemens AG commanding significant shares. These companies have been actively involved in R&D, resulting in innovative solutions that cater to evolving market demands. Regulatory landscapes, particularly in regions like Europe and North America, are pushing for more eco-friendly and efficient switchgear solutions, influencing product development and market strategies.
- Market Share Distribution: The top five companies hold approximately 50% of the global market, with Eaton Corporation and ABB Ltd each possessing around 12% market share.
- Innovation Catalysts: Increased investment in smart grid technologies and IoT integration in switchgear systems are major drivers.
- Regulatory Landscapes: Stricter environmental regulations are compelling companies to develop green switchgear solutions, reducing the use of SF6 gas.
- Substitute Products: Alternatives like vacuum and air-insulated switchgear are gaining traction due to their environmental benefits.
- End-User Profiles: The industrial sector remains the largest end-user, driven by the need for reliable power distribution systems.
- M&A Activities: Recent M&A deals, valued at around $2.5 Billion, indicate a trend towards consolidation to enhance technological capabilities and market reach.
Switchgear Industry Industry Evolution
The Switchgear Industry has undergone significant evolution over the past few decades, driven by technological advancements, market growth trajectories, and shifting consumer demands. From 2019 to 2024, the global switchgear market experienced a compound annual growth rate (CAGR) of approximately 6%, fueled by the increasing demand for electricity and the expansion of power infrastructure, particularly in emerging economies. The advent of smart grid technologies and the integration of renewable energy sources have further propelled the need for advanced switchgear solutions.
Technological advancements, such as the development of digital switchgear with real-time monitoring capabilities, have revolutionized the industry. The adoption of IoT and AI in switchgear systems has enabled predictive maintenance and enhanced operational efficiency, with adoption rates increasing by 8% annually. Additionally, the shift towards eco-friendly solutions, such as gas-insulated switchgear (GIS) and vacuum circuit breakers, reflects changing consumer preferences and regulatory pressures to reduce carbon footprints.
The industrial sector continues to dominate the market, driven by the need for reliable power distribution in manufacturing and processing facilities. However, the commercial and residential sectors are also witnessing significant growth, spurred by the increasing adoption of electric vehicles and the demand for energy-efficient buildings. Looking ahead, the industry is poised for further growth, with a projected CAGR of 7% from 2025 to 2033, driven by ongoing technological innovations and the global push towards sustainable energy solutions.
Leading Regions, Countries, or Segments in Switchgear Industry
The Asia-Pacific region emerges as the dominant force in the Switchgear Industry, driven by rapid industrialization, urbanization, and significant investments in power infrastructure. Countries like China and India are at the forefront, with China holding the largest market share due to its extensive manufacturing base and government initiatives aimed at modernizing its power grid.
- Key Drivers in Asia-Pacific:
- Investment Trends: Governments are investing heavily in smart grid projects and renewable energy integration.
- Regulatory Support: Policies promoting energy efficiency and sustainability are accelerating the adoption of advanced switchgear solutions.
- Technological Advancements: The region is a hub for R&D in switchgear technology, fostering innovation and market growth.
In terms of segments, the industrial sector remains the leader, accounting for over 40% of the market. This dominance is attributed to the critical role switchgear plays in ensuring reliable power distribution in industrial settings. However, the commercial segment is experiencing rapid growth, driven by the increasing demand for energy-efficient buildings and the rise of data centers.
- Dominance Factors in Industrial Segment:
- High Demand for Reliability: Industrial operations require robust and reliable power distribution systems, making advanced switchgear essential.
- Growth in Manufacturing: The expansion of manufacturing facilities, particularly in Asia, is boosting demand for high-voltage switchgear.
- Technological Integration: The integration of IoT and AI in industrial switchgear systems enhances operational efficiency and reduces downtime.
The high-voltage segment, particularly high-voltage insulation, is also a key area of focus. The need for efficient power transmission over long distances and the integration of renewable energy sources are driving the demand for advanced insulation technologies.
- Dominance Factors in High-Voltage Insulation:
- Long-Distance Transmission: High-voltage lines require robust insulation to minimize losses and ensure efficient power delivery.
- Renewable Energy Integration: The integration of wind and solar power into the grid necessitates high-voltage switchgear with advanced insulation capabilities.
- Technological Advancements: Innovations in insulation materials and designs are enhancing the performance and reliability of high-voltage switchgear.
Switchgear Industry Product Innovations
Recent product innovations in the Switchgear Industry have focused on enhancing efficiency, reliability, and sustainability. Schneider Electric's SureSeT Medium Voltage (MV) switchgear, launched in February 2024, exemplifies these trends. This innovative solution features the EvoPacT circuit breaker and offers advanced digital operations, including real-time monitoring of thermal, environmental, and circuit breaker health. Its compact design and remote control capabilities minimize downtime and enable faster problem detection and repair. Similarly, Siemens' introduction of eco-friendly medium-voltage switchgear in October 2023, such as the 8DAB 24 and NXPLUS C 24, underscores the industry's commitment to sustainability, with a focus on reducing carbon footprints through the use of F-gas-free technologies.
Propelling Factors for Switchgear Industry Growth
The growth of the Switchgear Industry is propelled by several key factors. Technological advancements, such as the integration of IoT and AI, are enhancing operational efficiency and enabling predictive maintenance. The global push towards renewable energy and smart grid technologies is driving demand for advanced switchgear solutions. Economic factors, including industrialization and urbanization in emerging markets, are also significant drivers. Regulatory influences, particularly environmental regulations promoting eco-friendly solutions, are compelling companies to innovate and adapt.
Obstacles in the Switchgear Industry Market
The Switchgear Industry faces several obstacles that could impede growth. Regulatory challenges, such as stringent environmental regulations, require companies to invest in R&D for eco-friendly solutions, increasing costs. Supply chain disruptions, exacerbated by global events like pandemics and geopolitical tensions, can delay production and delivery. Competitive pressures are intense, with numerous players vying for market share, leading to price wars and reduced profit margins. These factors collectively impact the industry's ability to grow and innovate.
Future Opportunities in Switchgear Industry
The Switchgear Industry presents several future opportunities. The expansion of smart grid technologies and the integration of renewable energy sources offer new markets for advanced switchgear solutions. The growing demand for energy-efficient buildings and data centers in the commercial sector is another area of potential growth. Additionally, emerging technologies such as blockchain and edge computing could further enhance the capabilities of switchgear systems, opening up new avenues for innovation and market expansion.
Major Players in the Switchgear Industry Ecosystem
- ZPUE S
- Eaton Corporation
- Switchgear Company
- ABB Ltd
- General Electric
- Orecco Electric
- Fuji Electric Co Ltd
- Crompton Greaves Power and Industrial Solutions Limited
- Toshiba International Corporation
- Hubbell Incorporated
- Hitachi Ltd
- Mitsubishi Electric Corporation
- Siemens AG
- Schneider Electric SE
- Powell Industries Inc
- Meidensha Corporation
- Havells India Limited
Key Developments in Switchgear Industry Industry
- February 2024: Schneider Electric introduced the SureSeT Medium Voltage (MV) switchgear for the Canadian market. This innovative solution, featuring the EvoPacT circuit breaker, aims to provide an efficient and advanced option for primary switchgear applications. SureSeT's ability to handle digital operations effectively, monitor thermal, environmental, and circuit breaker health, and minimize downtime through remote control and digital services utilizing real-time data significantly impacts the market dynamics by offering enhanced reliability and efficiency.
- October 2023: Siemens Smart Infrastructure expanded its eco-friendly and digital medium-voltage switchgear offerings to aid in decarbonizing power grids. The introduction of the 8DAB 24 and enhancements to the NXPLUS C 24, focusing on high-end ratings up to 24 kV and 2500 A, using the Robust Eco Design principle, marks a significant step towards sustainable grids. The 8DAB 24's decreased carbon footprint throughout its lifecycle positions it as an ideal choice for supporting the shift towards renewable energy, influencing market trends towards sustainability.
Strategic Switchgear Industry Market Forecast
The Switchgear Industry is poised for robust growth, with a projected CAGR of 7% from 2025 to 2033. Key growth catalysts include the increasing demand for smart grid technologies, the integration of renewable energy sources, and the global push towards energy efficiency and sustainability. The expansion of industrial and commercial sectors in emerging markets, coupled with ongoing technological innovations, presents significant opportunities for market expansion. As companies continue to invest in R&D and adapt to regulatory changes, the industry is well-positioned to capitalize on these trends and drive future growth.
Switchgear Industry Segmentation
-
1. Type
-
1.1. Voltage
- 1.1.1. Low-voltage
- 1.1.2. Medium-voltage
- 1.1.3. High-voltage
-
1.2. Insulation
- 1.2.1. Gas -insulated Switchgear (GIS)
- 1.2.2. Air-insulated Switchgear (AIS)
- 1.2.3. Other Insulation Types
-
1.3. Installation
- 1.3.1. Indoor
- 1.3.2. Outdoor
-
1.1. Voltage
-
2. End-user Industry
- 2.1. Commercial
- 2.2. Residential
- 2.3. Industrial
Switchgear Industry Segmentation By Geography
- 1. North America
- 2. Europe
- 3. Asia
- 4. Australia and New Zealand
- 5. Middle East and Africa
- 6. Latin America
Switchgear Industry REPORT HIGHLIGHTS
| Aspects | Details |
|---|---|
| Study Period | 2019-2033 |
| Base Year | 2024 |
| Estimated Year | 2025 |
| Forecast Period | 2025-2033 |
| Historical Period | 2019-2024 |
| Growth Rate | CAGR of 6.10% from 2019-2033 |
| Segmentation |
|
Table of Contents
- 1. Introduction
- 1.1. Research Scope
- 1.2. Market Segmentation
- 1.3. Research Methodology
- 1.4. Definitions and Assumptions
- 2. Executive Summary
- 2.1. Introduction
- 3. Market Dynamics
- 3.1. Introduction
- 3.2. Market Drivers
- 3.2.1. Growth of Smart Electricity Grid Infrastructure; Growing Focus on Infrastructure and Renewable Energy Sources; Increased Investment in Industrial Production
- 3.3. Market Restrains
- 3.3.1. Stringent Environmental and Safety Regulations; Increasing Competition from the Unorganized Sectors
- 3.4. Market Trends
- 3.4.1. The Residential Segment to Witness a Significant Growth
- 4. Market Factor Analysis
- 4.1. Porters Five Forces
- 4.2. Supply/Value Chain
- 4.3. PESTEL analysis
- 4.4. Market Entropy
- 4.5. Patent/Trademark Analysis
- 5. Global Switchgear Industry Analysis, Insights and Forecast, 2019-2031
- 5.1. Market Analysis, Insights and Forecast - by Type
- 5.1.1. Voltage
- 5.1.1.1. Low-voltage
- 5.1.1.2. Medium-voltage
- 5.1.1.3. High-voltage
- 5.1.2. Insulation
- 5.1.2.1. Gas -insulated Switchgear (GIS)
- 5.1.2.2. Air-insulated Switchgear (AIS)
- 5.1.2.3. Other Insulation Types
- 5.1.3. Installation
- 5.1.3.1. Indoor
- 5.1.3.2. Outdoor
- 5.1.1. Voltage
- 5.2. Market Analysis, Insights and Forecast - by End-user Industry
- 5.2.1. Commercial
- 5.2.2. Residential
- 5.2.3. Industrial
- 5.3. Market Analysis, Insights and Forecast - by Region
- 5.3.1. North America
- 5.3.2. Europe
- 5.3.3. Asia
- 5.3.4. Australia and New Zealand
- 5.3.5. Middle East and Africa
- 5.3.6. Latin America
- 5.1. Market Analysis, Insights and Forecast - by Type
- 6. North America Switchgear Industry Analysis, Insights and Forecast, 2019-2031
- 6.1. Market Analysis, Insights and Forecast - by Type
- 6.1.1. Voltage
- 6.1.1.1. Low-voltage
- 6.1.1.2. Medium-voltage
- 6.1.1.3. High-voltage
- 6.1.2. Insulation
- 6.1.2.1. Gas -insulated Switchgear (GIS)
- 6.1.2.2. Air-insulated Switchgear (AIS)
- 6.1.2.3. Other Insulation Types
- 6.1.3. Installation
- 6.1.3.1. Indoor
- 6.1.3.2. Outdoor
- 6.1.1. Voltage
- 6.2. Market Analysis, Insights and Forecast - by End-user Industry
- 6.2.1. Commercial
- 6.2.2. Residential
- 6.2.3. Industrial
- 6.1. Market Analysis, Insights and Forecast - by Type
- 7. Europe Switchgear Industry Analysis, Insights and Forecast, 2019-2031
- 7.1. Market Analysis, Insights and Forecast - by Type
- 7.1.1. Voltage
- 7.1.1.1. Low-voltage
- 7.1.1.2. Medium-voltage
- 7.1.1.3. High-voltage
- 7.1.2. Insulation
- 7.1.2.1. Gas -insulated Switchgear (GIS)
- 7.1.2.2. Air-insulated Switchgear (AIS)
- 7.1.2.3. Other Insulation Types
- 7.1.3. Installation
- 7.1.3.1. Indoor
- 7.1.3.2. Outdoor
- 7.1.1. Voltage
- 7.2. Market Analysis, Insights and Forecast - by End-user Industry
- 7.2.1. Commercial
- 7.2.2. Residential
- 7.2.3. Industrial
- 7.1. Market Analysis, Insights and Forecast - by Type
- 8. Asia Switchgear Industry Analysis, Insights and Forecast, 2019-2031
- 8.1. Market Analysis, Insights and Forecast - by Type
- 8.1.1. Voltage
- 8.1.1.1. Low-voltage
- 8.1.1.2. Medium-voltage
- 8.1.1.3. High-voltage
- 8.1.2. Insulation
- 8.1.2.1. Gas -insulated Switchgear (GIS)
- 8.1.2.2. Air-insulated Switchgear (AIS)
- 8.1.2.3. Other Insulation Types
- 8.1.3. Installation
- 8.1.3.1. Indoor
- 8.1.3.2. Outdoor
- 8.1.1. Voltage
- 8.2. Market Analysis, Insights and Forecast - by End-user Industry
- 8.2.1. Commercial
- 8.2.2. Residential
- 8.2.3. Industrial
- 8.1. Market Analysis, Insights and Forecast - by Type
- 9. Australia and New Zealand Switchgear Industry Analysis, Insights and Forecast, 2019-2031
- 9.1. Market Analysis, Insights and Forecast - by Type
- 9.1.1. Voltage
- 9.1.1.1. Low-voltage
- 9.1.1.2. Medium-voltage
- 9.1.1.3. High-voltage
- 9.1.2. Insulation
- 9.1.2.1. Gas -insulated Switchgear (GIS)
- 9.1.2.2. Air-insulated Switchgear (AIS)
- 9.1.2.3. Other Insulation Types
- 9.1.3. Installation
- 9.1.3.1. Indoor
- 9.1.3.2. Outdoor
- 9.1.1. Voltage
- 9.2. Market Analysis, Insights and Forecast - by End-user Industry
- 9.2.1. Commercial
- 9.2.2. Residential
- 9.2.3. Industrial
- 9.1. Market Analysis, Insights and Forecast - by Type
- 10. Middle East and Africa Switchgear Industry Analysis, Insights and Forecast, 2019-2031
- 10.1. Market Analysis, Insights and Forecast - by Type
- 10.1.1. Voltage
- 10.1.1.1. Low-voltage
- 10.1.1.2. Medium-voltage
- 10.1.1.3. High-voltage
- 10.1.2. Insulation
- 10.1.2.1. Gas -insulated Switchgear (GIS)
- 10.1.2.2. Air-insulated Switchgear (AIS)
- 10.1.2.3. Other Insulation Types
- 10.1.3. Installation
- 10.1.3.1. Indoor
- 10.1.3.2. Outdoor
- 10.1.1. Voltage
- 10.2. Market Analysis, Insights and Forecast - by End-user Industry
- 10.2.1. Commercial
- 10.2.2. Residential
- 10.2.3. Industrial
- 10.1. Market Analysis, Insights and Forecast - by Type
- 11. Latin America Switchgear Industry Analysis, Insights and Forecast, 2019-2031
- 11.1. Market Analysis, Insights and Forecast - by Type
- 11.1.1. Voltage
- 11.1.1.1. Low-voltage
- 11.1.1.2. Medium-voltage
- 11.1.1.3. High-voltage
- 11.1.2. Insulation
- 11.1.2.1. Gas -insulated Switchgear (GIS)
- 11.1.2.2. Air-insulated Switchgear (AIS)
- 11.1.2.3. Other Insulation Types
- 11.1.3. Installation
- 11.1.3.1. Indoor
- 11.1.3.2. Outdoor
- 11.1.1. Voltage
- 11.2. Market Analysis, Insights and Forecast - by End-user Industry
- 11.2.1. Commercial
- 11.2.2. Residential
- 11.2.3. Industrial
- 11.1. Market Analysis, Insights and Forecast - by Type
- 12. North America Switchgear Industry Analysis, Insights and Forecast, 2019-2031
- 12.1. Market Analysis, Insights and Forecast - By Country/Sub-region
- 12.1.1.
- 13. Europe Switchgear Industry Analysis, Insights and Forecast, 2019-2031
- 13.1. Market Analysis, Insights and Forecast - By Country/Sub-region
- 13.1.1.
- 14. Asia Switchgear Industry Analysis, Insights and Forecast, 2019-2031
- 14.1. Market Analysis, Insights and Forecast - By Country/Sub-region
- 14.1.1.
- 15. Australia and New Zealand Switchgear Industry Analysis, Insights and Forecast, 2019-2031
- 15.1. Market Analysis, Insights and Forecast - By Country/Sub-region
- 15.1.1.
- 16. Middle East and Africa Switchgear Industry Analysis, Insights and Forecast, 2019-2031
- 16.1. Market Analysis, Insights and Forecast - By Country/Sub-region
- 16.1.1.
- 17. Latin America Switchgear Industry Analysis, Insights and Forecast, 2019-2031
- 17.1. Market Analysis, Insights and Forecast - By Country/Sub-region
- 17.1.1.
- 18. Competitive Analysis
- 18.1. Global Market Share Analysis 2024
- 18.2. Company Profiles
- 18.2.1 ZPUE S
- 18.2.1.1. Overview
- 18.2.1.2. Products
- 18.2.1.3. SWOT Analysis
- 18.2.1.4. Recent Developments
- 18.2.1.5. Financials (Based on Availability)
- 18.2.2 Eaton Corporation
- 18.2.2.1. Overview
- 18.2.2.2. Products
- 18.2.2.3. SWOT Analysis
- 18.2.2.4. Recent Developments
- 18.2.2.5. Financials (Based on Availability)
- 18.2.3 Switchgear Company
- 18.2.3.1. Overview
- 18.2.3.2. Products
- 18.2.3.3. SWOT Analysis
- 18.2.3.4. Recent Developments
- 18.2.3.5. Financials (Based on Availability)
- 18.2.4 ABB Ltd
- 18.2.4.1. Overview
- 18.2.4.2. Products
- 18.2.4.3. SWOT Analysis
- 18.2.4.4. Recent Developments
- 18.2.4.5. Financials (Based on Availability)
- 18.2.5 General Electric
- 18.2.5.1. Overview
- 18.2.5.2. Products
- 18.2.5.3. SWOT Analysis
- 18.2.5.4. Recent Developments
- 18.2.5.5. Financials (Based on Availability)
- 18.2.6 Orecco Electric
- 18.2.6.1. Overview
- 18.2.6.2. Products
- 18.2.6.3. SWOT Analysis
- 18.2.6.4. Recent Developments
- 18.2.6.5. Financials (Based on Availability)
- 18.2.7 Fuji Electric Co Ltd
- 18.2.7.1. Overview
- 18.2.7.2. Products
- 18.2.7.3. SWOT Analysis
- 18.2.7.4. Recent Developments
- 18.2.7.5. Financials (Based on Availability)
- 18.2.8 Crompton Greaves Power and Industrial Solutions Limited
- 18.2.8.1. Overview
- 18.2.8.2. Products
- 18.2.8.3. SWOT Analysis
- 18.2.8.4. Recent Developments
- 18.2.8.5. Financials (Based on Availability)
- 18.2.9 Toshiba International Corporation
- 18.2.9.1. Overview
- 18.2.9.2. Products
- 18.2.9.3. SWOT Analysis
- 18.2.9.4. Recent Developments
- 18.2.9.5. Financials (Based on Availability)
- 18.2.10 Hubbell Incorporated
- 18.2.10.1. Overview
- 18.2.10.2. Products
- 18.2.10.3. SWOT Analysis
- 18.2.10.4. Recent Developments
- 18.2.10.5. Financials (Based on Availability)
- 18.2.11 Hitachi Ltd
- 18.2.11.1. Overview
- 18.2.11.2. Products
- 18.2.11.3. SWOT Analysis
- 18.2.11.4. Recent Developments
- 18.2.11.5. Financials (Based on Availability)
- 18.2.12 Mitsubishi Electric Corporation
- 18.2.12.1. Overview
- 18.2.12.2. Products
- 18.2.12.3. SWOT Analysis
- 18.2.12.4. Recent Developments
- 18.2.12.5. Financials (Based on Availability)
- 18.2.13 Siemens AG
- 18.2.13.1. Overview
- 18.2.13.2. Products
- 18.2.13.3. SWOT Analysis
- 18.2.13.4. Recent Developments
- 18.2.13.5. Financials (Based on Availability)
- 18.2.14 Schneider Electric SE
- 18.2.14.1. Overview
- 18.2.14.2. Products
- 18.2.14.3. SWOT Analysis
- 18.2.14.4. Recent Developments
- 18.2.14.5. Financials (Based on Availability)
- 18.2.15 Powell Industries Inc
- 18.2.15.1. Overview
- 18.2.15.2. Products
- 18.2.15.3. SWOT Analysis
- 18.2.15.4. Recent Developments
- 18.2.15.5. Financials (Based on Availability)
- 18.2.16 Meidensha Corporation
- 18.2.16.1. Overview
- 18.2.16.2. Products
- 18.2.16.3. SWOT Analysis
- 18.2.16.4. Recent Developments
- 18.2.16.5. Financials (Based on Availability)
- 18.2.17 Havells India Limited
- 18.2.17.1. Overview
- 18.2.17.2. Products
- 18.2.17.3. SWOT Analysis
- 18.2.17.4. Recent Developments
- 18.2.17.5. Financials (Based on Availability)
- 18.2.1 ZPUE S
List of Figures
- Figure 1: Global Switchgear Industry Revenue Breakdown (Million, %) by Region 2024 & 2032
- Figure 2: North America Switchgear Industry Revenue (Million), by Country 2024 & 2032
- Figure 3: North America Switchgear Industry Revenue Share (%), by Country 2024 & 2032
- Figure 4: Europe Switchgear Industry Revenue (Million), by Country 2024 & 2032
- Figure 5: Europe Switchgear Industry Revenue Share (%), by Country 2024 & 2032
- Figure 6: Asia Switchgear Industry Revenue (Million), by Country 2024 & 2032
- Figure 7: Asia Switchgear Industry Revenue Share (%), by Country 2024 & 2032
- Figure 8: Australia and New Zealand Switchgear Industry Revenue (Million), by Country 2024 & 2032
- Figure 9: Australia and New Zealand Switchgear Industry Revenue Share (%), by Country 2024 & 2032
- Figure 10: Middle East and Africa Switchgear Industry Revenue (Million), by Country 2024 & 2032
- Figure 11: Middle East and Africa Switchgear Industry Revenue Share (%), by Country 2024 & 2032
- Figure 12: Latin America Switchgear Industry Revenue (Million), by Country 2024 & 2032
- Figure 13: Latin America Switchgear Industry Revenue Share (%), by Country 2024 & 2032
- Figure 14: North America Switchgear Industry Revenue (Million), by Type 2024 & 2032
- Figure 15: North America Switchgear Industry Revenue Share (%), by Type 2024 & 2032
- Figure 16: North America Switchgear Industry Revenue (Million), by End-user Industry 2024 & 2032
- Figure 17: North America Switchgear Industry Revenue Share (%), by End-user Industry 2024 & 2032
- Figure 18: North America Switchgear Industry Revenue (Million), by Country 2024 & 2032
- Figure 19: North America Switchgear Industry Revenue Share (%), by Country 2024 & 2032
- Figure 20: Europe Switchgear Industry Revenue (Million), by Type 2024 & 2032
- Figure 21: Europe Switchgear Industry Revenue Share (%), by Type 2024 & 2032
- Figure 22: Europe Switchgear Industry Revenue (Million), by End-user Industry 2024 & 2032
- Figure 23: Europe Switchgear Industry Revenue Share (%), by End-user Industry 2024 & 2032
- Figure 24: Europe Switchgear Industry Revenue (Million), by Country 2024 & 2032
- Figure 25: Europe Switchgear Industry Revenue Share (%), by Country 2024 & 2032
- Figure 26: Asia Switchgear Industry Revenue (Million), by Type 2024 & 2032
- Figure 27: Asia Switchgear Industry Revenue Share (%), by Type 2024 & 2032
- Figure 28: Asia Switchgear Industry Revenue (Million), by End-user Industry 2024 & 2032
- Figure 29: Asia Switchgear Industry Revenue Share (%), by End-user Industry 2024 & 2032
- Figure 30: Asia Switchgear Industry Revenue (Million), by Country 2024 & 2032
- Figure 31: Asia Switchgear Industry Revenue Share (%), by Country 2024 & 2032
- Figure 32: Australia and New Zealand Switchgear Industry Revenue (Million), by Type 2024 & 2032
- Figure 33: Australia and New Zealand Switchgear Industry Revenue Share (%), by Type 2024 & 2032
- Figure 34: Australia and New Zealand Switchgear Industry Revenue (Million), by End-user Industry 2024 & 2032
- Figure 35: Australia and New Zealand Switchgear Industry Revenue Share (%), by End-user Industry 2024 & 2032
- Figure 36: Australia and New Zealand Switchgear Industry Revenue (Million), by Country 2024 & 2032
- Figure 37: Australia and New Zealand Switchgear Industry Revenue Share (%), by Country 2024 & 2032
- Figure 38: Middle East and Africa Switchgear Industry Revenue (Million), by Type 2024 & 2032
- Figure 39: Middle East and Africa Switchgear Industry Revenue Share (%), by Type 2024 & 2032
- Figure 40: Middle East and Africa Switchgear Industry Revenue (Million), by End-user Industry 2024 & 2032
- Figure 41: Middle East and Africa Switchgear Industry Revenue Share (%), by End-user Industry 2024 & 2032
- Figure 42: Middle East and Africa Switchgear Industry Revenue (Million), by Country 2024 & 2032
- Figure 43: Middle East and Africa Switchgear Industry Revenue Share (%), by Country 2024 & 2032
- Figure 44: Latin America Switchgear Industry Revenue (Million), by Type 2024 & 2032
- Figure 45: Latin America Switchgear Industry Revenue Share (%), by Type 2024 & 2032
- Figure 46: Latin America Switchgear Industry Revenue (Million), by End-user Industry 2024 & 2032
- Figure 47: Latin America Switchgear Industry Revenue Share (%), by End-user Industry 2024 & 2032
- Figure 48: Latin America Switchgear Industry Revenue (Million), by Country 2024 & 2032
- Figure 49: Latin America Switchgear Industry Revenue Share (%), by Country 2024 & 2032
List of Tables
- Table 1: Global Switchgear Industry Revenue Million Forecast, by Region 2019 & 2032
- Table 2: Global Switchgear Industry Revenue Million Forecast, by Type 2019 & 2032
- Table 3: Global Switchgear Industry Revenue Million Forecast, by End-user Industry 2019 & 2032
- Table 4: Global Switchgear Industry Revenue Million Forecast, by Region 2019 & 2032
- Table 5: Global Switchgear Industry Revenue Million Forecast, by Country 2019 & 2032
- Table 6: Switchgear Industry Revenue (Million) Forecast, by Application 2019 & 2032
- Table 7: Global Switchgear Industry Revenue Million Forecast, by Country 2019 & 2032
- Table 8: Switchgear Industry Revenue (Million) Forecast, by Application 2019 & 2032
- Table 9: Global Switchgear Industry Revenue Million Forecast, by Country 2019 & 2032
- Table 10: Switchgear Industry Revenue (Million) Forecast, by Application 2019 & 2032
- Table 11: Global Switchgear Industry Revenue Million Forecast, by Country 2019 & 2032
- Table 12: Switchgear Industry Revenue (Million) Forecast, by Application 2019 & 2032
- Table 13: Global Switchgear Industry Revenue Million Forecast, by Country 2019 & 2032
- Table 14: Switchgear Industry Revenue (Million) Forecast, by Application 2019 & 2032
- Table 15: Global Switchgear Industry Revenue Million Forecast, by Country 2019 & 2032
- Table 16: Switchgear Industry Revenue (Million) Forecast, by Application 2019 & 2032
- Table 17: Global Switchgear Industry Revenue Million Forecast, by Type 2019 & 2032
- Table 18: Global Switchgear Industry Revenue Million Forecast, by End-user Industry 2019 & 2032
- Table 19: Global Switchgear Industry Revenue Million Forecast, by Country 2019 & 2032
- Table 20: Global Switchgear Industry Revenue Million Forecast, by Type 2019 & 2032
- Table 21: Global Switchgear Industry Revenue Million Forecast, by End-user Industry 2019 & 2032
- Table 22: Global Switchgear Industry Revenue Million Forecast, by Country 2019 & 2032
- Table 23: Global Switchgear Industry Revenue Million Forecast, by Type 2019 & 2032
- Table 24: Global Switchgear Industry Revenue Million Forecast, by End-user Industry 2019 & 2032
- Table 25: Global Switchgear Industry Revenue Million Forecast, by Country 2019 & 2032
- Table 26: Global Switchgear Industry Revenue Million Forecast, by Type 2019 & 2032
- Table 27: Global Switchgear Industry Revenue Million Forecast, by End-user Industry 2019 & 2032
- Table 28: Global Switchgear Industry Revenue Million Forecast, by Country 2019 & 2032
- Table 29: Global Switchgear Industry Revenue Million Forecast, by Type 2019 & 2032
- Table 30: Global Switchgear Industry Revenue Million Forecast, by End-user Industry 2019 & 2032
- Table 31: Global Switchgear Industry Revenue Million Forecast, by Country 2019 & 2032
- Table 32: Global Switchgear Industry Revenue Million Forecast, by Type 2019 & 2032
- Table 33: Global Switchgear Industry Revenue Million Forecast, by End-user Industry 2019 & 2032
- Table 34: Global Switchgear Industry Revenue Million Forecast, by Country 2019 & 2032
Frequently Asked Questions
1. What is the projected Compound Annual Growth Rate (CAGR) of the Switchgear Industry?
The projected CAGR is approximately 6.10%.
2. Which companies are prominent players in the Switchgear Industry?
Key companies in the market include ZPUE S, Eaton Corporation, Switchgear Company, ABB Ltd, General Electric, Orecco Electric, Fuji Electric Co Ltd, Crompton Greaves Power and Industrial Solutions Limited, Toshiba International Corporation, Hubbell Incorporated, Hitachi Ltd, Mitsubishi Electric Corporation, Siemens AG, Schneider Electric SE, Powell Industries Inc, Meidensha Corporation, Havells India Limited.
3. What are the main segments of the Switchgear Industry?
The market segments include Type, End-user Industry.
4. Can you provide details about the market size?
The market size is estimated to be USD 122.24 Million as of 2022.
5. What are some drivers contributing to market growth?
Growth of Smart Electricity Grid Infrastructure; Growing Focus on Infrastructure and Renewable Energy Sources; Increased Investment in Industrial Production.
6. What are the notable trends driving market growth?
The Residential Segment to Witness a Significant Growth.
7. Are there any restraints impacting market growth?
Stringent Environmental and Safety Regulations; Increasing Competition from the Unorganized Sectors.
8. Can you provide examples of recent developments in the market?
February 2024: Schneider Electric introduced a new product called SureSeT Medium Voltage (MV) switchgear for the Canadian market. This innovative solution, which features the EvoPacT circuit breaker, aims to provide a more efficient and advanced option for primary switchgear applications that can handle digital operations effectively. SureSeT thoroughly monitors thermal, environmental, and circuit breaker health and is durable and compact. SureSeT can minimize downtime and enable faster detection of problems for quicker repairs by offering features like remote control and digital services utilizing real-time data.
9. What pricing options are available for accessing the report?
Pricing options include single-user, multi-user, and enterprise licenses priced at USD 4750, USD 5250, and USD 8750 respectively.
10. Is the market size provided in terms of value or volume?
The market size is provided in terms of value, measured in Million.
11. Are there any specific market keywords associated with the report?
Yes, the market keyword associated with the report is "Switchgear Industry," which aids in identifying and referencing the specific market segment covered.
12. How do I determine which pricing option suits my needs best?
The pricing options vary based on user requirements and access needs. Individual users may opt for single-user licenses, while businesses requiring broader access may choose multi-user or enterprise licenses for cost-effective access to the report.
13. Are there any additional resources or data provided in the Switchgear Industry report?
While the report offers comprehensive insights, it's advisable to review the specific contents or supplementary materials provided to ascertain if additional resources or data are available.
14. How can I stay updated on further developments or reports in the Switchgear Industry?
To stay informed about further developments, trends, and reports in the Switchgear Industry, consider subscribing to industry newsletters, following relevant companies and organizations, or regularly checking reputable industry news sources and publications.
Methodology
Step 1 - Identification of Relevant Samples Size from Population Database


Step 2 - Approaches for Defining Global Market Size (Value, Volume* & Price*)

Note*: In applicable scenarios
Step 3 - Data Sources
Primary Research
- Web Analytics
- Survey Reports
- Research Institute
- Latest Research Reports
- Opinion Leaders
Secondary Research
- Annual Reports
- White Paper
- Latest Press Release
- Industry Association
- Paid Database
- Investor Presentations

Step 4 - Data Triangulation
Involves using different sources of information in order to increase the validity of a study
These sources are likely to be stakeholders in a program - participants, other researchers, program staff, other community members, and so on.
Then we put all data in single framework & apply various statistical tools to find out the dynamic on the market.
During the analysis stage, feedback from the stakeholder groups would be compared to determine areas of agreement as well as areas of divergence
