

Key Insights
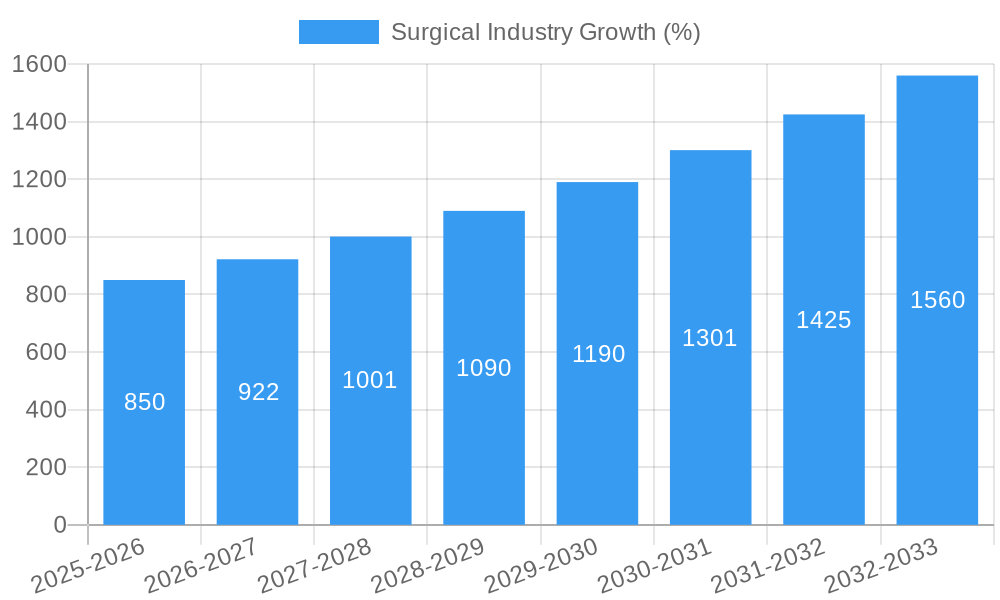
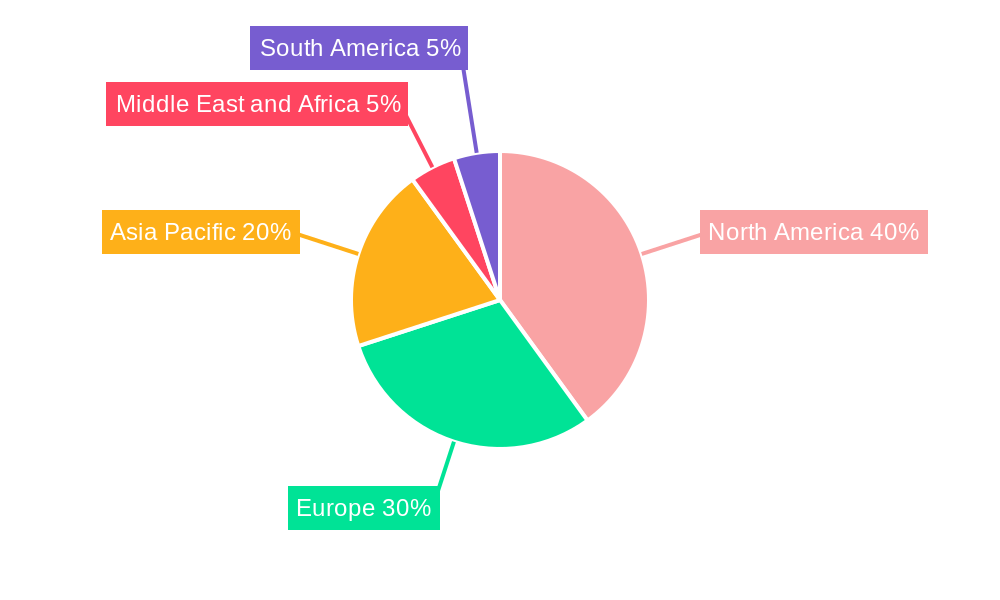
The global surgical instruments market, exhibiting a robust CAGR of 8.50%, is projected to experience significant growth between 2025 and 2033. This expansion is fueled by several key drivers, including the rising prevalence of chronic diseases necessitating surgical interventions, technological advancements in minimally invasive surgery (MIS), and an increasing geriatric population susceptible to age-related health issues requiring surgical care. The market's segmentation reveals a diverse landscape, with handheld devices, powered and electrosurgical instruments, and sutures and staplers dominating the product segment. Application-wise, the market is driven by a high demand across various specializations, including orthopedics, cardiovascular surgery, and obstetrics and gynecology. Hospitals and ambulatory surgical centers constitute the major end-users. North America and Europe currently hold substantial market shares, driven by advanced healthcare infrastructure and high adoption rates of innovative surgical technologies. However, the Asia-Pacific region is expected to witness the fastest growth due to expanding healthcare expenditure and increasing awareness regarding minimally invasive surgical procedures. Despite these positive trends, challenges such as high costs associated with advanced surgical technologies and stringent regulatory approvals pose certain restraints to market growth.
Growth is expected to be particularly strong in emerging economies, where improved healthcare infrastructure and increased affordability of surgical procedures are creating substantial demand. The competitive landscape is populated by a mix of established multinational corporations and smaller specialized companies, leading to innovation and competition in product development and market penetration. The focus on developing less invasive procedures, enhancing device functionalities, and improving patient outcomes will shape the market's trajectory. Strategic partnerships, mergers, and acquisitions are expected to further consolidate the market and drive innovation in surgical technology, enhancing both the quality and efficiency of surgical procedures in the coming years. The market is therefore poised for considerable growth fueled by demographic shifts, technological improvements, and increasing access to quality healthcare across the globe.
Surgical Industry Market Report: 2019-2033
This comprehensive report provides an in-depth analysis of the global surgical industry, projecting a market value of $xx Million by 2033. It offers a detailed examination of market dynamics, competitive landscapes, and future growth opportunities, covering the period from 2019 to 2033 (Historical Period: 2019–2024, Base Year: 2025, Estimated Year: 2025, Forecast Period: 2025–2033). This report is essential for stakeholders, investors, and industry professionals seeking a comprehensive understanding of this dynamic sector.
Surgical Industry Market Composition & Trends
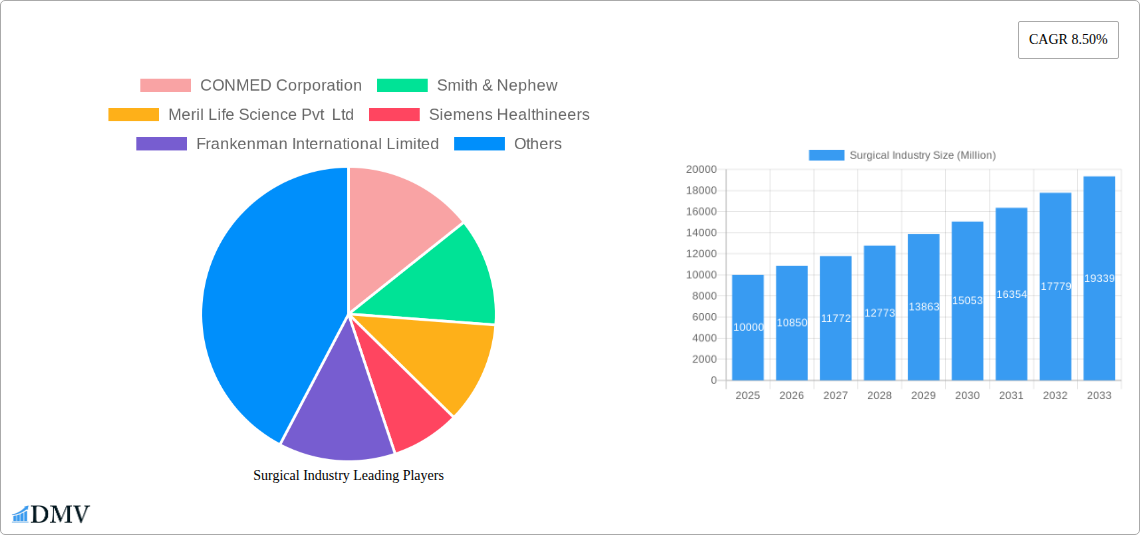
The surgical industry, valued at $xx Million in 2024, exhibits a moderately concentrated market structure with key players such as Johnson & Johnson (Ethicon), Medtronic PLC, and Stryker Corporation holding significant market share. However, the presence of numerous smaller players and emerging innovators ensures a dynamic competitive landscape. Innovation is fueled by advancements in minimally invasive surgery, robotic surgery, and digital technologies. The regulatory landscape, varying across regions, significantly impacts market access and product approvals. Substitute products, like non-surgical therapies, pose a competitive threat, yet the demand for surgical interventions remains substantial. Mergers and acquisitions (M&A) play a crucial role in shaping the market, with deal values exceeding $xx Million in recent years.
- Market Concentration: Moderately concentrated, with top players holding a combined xx% market share.
- Innovation Catalysts: Minimally invasive techniques, robotics, AI-powered diagnostics.
- Regulatory Landscape: Stringent regulations in developed markets; varying approval processes globally.
- Substitute Products: Non-surgical treatments offering competition in specific areas.
- End-User Profile: Predominantly hospitals and ambulatory surgical centers, with a growing role for other end users.
- M&A Activity: Significant M&A activity with total deal values exceeding $xx Million in the last 5 years.
Surgical Industry Industry Evolution
The surgical industry has witnessed robust growth throughout the historical period (2019-2024), expanding at a CAGR of xx%. This growth trajectory is driven by several factors: an aging global population requiring more surgical interventions, technological advancements leading to safer and more effective procedures, and rising disposable incomes in developing nations. Technological innovations, particularly in minimally invasive surgery (MIS), robotics, and image-guided surgery, are transforming surgical practices, improving patient outcomes, and increasing the demand for advanced surgical devices and instruments. Shifting consumer demands toward less invasive procedures and quicker recovery times are pushing the industry towards innovation.
Leading Regions, Countries, or Segments in Surgical Industry
The North American region currently dominates the surgical industry, driven by high healthcare expenditure, advanced medical infrastructure, and a large number of surgical procedures. Within product segments, powered and electrosurgical devices exhibit the highest growth, owing to their versatility and precision. The orthopedics application segment leads in terms of market size, primarily due to the high prevalence of musculoskeletal disorders. Hospitals continue to be the largest end-users, but ambulatory surgical centers are witnessing significant growth.
Key Drivers (North America):
- High healthcare expenditure
- Advanced medical infrastructure
- High adoption of advanced surgical technologies
- Favorable regulatory environment
Dominant Product Segment: Powered and Electrosurgical Devices (driven by technological advancements and increased adoption).
Largest Application Segment: Orthopedics (due to increasing prevalence of musculoskeletal disorders and aging population)
Primary End-User: Hospitals (due to established infrastructure and comprehensive care capabilities).
Surgical Industry Product Innovations
Recent innovations include digitally enabled staplers offering enhanced precision and ease of use, as seen with the launch of Ethicon's ECHELON 3000 Stapler. Single-use devices like Xenco Medical's Multilevel CerviKit are gaining traction, driven by cost-effectiveness and infection control benefits. Advancements in robotic surgery systems are continuously improving precision, minimally invasiveness, and surgeon control. These innovations significantly improve surgical outcomes, reduce recovery times, and enhance patient satisfaction.
Propelling Factors for Surgical Industry Growth
Technological advancements, like minimally invasive techniques and robotic surgery, are major drivers. Increasing prevalence of chronic diseases necessitate more surgeries. Government initiatives promoting healthcare infrastructure development in developing economies contribute significantly. Favorable regulatory environments, fostering innovation and market entry, further fuel growth. The rise of ambulatory surgical centers expands access to surgical procedures, enhancing market potential.
Obstacles in the Surgical Industry Market
Stringent regulatory requirements, increasing product development costs, and intense competition from established players pose challenges. Supply chain disruptions impact the availability of raw materials and finished goods, resulting in production delays and price increases. High costs associated with advanced surgical technologies hinder market penetration in low-income countries. The reimbursement policies of healthcare insurance providers also influence market access.
Future Opportunities in Surgical Industry
Emerging markets in Asia and Africa present significant growth potential. The development of personalized medicine and AI-powered surgical tools is creating new opportunities. Focus on developing minimally invasive and single-use devices will continue to enhance efficiency and patient outcomes. Tele-surgery and remote surgical guidance hold the potential to transform surgical care access in remote areas.
Major Players in the Surgical Industry Ecosystem
- CONMED Corporation
- Smith & Nephew
- Meril Life Science Pvt Ltd
- Siemens Healthineers
- Frankenman International Limited
- Medtronic PLC
- 3M Company
- Cadence
- Johnson & Johnson (Ethicon)
- Intuitive Surgical Inc
- B Braun Melsungen AG
- Stryker Corporation
- Boston Scientific Corporation
- Zimmer Biomet
- Olympus Corporation
Key Developments in Surgical Industry Industry
- June 2022: Xenco Medical receives FDA clearance and launches Multilevel CerviKit, a single-use cervical spine technology.
- June 2022: Ethicon launches the ECHELON 3000 Stapler, a digitally enabled surgical stapler.
Strategic Surgical Industry Market Forecast
The surgical industry is poised for continued growth, driven by technological advancements, increasing prevalence of chronic diseases, and expanding access to surgical care. The focus on minimally invasive procedures, robotic surgery, and personalized medicine will shape future market dynamics. Emerging markets, especially in Asia and Africa, will present significant growth opportunities for key players. The market is expected to reach $xx Million by 2033, exhibiting a CAGR of xx% during the forecast period (2025-2033).
Surgical Industry Segmentation
-
1. Product
- 1.1. Handheld Devices
- 1.2. Powered and Electrosurgical Devices
- 1.3. Sutures and Staplers
-
2. Application
- 2.1. Obstetrics and Gynecology
- 2.2. Orthopedics
- 2.3. Cardiovascular
- 2.4. Neurology
- 2.5. Plastic and Reconstructive Surgeries
- 2.6. Other Applications
-
3. End User
- 3.1. Hospitals
- 3.2. Ambulatory Surgical Centers
- 3.3. Other End Users
Surgical Industry Segmentation By Geography
-
1. North America
- 1.1. United States
- 1.2. Canada
- 1.3. Mexico
-
2. Europe
- 2.1. Germany
- 2.2. United Kingdom
- 2.3. France
- 2.4. Italy
- 2.5. Spain
- 2.6. Rest of Europe
-
3. Asia Pacific
- 3.1. China
- 3.2. Japan
- 3.3. India
- 3.4. Australia
- 3.5. South Korea
- 3.6. Rest of Asia Pacific
-
4. Middle East and Africa
- 4.1. GCC
- 4.2. South Africa
- 4.3. Rest of Middle East and Africa
-
5. South America
- 5.1. Brazil
- 5.2. Argentina
- 5.3. Rest of South America
Surgical Industry REPORT HIGHLIGHTS
| Aspects | Details |
|---|---|
| Study Period | 2019-2033 |
| Base Year | 2024 |
| Estimated Year | 2025 |
| Forecast Period | 2025-2033 |
| Historical Period | 2019-2024 |
| Growth Rate | CAGR of 8.50% from 2019-2033 |
| Segmentation |
|
Table of Contents
- 1. Introduction
- 1.1. Research Scope
- 1.2. Market Segmentation
- 1.3. Research Methodology
- 1.4. Definitions and Assumptions
- 2. Executive Summary
- 2.1. Introduction
- 3. Market Dynamics
- 3.1. Introduction
- 3.2. Market Drivers
- 3.2.1. Rising Geriatric Population with Increasing Number of Surgeries; Growing Technological Advances; Rising Number of Road and Other Accidents
- 3.3. Market Restrains
- 3.3.1. Increased Risk of Infections; Stringent Safety Regulations
- 3.4. Market Trends
- 3.4.1. Powered and Electrosurgical Segment Holds Significant Share in Surgical Equipment Market
- 4. Market Factor Analysis
- 4.1. Porters Five Forces
- 4.2. Supply/Value Chain
- 4.3. PESTEL analysis
- 4.4. Market Entropy
- 4.5. Patent/Trademark Analysis
- 5. Global Surgical Industry Analysis, Insights and Forecast, 2019-2031
- 5.1. Market Analysis, Insights and Forecast - by Product
- 5.1.1. Handheld Devices
- 5.1.2. Powered and Electrosurgical Devices
- 5.1.3. Sutures and Staplers
- 5.2. Market Analysis, Insights and Forecast - by Application
- 5.2.1. Obstetrics and Gynecology
- 5.2.2. Orthopedics
- 5.2.3. Cardiovascular
- 5.2.4. Neurology
- 5.2.5. Plastic and Reconstructive Surgeries
- 5.2.6. Other Applications
- 5.3. Market Analysis, Insights and Forecast - by End User
- 5.3.1. Hospitals
- 5.3.2. Ambulatory Surgical Centers
- 5.3.3. Other End Users
- 5.4. Market Analysis, Insights and Forecast - by Region
- 5.4.1. North America
- 5.4.2. Europe
- 5.4.3. Asia Pacific
- 5.4.4. Middle East and Africa
- 5.4.5. South America
- 5.1. Market Analysis, Insights and Forecast - by Product
- 6. North America Surgical Industry Analysis, Insights and Forecast, 2019-2031
- 6.1. Market Analysis, Insights and Forecast - by Product
- 6.1.1. Handheld Devices
- 6.1.2. Powered and Electrosurgical Devices
- 6.1.3. Sutures and Staplers
- 6.2. Market Analysis, Insights and Forecast - by Application
- 6.2.1. Obstetrics and Gynecology
- 6.2.2. Orthopedics
- 6.2.3. Cardiovascular
- 6.2.4. Neurology
- 6.2.5. Plastic and Reconstructive Surgeries
- 6.2.6. Other Applications
- 6.3. Market Analysis, Insights and Forecast - by End User
- 6.3.1. Hospitals
- 6.3.2. Ambulatory Surgical Centers
- 6.3.3. Other End Users
- 6.1. Market Analysis, Insights and Forecast - by Product
- 7. Europe Surgical Industry Analysis, Insights and Forecast, 2019-2031
- 7.1. Market Analysis, Insights and Forecast - by Product
- 7.1.1. Handheld Devices
- 7.1.2. Powered and Electrosurgical Devices
- 7.1.3. Sutures and Staplers
- 7.2. Market Analysis, Insights and Forecast - by Application
- 7.2.1. Obstetrics and Gynecology
- 7.2.2. Orthopedics
- 7.2.3. Cardiovascular
- 7.2.4. Neurology
- 7.2.5. Plastic and Reconstructive Surgeries
- 7.2.6. Other Applications
- 7.3. Market Analysis, Insights and Forecast - by End User
- 7.3.1. Hospitals
- 7.3.2. Ambulatory Surgical Centers
- 7.3.3. Other End Users
- 7.1. Market Analysis, Insights and Forecast - by Product
- 8. Asia Pacific Surgical Industry Analysis, Insights and Forecast, 2019-2031
- 8.1. Market Analysis, Insights and Forecast - by Product
- 8.1.1. Handheld Devices
- 8.1.2. Powered and Electrosurgical Devices
- 8.1.3. Sutures and Staplers
- 8.2. Market Analysis, Insights and Forecast - by Application
- 8.2.1. Obstetrics and Gynecology
- 8.2.2. Orthopedics
- 8.2.3. Cardiovascular
- 8.2.4. Neurology
- 8.2.5. Plastic and Reconstructive Surgeries
- 8.2.6. Other Applications
- 8.3. Market Analysis, Insights and Forecast - by End User
- 8.3.1. Hospitals
- 8.3.2. Ambulatory Surgical Centers
- 8.3.3. Other End Users
- 8.1. Market Analysis, Insights and Forecast - by Product
- 9. Middle East and Africa Surgical Industry Analysis, Insights and Forecast, 2019-2031
- 9.1. Market Analysis, Insights and Forecast - by Product
- 9.1.1. Handheld Devices
- 9.1.2. Powered and Electrosurgical Devices
- 9.1.3. Sutures and Staplers
- 9.2. Market Analysis, Insights and Forecast - by Application
- 9.2.1. Obstetrics and Gynecology
- 9.2.2. Orthopedics
- 9.2.3. Cardiovascular
- 9.2.4. Neurology
- 9.2.5. Plastic and Reconstructive Surgeries
- 9.2.6. Other Applications
- 9.3. Market Analysis, Insights and Forecast - by End User
- 9.3.1. Hospitals
- 9.3.2. Ambulatory Surgical Centers
- 9.3.3. Other End Users
- 9.1. Market Analysis, Insights and Forecast - by Product
- 10. South America Surgical Industry Analysis, Insights and Forecast, 2019-2031
- 10.1. Market Analysis, Insights and Forecast - by Product
- 10.1.1. Handheld Devices
- 10.1.2. Powered and Electrosurgical Devices
- 10.1.3. Sutures and Staplers
- 10.2. Market Analysis, Insights and Forecast - by Application
- 10.2.1. Obstetrics and Gynecology
- 10.2.2. Orthopedics
- 10.2.3. Cardiovascular
- 10.2.4. Neurology
- 10.2.5. Plastic and Reconstructive Surgeries
- 10.2.6. Other Applications
- 10.3. Market Analysis, Insights and Forecast - by End User
- 10.3.1. Hospitals
- 10.3.2. Ambulatory Surgical Centers
- 10.3.3. Other End Users
- 10.1. Market Analysis, Insights and Forecast - by Product
- 11. North America Surgical Industry Analysis, Insights and Forecast, 2019-2031
- 11.1. Market Analysis, Insights and Forecast - By Country/Sub-region
- 11.1.1 United States
- 11.1.2 Canada
- 11.1.3 Mexico
- 12. Europe Surgical Industry Analysis, Insights and Forecast, 2019-2031
- 12.1. Market Analysis, Insights and Forecast - By Country/Sub-region
- 12.1.1 Germany
- 12.1.2 United Kingdom
- 12.1.3 France
- 12.1.4 Italy
- 12.1.5 Spain
- 12.1.6 Rest of Europe
- 13. Asia Pacific Surgical Industry Analysis, Insights and Forecast, 2019-2031
- 13.1. Market Analysis, Insights and Forecast - By Country/Sub-region
- 13.1.1 China
- 13.1.2 Japan
- 13.1.3 India
- 13.1.4 Australia
- 13.1.5 South Korea
- 13.1.6 Rest of Asia Pacific
- 14. Middle East and Africa Surgical Industry Analysis, Insights and Forecast, 2019-2031
- 14.1. Market Analysis, Insights and Forecast - By Country/Sub-region
- 14.1.1 GCC
- 14.1.2 South Africa
- 14.1.3 Rest of Middle East and Africa
- 15. South America Surgical Industry Analysis, Insights and Forecast, 2019-2031
- 15.1. Market Analysis, Insights and Forecast - By Country/Sub-region
- 15.1.1 Brazil
- 15.1.2 Argentina
- 15.1.3 Rest of South America
- 16. Competitive Analysis
- 16.1. Global Market Share Analysis 2024
- 16.2. Company Profiles
- 16.2.1 CONMED Corporation
- 16.2.1.1. Overview
- 16.2.1.2. Products
- 16.2.1.3. SWOT Analysis
- 16.2.1.4. Recent Developments
- 16.2.1.5. Financials (Based on Availability)
- 16.2.2 Smith & Nephew
- 16.2.2.1. Overview
- 16.2.2.2. Products
- 16.2.2.3. SWOT Analysis
- 16.2.2.4. Recent Developments
- 16.2.2.5. Financials (Based on Availability)
- 16.2.3 Meril Life Science Pvt Ltd
- 16.2.3.1. Overview
- 16.2.3.2. Products
- 16.2.3.3. SWOT Analysis
- 16.2.3.4. Recent Developments
- 16.2.3.5. Financials (Based on Availability)
- 16.2.4 Siemens Healthineers
- 16.2.4.1. Overview
- 16.2.4.2. Products
- 16.2.4.3. SWOT Analysis
- 16.2.4.4. Recent Developments
- 16.2.4.5. Financials (Based on Availability)
- 16.2.5 Frankenman International Limited
- 16.2.5.1. Overview
- 16.2.5.2. Products
- 16.2.5.3. SWOT Analysis
- 16.2.5.4. Recent Developments
- 16.2.5.5. Financials (Based on Availability)
- 16.2.6 Medtronic PLC
- 16.2.6.1. Overview
- 16.2.6.2. Products
- 16.2.6.3. SWOT Analysis
- 16.2.6.4. Recent Developments
- 16.2.6.5. Financials (Based on Availability)
- 16.2.7 3M Company*List Not Exhaustive
- 16.2.7.1. Overview
- 16.2.7.2. Products
- 16.2.7.3. SWOT Analysis
- 16.2.7.4. Recent Developments
- 16.2.7.5. Financials (Based on Availability)
- 16.2.8 Cadence
- 16.2.8.1. Overview
- 16.2.8.2. Products
- 16.2.8.3. SWOT Analysis
- 16.2.8.4. Recent Developments
- 16.2.8.5. Financials (Based on Availability)
- 16.2.9 Johnson & Johnson (Ethicon)
- 16.2.9.1. Overview
- 16.2.9.2. Products
- 16.2.9.3. SWOT Analysis
- 16.2.9.4. Recent Developments
- 16.2.9.5. Financials (Based on Availability)
- 16.2.10 Intuitive Surgical Inc
- 16.2.10.1. Overview
- 16.2.10.2. Products
- 16.2.10.3. SWOT Analysis
- 16.2.10.4. Recent Developments
- 16.2.10.5. Financials (Based on Availability)
- 16.2.11 B Braun Melsungen AG
- 16.2.11.1. Overview
- 16.2.11.2. Products
- 16.2.11.3. SWOT Analysis
- 16.2.11.4. Recent Developments
- 16.2.11.5. Financials (Based on Availability)
- 16.2.12 Stryker Corporation
- 16.2.12.1. Overview
- 16.2.12.2. Products
- 16.2.12.3. SWOT Analysis
- 16.2.12.4. Recent Developments
- 16.2.12.5. Financials (Based on Availability)
- 16.2.13 Boston Scientific Corporation
- 16.2.13.1. Overview
- 16.2.13.2. Products
- 16.2.13.3. SWOT Analysis
- 16.2.13.4. Recent Developments
- 16.2.13.5. Financials (Based on Availability)
- 16.2.14 Zimmer Biomet
- 16.2.14.1. Overview
- 16.2.14.2. Products
- 16.2.14.3. SWOT Analysis
- 16.2.14.4. Recent Developments
- 16.2.14.5. Financials (Based on Availability)
- 16.2.15 Olympus Corporation
- 16.2.15.1. Overview
- 16.2.15.2. Products
- 16.2.15.3. SWOT Analysis
- 16.2.15.4. Recent Developments
- 16.2.15.5. Financials (Based on Availability)
- 16.2.1 CONMED Corporation
List of Figures
- Figure 1: Global Surgical Industry Revenue Breakdown (Million, %) by Region 2024 & 2032
- Figure 2: North America Surgical Industry Revenue (Million), by Country 2024 & 2032
- Figure 3: North America Surgical Industry Revenue Share (%), by Country 2024 & 2032
- Figure 4: Europe Surgical Industry Revenue (Million), by Country 2024 & 2032
- Figure 5: Europe Surgical Industry Revenue Share (%), by Country 2024 & 2032
- Figure 6: Asia Pacific Surgical Industry Revenue (Million), by Country 2024 & 2032
- Figure 7: Asia Pacific Surgical Industry Revenue Share (%), by Country 2024 & 2032
- Figure 8: Middle East and Africa Surgical Industry Revenue (Million), by Country 2024 & 2032
- Figure 9: Middle East and Africa Surgical Industry Revenue Share (%), by Country 2024 & 2032
- Figure 10: South America Surgical Industry Revenue (Million), by Country 2024 & 2032
- Figure 11: South America Surgical Industry Revenue Share (%), by Country 2024 & 2032
- Figure 12: North America Surgical Industry Revenue (Million), by Product 2024 & 2032
- Figure 13: North America Surgical Industry Revenue Share (%), by Product 2024 & 2032
- Figure 14: North America Surgical Industry Revenue (Million), by Application 2024 & 2032
- Figure 15: North America Surgical Industry Revenue Share (%), by Application 2024 & 2032
- Figure 16: North America Surgical Industry Revenue (Million), by End User 2024 & 2032
- Figure 17: North America Surgical Industry Revenue Share (%), by End User 2024 & 2032
- Figure 18: North America Surgical Industry Revenue (Million), by Country 2024 & 2032
- Figure 19: North America Surgical Industry Revenue Share (%), by Country 2024 & 2032
- Figure 20: Europe Surgical Industry Revenue (Million), by Product 2024 & 2032
- Figure 21: Europe Surgical Industry Revenue Share (%), by Product 2024 & 2032
- Figure 22: Europe Surgical Industry Revenue (Million), by Application 2024 & 2032
- Figure 23: Europe Surgical Industry Revenue Share (%), by Application 2024 & 2032
- Figure 24: Europe Surgical Industry Revenue (Million), by End User 2024 & 2032
- Figure 25: Europe Surgical Industry Revenue Share (%), by End User 2024 & 2032
- Figure 26: Europe Surgical Industry Revenue (Million), by Country 2024 & 2032
- Figure 27: Europe Surgical Industry Revenue Share (%), by Country 2024 & 2032
- Figure 28: Asia Pacific Surgical Industry Revenue (Million), by Product 2024 & 2032
- Figure 29: Asia Pacific Surgical Industry Revenue Share (%), by Product 2024 & 2032
- Figure 30: Asia Pacific Surgical Industry Revenue (Million), by Application 2024 & 2032
- Figure 31: Asia Pacific Surgical Industry Revenue Share (%), by Application 2024 & 2032
- Figure 32: Asia Pacific Surgical Industry Revenue (Million), by End User 2024 & 2032
- Figure 33: Asia Pacific Surgical Industry Revenue Share (%), by End User 2024 & 2032
- Figure 34: Asia Pacific Surgical Industry Revenue (Million), by Country 2024 & 2032
- Figure 35: Asia Pacific Surgical Industry Revenue Share (%), by Country 2024 & 2032
- Figure 36: Middle East and Africa Surgical Industry Revenue (Million), by Product 2024 & 2032
- Figure 37: Middle East and Africa Surgical Industry Revenue Share (%), by Product 2024 & 2032
- Figure 38: Middle East and Africa Surgical Industry Revenue (Million), by Application 2024 & 2032
- Figure 39: Middle East and Africa Surgical Industry Revenue Share (%), by Application 2024 & 2032
- Figure 40: Middle East and Africa Surgical Industry Revenue (Million), by End User 2024 & 2032
- Figure 41: Middle East and Africa Surgical Industry Revenue Share (%), by End User 2024 & 2032
- Figure 42: Middle East and Africa Surgical Industry Revenue (Million), by Country 2024 & 2032
- Figure 43: Middle East and Africa Surgical Industry Revenue Share (%), by Country 2024 & 2032
- Figure 44: South America Surgical Industry Revenue (Million), by Product 2024 & 2032
- Figure 45: South America Surgical Industry Revenue Share (%), by Product 2024 & 2032
- Figure 46: South America Surgical Industry Revenue (Million), by Application 2024 & 2032
- Figure 47: South America Surgical Industry Revenue Share (%), by Application 2024 & 2032
- Figure 48: South America Surgical Industry Revenue (Million), by End User 2024 & 2032
- Figure 49: South America Surgical Industry Revenue Share (%), by End User 2024 & 2032
- Figure 50: South America Surgical Industry Revenue (Million), by Country 2024 & 2032
- Figure 51: South America Surgical Industry Revenue Share (%), by Country 2024 & 2032
List of Tables
- Table 1: Global Surgical Industry Revenue Million Forecast, by Region 2019 & 2032
- Table 2: Global Surgical Industry Revenue Million Forecast, by Product 2019 & 2032
- Table 3: Global Surgical Industry Revenue Million Forecast, by Application 2019 & 2032
- Table 4: Global Surgical Industry Revenue Million Forecast, by End User 2019 & 2032
- Table 5: Global Surgical Industry Revenue Million Forecast, by Region 2019 & 2032
- Table 6: Global Surgical Industry Revenue Million Forecast, by Country 2019 & 2032
- Table 7: United States Surgical Industry Revenue (Million) Forecast, by Application 2019 & 2032
- Table 8: Canada Surgical Industry Revenue (Million) Forecast, by Application 2019 & 2032
- Table 9: Mexico Surgical Industry Revenue (Million) Forecast, by Application 2019 & 2032
- Table 10: Global Surgical Industry Revenue Million Forecast, by Country 2019 & 2032
- Table 11: Germany Surgical Industry Revenue (Million) Forecast, by Application 2019 & 2032
- Table 12: United Kingdom Surgical Industry Revenue (Million) Forecast, by Application 2019 & 2032
- Table 13: France Surgical Industry Revenue (Million) Forecast, by Application 2019 & 2032
- Table 14: Italy Surgical Industry Revenue (Million) Forecast, by Application 2019 & 2032
- Table 15: Spain Surgical Industry Revenue (Million) Forecast, by Application 2019 & 2032
- Table 16: Rest of Europe Surgical Industry Revenue (Million) Forecast, by Application 2019 & 2032
- Table 17: Global Surgical Industry Revenue Million Forecast, by Country 2019 & 2032
- Table 18: China Surgical Industry Revenue (Million) Forecast, by Application 2019 & 2032
- Table 19: Japan Surgical Industry Revenue (Million) Forecast, by Application 2019 & 2032
- Table 20: India Surgical Industry Revenue (Million) Forecast, by Application 2019 & 2032
- Table 21: Australia Surgical Industry Revenue (Million) Forecast, by Application 2019 & 2032
- Table 22: South Korea Surgical Industry Revenue (Million) Forecast, by Application 2019 & 2032
- Table 23: Rest of Asia Pacific Surgical Industry Revenue (Million) Forecast, by Application 2019 & 2032
- Table 24: Global Surgical Industry Revenue Million Forecast, by Country 2019 & 2032
- Table 25: GCC Surgical Industry Revenue (Million) Forecast, by Application 2019 & 2032
- Table 26: South Africa Surgical Industry Revenue (Million) Forecast, by Application 2019 & 2032
- Table 27: Rest of Middle East and Africa Surgical Industry Revenue (Million) Forecast, by Application 2019 & 2032
- Table 28: Global Surgical Industry Revenue Million Forecast, by Country 2019 & 2032
- Table 29: Brazil Surgical Industry Revenue (Million) Forecast, by Application 2019 & 2032
- Table 30: Argentina Surgical Industry Revenue (Million) Forecast, by Application 2019 & 2032
- Table 31: Rest of South America Surgical Industry Revenue (Million) Forecast, by Application 2019 & 2032
- Table 32: Global Surgical Industry Revenue Million Forecast, by Product 2019 & 2032
- Table 33: Global Surgical Industry Revenue Million Forecast, by Application 2019 & 2032
- Table 34: Global Surgical Industry Revenue Million Forecast, by End User 2019 & 2032
- Table 35: Global Surgical Industry Revenue Million Forecast, by Country 2019 & 2032
- Table 36: United States Surgical Industry Revenue (Million) Forecast, by Application 2019 & 2032
- Table 37: Canada Surgical Industry Revenue (Million) Forecast, by Application 2019 & 2032
- Table 38: Mexico Surgical Industry Revenue (Million) Forecast, by Application 2019 & 2032
- Table 39: Global Surgical Industry Revenue Million Forecast, by Product 2019 & 2032
- Table 40: Global Surgical Industry Revenue Million Forecast, by Application 2019 & 2032
- Table 41: Global Surgical Industry Revenue Million Forecast, by End User 2019 & 2032
- Table 42: Global Surgical Industry Revenue Million Forecast, by Country 2019 & 2032
- Table 43: Germany Surgical Industry Revenue (Million) Forecast, by Application 2019 & 2032
- Table 44: United Kingdom Surgical Industry Revenue (Million) Forecast, by Application 2019 & 2032
- Table 45: France Surgical Industry Revenue (Million) Forecast, by Application 2019 & 2032
- Table 46: Italy Surgical Industry Revenue (Million) Forecast, by Application 2019 & 2032
- Table 47: Spain Surgical Industry Revenue (Million) Forecast, by Application 2019 & 2032
- Table 48: Rest of Europe Surgical Industry Revenue (Million) Forecast, by Application 2019 & 2032
- Table 49: Global Surgical Industry Revenue Million Forecast, by Product 2019 & 2032
- Table 50: Global Surgical Industry Revenue Million Forecast, by Application 2019 & 2032
- Table 51: Global Surgical Industry Revenue Million Forecast, by End User 2019 & 2032
- Table 52: Global Surgical Industry Revenue Million Forecast, by Country 2019 & 2032
- Table 53: China Surgical Industry Revenue (Million) Forecast, by Application 2019 & 2032
- Table 54: Japan Surgical Industry Revenue (Million) Forecast, by Application 2019 & 2032
- Table 55: India Surgical Industry Revenue (Million) Forecast, by Application 2019 & 2032
- Table 56: Australia Surgical Industry Revenue (Million) Forecast, by Application 2019 & 2032
- Table 57: South Korea Surgical Industry Revenue (Million) Forecast, by Application 2019 & 2032
- Table 58: Rest of Asia Pacific Surgical Industry Revenue (Million) Forecast, by Application 2019 & 2032
- Table 59: Global Surgical Industry Revenue Million Forecast, by Product 2019 & 2032
- Table 60: Global Surgical Industry Revenue Million Forecast, by Application 2019 & 2032
- Table 61: Global Surgical Industry Revenue Million Forecast, by End User 2019 & 2032
- Table 62: Global Surgical Industry Revenue Million Forecast, by Country 2019 & 2032
- Table 63: GCC Surgical Industry Revenue (Million) Forecast, by Application 2019 & 2032
- Table 64: South Africa Surgical Industry Revenue (Million) Forecast, by Application 2019 & 2032
- Table 65: Rest of Middle East and Africa Surgical Industry Revenue (Million) Forecast, by Application 2019 & 2032
- Table 66: Global Surgical Industry Revenue Million Forecast, by Product 2019 & 2032
- Table 67: Global Surgical Industry Revenue Million Forecast, by Application 2019 & 2032
- Table 68: Global Surgical Industry Revenue Million Forecast, by End User 2019 & 2032
- Table 69: Global Surgical Industry Revenue Million Forecast, by Country 2019 & 2032
- Table 70: Brazil Surgical Industry Revenue (Million) Forecast, by Application 2019 & 2032
- Table 71: Argentina Surgical Industry Revenue (Million) Forecast, by Application 2019 & 2032
- Table 72: Rest of South America Surgical Industry Revenue (Million) Forecast, by Application 2019 & 2032
Frequently Asked Questions
1. What is the projected Compound Annual Growth Rate (CAGR) of the Surgical Industry?
The projected CAGR is approximately 8.50%.
2. Which companies are prominent players in the Surgical Industry?
Key companies in the market include CONMED Corporation, Smith & Nephew, Meril Life Science Pvt Ltd, Siemens Healthineers, Frankenman International Limited, Medtronic PLC, 3M Company*List Not Exhaustive, Cadence, Johnson & Johnson (Ethicon), Intuitive Surgical Inc, B Braun Melsungen AG, Stryker Corporation, Boston Scientific Corporation, Zimmer Biomet, Olympus Corporation.
3. What are the main segments of the Surgical Industry?
The market segments include Product, Application, End User.
4. Can you provide details about the market size?
The market size is estimated to be USD XX Million as of 2022.
5. What are some drivers contributing to market growth?
Rising Geriatric Population with Increasing Number of Surgeries; Growing Technological Advances; Rising Number of Road and Other Accidents.
6. What are the notable trends driving market growth?
Powered and Electrosurgical Segment Holds Significant Share in Surgical Equipment Market.
7. Are there any restraints impacting market growth?
Increased Risk of Infections; Stringent Safety Regulations.
8. Can you provide examples of recent developments in the market?
In June 2022, Xenco Medical expanded its Ambulatory Surgical Centers surgical device portfolio through the United States Food and Drug Administration clearance and launch of its Multilevel CerviKit. It is single-use cervical spine technology to include a comprehensive suite of implants and single-use instruments for 2, 3, and 4-level anterior cervical spine procedures.
9. What pricing options are available for accessing the report?
Pricing options include single-user, multi-user, and enterprise licenses priced at USD 4750, USD 5250, and USD 8750 respectively.
10. Is the market size provided in terms of value or volume?
The market size is provided in terms of value, measured in Million.
11. Are there any specific market keywords associated with the report?
Yes, the market keyword associated with the report is "Surgical Industry," which aids in identifying and referencing the specific market segment covered.
12. How do I determine which pricing option suits my needs best?
The pricing options vary based on user requirements and access needs. Individual users may opt for single-user licenses, while businesses requiring broader access may choose multi-user or enterprise licenses for cost-effective access to the report.
13. Are there any additional resources or data provided in the Surgical Industry report?
While the report offers comprehensive insights, it's advisable to review the specific contents or supplementary materials provided to ascertain if additional resources or data are available.
14. How can I stay updated on further developments or reports in the Surgical Industry?
To stay informed about further developments, trends, and reports in the Surgical Industry, consider subscribing to industry newsletters, following relevant companies and organizations, or regularly checking reputable industry news sources and publications.
Methodology
Step 1 - Identification of Relevant Samples Size from Population Database


Step 2 - Approaches for Defining Global Market Size (Value, Volume* & Price*)

Note*: In applicable scenarios
Step 3 - Data Sources
Primary Research
- Web Analytics
- Survey Reports
- Research Institute
- Latest Research Reports
- Opinion Leaders
Secondary Research
- Annual Reports
- White Paper
- Latest Press Release
- Industry Association
- Paid Database
- Investor Presentations

Step 4 - Data Triangulation
Involves using different sources of information in order to increase the validity of a study
These sources are likely to be stakeholders in a program - participants, other researchers, program staff, other community members, and so on.
Then we put all data in single framework & apply various statistical tools to find out the dynamic on the market.
During the analysis stage, feedback from the stakeholder groups would be compared to determine areas of agreement as well as areas of divergence
