

Key Insights
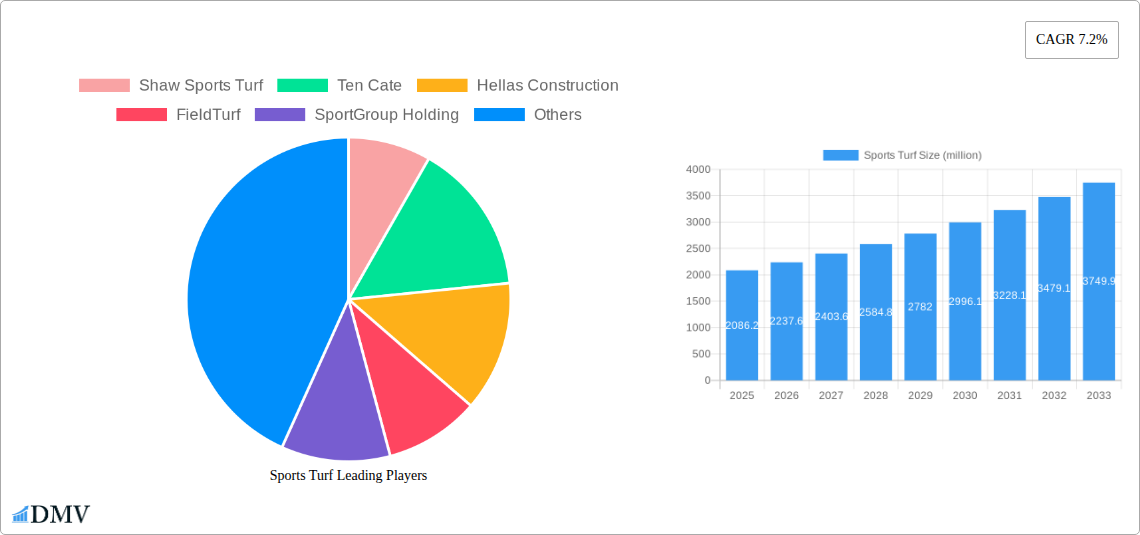
The global sports turf market, valued at $2086.2 million in 2025, is projected to experience robust growth, driven by several key factors. Increasing participation in sports at all levels, from amateur to professional, fuels demand for high-performance, durable, and aesthetically pleasing playing surfaces. The rising popularity of artificial turf due to its low maintenance, consistent playing conditions, and year-round usability further contributes to market expansion. Furthermore, advancements in turf technology, such as improved drainage systems, enhanced fiber materials, and innovative infill solutions, are driving product innovation and expanding application possibilities beyond traditional sports fields to include playgrounds, landscaping, and recreational areas. Government initiatives promoting sports infrastructure development, particularly in emerging economies, also contribute to market growth. However, the market faces challenges such as initial high installation costs and concerns surrounding the environmental impact of artificial turf materials, including microplastic pollution.
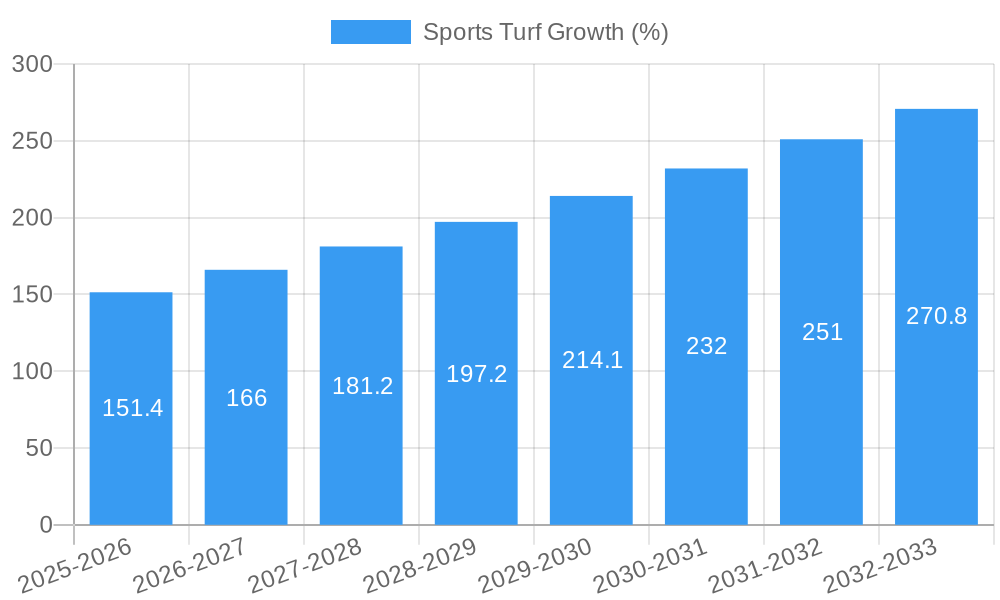
Despite these restraints, the market's positive trajectory is expected to continue throughout the forecast period (2025-2033). The compound annual growth rate (CAGR) of 7.2% indicates a steady increase in market value, suggesting significant investment opportunities for key players. This growth will likely be fueled by ongoing technological advancements, increased consumer awareness of the benefits of sports turf, and the expanding global sports landscape. Competition among established players like Shaw Sports Turf, FieldTurf, and Ten Cate is driving innovation and affordability, making sports turf accessible to a wider range of clients. Strategic partnerships, mergers, and acquisitions are expected to further shape the market landscape in the coming years. Geographic expansion, particularly in regions with burgeoning sports infrastructure development, represents a crucial area for future growth.
Sports Turf Market Report: A Comprehensive Analysis (2019-2033)
This insightful report provides a comprehensive analysis of the global sports turf market, projecting a market valuation exceeding $XX million by 2033. The study period covers 2019-2033, with 2025 serving as both the base and estimated year, and a forecast period of 2025-2033. This report delves deep into market dynamics, competitive landscapes, and future growth potential, offering invaluable insights for stakeholders across the sports turf industry. The report leverages extensive primary and secondary research to deliver accurate and actionable intelligence.
Sports Turf Market Composition & Trends
This section evaluates the market concentration, highlighting the leading players and their respective market shares. We analyze innovation catalysts, regulatory landscapes influencing material usage and installation, substitute products like natural grass, end-user profiles (e.g., professional sports, universities, municipalities), and significant M&A activities within the $XX million market. The report includes a detailed analysis of market share distribution amongst key players like Shaw Sports Turf, FieldTurf, and Hellas Construction. We also quantify M&A deal values over the historical period (2019-2024), revealing trends in industry consolidation. Expected total M&A value during the study period is estimated to be $XX million.
- Market Concentration: Analysis of market share held by top 5 players, indicating high/low concentration.
- Innovation Catalysts: Discussion of technological advancements driving market growth (e.g., improved durability, enhanced playing performance).
- Regulatory Landscape: Overview of key regulations affecting material safety and environmental impact.
- Substitute Products: Comparative analysis of synthetic turf vs. natural grass, considering costs and environmental factors.
- End-User Profiles: Detailed segmentation by end-user type, highlighting growth potential in each segment.
- M&A Activity: Review of significant mergers and acquisitions, providing deal values and strategic implications.
Sports Turf Industry Evolution
This section analyzes the evolution of the sports turf industry from 2019 to 2024, projecting trajectories to 2033. We explore the significant market growth from $XX million in 2019 to an estimated $XX million in 2025, driven by factors such as increasing investments in sports infrastructure, rising popularity of various sports, and technological advancements resulting in superior product performance and durability. The report further details technological advancements like improved fiber types, infill materials, and innovative drainage systems, quantifying their adoption rates and impact on market growth. We also analyze shifting consumer demands, including preferences for sustainable and environmentally friendly options, influencing product development and market strategies. The projected Compound Annual Growth Rate (CAGR) for the forecast period (2025-2033) is estimated at XX%.
Leading Regions, Countries, or Segments in Sports Turf
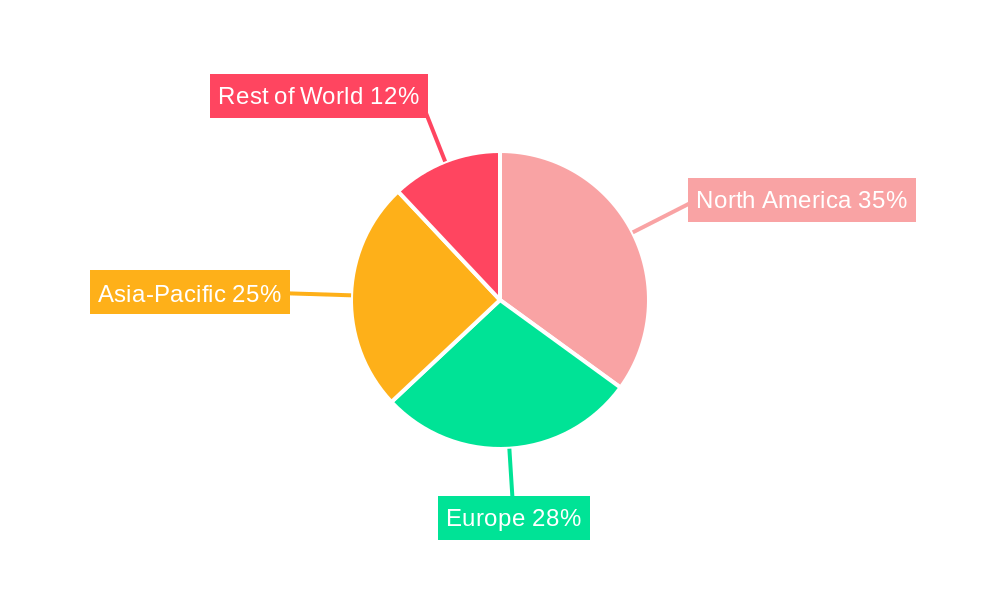
This section identifies the leading regions, countries, or segments dominating the global sports turf market. North America is currently projected to lead the market due to significant investments in sports infrastructure and a high adoption rate of synthetic turf.
- Key Drivers (North America):
- High levels of investment in sports facilities at all levels.
- Strong regulatory support for sustainable sports infrastructure development.
- Increasing preference for synthetic turf due to its cost-effectiveness and performance advantages.
- Dominance Factors (North America): Detailed analysis of factors like high disposable income, favorable climate conditions for installation and usage, and established supply chains. We discuss similar trends in other key regions such as Europe and Asia-Pacific, highlighting regional differences in growth drivers.
Sports Turf Product Innovations
This section showcases the latest product innovations, highlighting advancements in fiber technology, infill materials, and surface textures. This leads to improved durability, enhanced playing performance, and reduced environmental impact. New products offering improved shock absorption and reduced heat retention are reshaping market dynamics. Key innovations such as improved drainage systems and sustainable infill materials are increasing the adoption rates of synthetic turf.
Propelling Factors for Sports Turf Growth
Several factors contribute to the growth of the sports turf market. Technological advancements, including the development of more durable and sustainable products, are a major driver. Economic factors, such as increased investment in sports infrastructure, also play a crucial role. Furthermore, supportive regulations promoting the use of synthetic turf in certain applications accelerate market expansion.
Obstacles in the Sports Turf Market
Despite significant growth potential, the sports turf market faces challenges. Regulatory hurdles related to material safety and environmental concerns can impact market expansion. Supply chain disruptions can affect the availability of raw materials and components, impacting production and delivery timelines. Intense competition among numerous established and emerging players also presents a significant barrier. These factors collectively are projected to impact market growth by an estimated XX% during the forecast period.
Future Opportunities in Sports Turf
The sports turf market presents several promising future opportunities. Expanding into new geographical markets, particularly in developing economies, offers significant potential. The development of new technologies, such as advanced surface materials and innovative infill solutions, will further drive market growth. Emerging trends such as increased demand for sustainable and environmentally friendly options create opportunities for environmentally conscious products.
Major Players in the Sports Turf Ecosystem
- Shaw Sports Turf
- Ten Cate
- Hellas Construction
- FieldTurf
- SportGroup Holding
- ACT USA Sports
- Controlled Products
- Sprinturf
- CoCreation Grass
- Domo Sports Grass
- TurfStore
- Global Syn-Turf, Inc.
- DuPont
- Challenger Industries
- Mondo S.p.A.
- Polytan GmbH
- Sports Field Holdings
- Taishan
- ForestGrass
Key Developments in Sports Turf Industry
- 2022 Q4: Shaw Sports Turf launches a new line of sustainable turf products.
- 2023 Q1: Hellas Construction acquires a smaller regional competitor.
- 2023 Q2: FieldTurf announces a significant investment in R&D for improved infill materials.
- (Add further specific developments with dates as they become available)
Strategic Sports Turf Market Forecast
The global sports turf market is poised for robust growth over the forecast period (2025-2033), driven by sustained investment in sports infrastructure, technological advancements leading to superior product performance, and increasing awareness of environmental sustainability. The market is expected to continue its expansion, creating lucrative opportunities for established and emerging players alike. The projected market value exceeding $XX million by 2033 underscores the significant potential for continued growth and innovation within this dynamic sector.
Sports Turf Segmentation
-
1. Application
- 1.1. Football Stadium
- 1.2. Baseball Stadium
- 1.3. Tennis and Paddle Stadium
- 1.4. Multisport Stadium
- 1.5. American Football
- 1.6. Others
-
2. Types
- 2.1. PE Sports Turf
- 2.2. PP Sports Turf
- 2.3. Nylon Sports Turf
- 2.4. Others
Sports Turf Segmentation By Geography
-
1. North America
- 1.1. United States
- 1.2. Canada
- 1.3. Mexico
-
2. South America
- 2.1. Brazil
- 2.2. Argentina
- 2.3. Rest of South America
-
3. Europe
- 3.1. United Kingdom
- 3.2. Germany
- 3.3. France
- 3.4. Italy
- 3.5. Spain
- 3.6. Russia
- 3.7. Benelux
- 3.8. Nordics
- 3.9. Rest of Europe
-
4. Middle East & Africa
- 4.1. Turkey
- 4.2. Israel
- 4.3. GCC
- 4.4. North Africa
- 4.5. South Africa
- 4.6. Rest of Middle East & Africa
-
5. Asia Pacific
- 5.1. China
- 5.2. India
- 5.3. Japan
- 5.4. South Korea
- 5.5. ASEAN
- 5.6. Oceania
- 5.7. Rest of Asia Pacific
Sports Turf REPORT HIGHLIGHTS
| Aspects | Details |
|---|---|
| Study Period | 2019-2033 |
| Base Year | 2024 |
| Estimated Year | 2025 |
| Forecast Period | 2025-2033 |
| Historical Period | 2019-2024 |
| Growth Rate | CAGR of 7.2% from 2019-2033 |
| Segmentation |
|
Table of Contents
- 1. Introduction
- 1.1. Research Scope
- 1.2. Market Segmentation
- 1.3. Research Methodology
- 1.4. Definitions and Assumptions
- 2. Executive Summary
- 2.1. Introduction
- 3. Market Dynamics
- 3.1. Introduction
- 3.2. Market Drivers
- 3.3. Market Restrains
- 3.4. Market Trends
- 4. Market Factor Analysis
- 4.1. Porters Five Forces
- 4.2. Supply/Value Chain
- 4.3. PESTEL analysis
- 4.4. Market Entropy
- 4.5. Patent/Trademark Analysis
- 5. Global Sports Turf Analysis, Insights and Forecast, 2019-2031
- 5.1. Market Analysis, Insights and Forecast - by Application
- 5.1.1. Football Stadium
- 5.1.2. Baseball Stadium
- 5.1.3. Tennis and Paddle Stadium
- 5.1.4. Multisport Stadium
- 5.1.5. American Football
- 5.1.6. Others
- 5.2. Market Analysis, Insights and Forecast - by Types
- 5.2.1. PE Sports Turf
- 5.2.2. PP Sports Turf
- 5.2.3. Nylon Sports Turf
- 5.2.4. Others
- 5.3. Market Analysis, Insights and Forecast - by Region
- 5.3.1. North America
- 5.3.2. South America
- 5.3.3. Europe
- 5.3.4. Middle East & Africa
- 5.3.5. Asia Pacific
- 5.1. Market Analysis, Insights and Forecast - by Application
- 6. North America Sports Turf Analysis, Insights and Forecast, 2019-2031
- 6.1. Market Analysis, Insights and Forecast - by Application
- 6.1.1. Football Stadium
- 6.1.2. Baseball Stadium
- 6.1.3. Tennis and Paddle Stadium
- 6.1.4. Multisport Stadium
- 6.1.5. American Football
- 6.1.6. Others
- 6.2. Market Analysis, Insights and Forecast - by Types
- 6.2.1. PE Sports Turf
- 6.2.2. PP Sports Turf
- 6.2.3. Nylon Sports Turf
- 6.2.4. Others
- 6.1. Market Analysis, Insights and Forecast - by Application
- 7. South America Sports Turf Analysis, Insights and Forecast, 2019-2031
- 7.1. Market Analysis, Insights and Forecast - by Application
- 7.1.1. Football Stadium
- 7.1.2. Baseball Stadium
- 7.1.3. Tennis and Paddle Stadium
- 7.1.4. Multisport Stadium
- 7.1.5. American Football
- 7.1.6. Others
- 7.2. Market Analysis, Insights and Forecast - by Types
- 7.2.1. PE Sports Turf
- 7.2.2. PP Sports Turf
- 7.2.3. Nylon Sports Turf
- 7.2.4. Others
- 7.1. Market Analysis, Insights and Forecast - by Application
- 8. Europe Sports Turf Analysis, Insights and Forecast, 2019-2031
- 8.1. Market Analysis, Insights and Forecast - by Application
- 8.1.1. Football Stadium
- 8.1.2. Baseball Stadium
- 8.1.3. Tennis and Paddle Stadium
- 8.1.4. Multisport Stadium
- 8.1.5. American Football
- 8.1.6. Others
- 8.2. Market Analysis, Insights and Forecast - by Types
- 8.2.1. PE Sports Turf
- 8.2.2. PP Sports Turf
- 8.2.3. Nylon Sports Turf
- 8.2.4. Others
- 8.1. Market Analysis, Insights and Forecast - by Application
- 9. Middle East & Africa Sports Turf Analysis, Insights and Forecast, 2019-2031
- 9.1. Market Analysis, Insights and Forecast - by Application
- 9.1.1. Football Stadium
- 9.1.2. Baseball Stadium
- 9.1.3. Tennis and Paddle Stadium
- 9.1.4. Multisport Stadium
- 9.1.5. American Football
- 9.1.6. Others
- 9.2. Market Analysis, Insights and Forecast - by Types
- 9.2.1. PE Sports Turf
- 9.2.2. PP Sports Turf
- 9.2.3. Nylon Sports Turf
- 9.2.4. Others
- 9.1. Market Analysis, Insights and Forecast - by Application
- 10. Asia Pacific Sports Turf Analysis, Insights and Forecast, 2019-2031
- 10.1. Market Analysis, Insights and Forecast - by Application
- 10.1.1. Football Stadium
- 10.1.2. Baseball Stadium
- 10.1.3. Tennis and Paddle Stadium
- 10.1.4. Multisport Stadium
- 10.1.5. American Football
- 10.1.6. Others
- 10.2. Market Analysis, Insights and Forecast - by Types
- 10.2.1. PE Sports Turf
- 10.2.2. PP Sports Turf
- 10.2.3. Nylon Sports Turf
- 10.2.4. Others
- 10.1. Market Analysis, Insights and Forecast - by Application
- 11. Competitive Analysis
- 11.1. Global Market Share Analysis 2024
- 11.2. Company Profiles
- 11.2.1 Shaw Sports Turf
- 11.2.1.1. Overview
- 11.2.1.2. Products
- 11.2.1.3. SWOT Analysis
- 11.2.1.4. Recent Developments
- 11.2.1.5. Financials (Based on Availability)
- 11.2.2 Ten Cate
- 11.2.2.1. Overview
- 11.2.2.2. Products
- 11.2.2.3. SWOT Analysis
- 11.2.2.4. Recent Developments
- 11.2.2.5. Financials (Based on Availability)
- 11.2.3 Hellas Construction
- 11.2.3.1. Overview
- 11.2.3.2. Products
- 11.2.3.3. SWOT Analysis
- 11.2.3.4. Recent Developments
- 11.2.3.5. Financials (Based on Availability)
- 11.2.4 FieldTurf
- 11.2.4.1. Overview
- 11.2.4.2. Products
- 11.2.4.3. SWOT Analysis
- 11.2.4.4. Recent Developments
- 11.2.4.5. Financials (Based on Availability)
- 11.2.5 SportGroup Holding
- 11.2.5.1. Overview
- 11.2.5.2. Products
- 11.2.5.3. SWOT Analysis
- 11.2.5.4. Recent Developments
- 11.2.5.5. Financials (Based on Availability)
- 11.2.6 ACT USA Sports
- 11.2.6.1. Overview
- 11.2.6.2. Products
- 11.2.6.3. SWOT Analysis
- 11.2.6.4. Recent Developments
- 11.2.6.5. Financials (Based on Availability)
- 11.2.7 Controlled Products
- 11.2.7.1. Overview
- 11.2.7.2. Products
- 11.2.7.3. SWOT Analysis
- 11.2.7.4. Recent Developments
- 11.2.7.5. Financials (Based on Availability)
- 11.2.8 Sprinturf
- 11.2.8.1. Overview
- 11.2.8.2. Products
- 11.2.8.3. SWOT Analysis
- 11.2.8.4. Recent Developments
- 11.2.8.5. Financials (Based on Availability)
- 11.2.9 CoCreation Grass
- 11.2.9.1. Overview
- 11.2.9.2. Products
- 11.2.9.3. SWOT Analysis
- 11.2.9.4. Recent Developments
- 11.2.9.5. Financials (Based on Availability)
- 11.2.10 Domo Sports Grass
- 11.2.10.1. Overview
- 11.2.10.2. Products
- 11.2.10.3. SWOT Analysis
- 11.2.10.4. Recent Developments
- 11.2.10.5. Financials (Based on Availability)
- 11.2.11 TurfStore
- 11.2.11.1. Overview
- 11.2.11.2. Products
- 11.2.11.3. SWOT Analysis
- 11.2.11.4. Recent Developments
- 11.2.11.5. Financials (Based on Availability)
- 11.2.12 Global Syn-Turf
- 11.2.12.1. Overview
- 11.2.12.2. Products
- 11.2.12.3. SWOT Analysis
- 11.2.12.4. Recent Developments
- 11.2.12.5. Financials (Based on Availability)
- 11.2.13 Inc.
- 11.2.13.1. Overview
- 11.2.13.2. Products
- 11.2.13.3. SWOT Analysis
- 11.2.13.4. Recent Developments
- 11.2.13.5. Financials (Based on Availability)
- 11.2.14 DuPont
- 11.2.14.1. Overview
- 11.2.14.2. Products
- 11.2.14.3. SWOT Analysis
- 11.2.14.4. Recent Developments
- 11.2.14.5. Financials (Based on Availability)
- 11.2.15 Challenger Industires
- 11.2.15.1. Overview
- 11.2.15.2. Products
- 11.2.15.3. SWOT Analysis
- 11.2.15.4. Recent Developments
- 11.2.15.5. Financials (Based on Availability)
- 11.2.16 Mondo S.p.A.
- 11.2.16.1. Overview
- 11.2.16.2. Products
- 11.2.16.3. SWOT Analysis
- 11.2.16.4. Recent Developments
- 11.2.16.5. Financials (Based on Availability)
- 11.2.17 Polytan GmbH
- 11.2.17.1. Overview
- 11.2.17.2. Products
- 11.2.17.3. SWOT Analysis
- 11.2.17.4. Recent Developments
- 11.2.17.5. Financials (Based on Availability)
- 11.2.18 Sports Field Holdings
- 11.2.18.1. Overview
- 11.2.18.2. Products
- 11.2.18.3. SWOT Analysis
- 11.2.18.4. Recent Developments
- 11.2.18.5. Financials (Based on Availability)
- 11.2.19 Taishan
- 11.2.19.1. Overview
- 11.2.19.2. Products
- 11.2.19.3. SWOT Analysis
- 11.2.19.4. Recent Developments
- 11.2.19.5. Financials (Based on Availability)
- 11.2.20 ForestGrass
- 11.2.20.1. Overview
- 11.2.20.2. Products
- 11.2.20.3. SWOT Analysis
- 11.2.20.4. Recent Developments
- 11.2.20.5. Financials (Based on Availability)
- 11.2.1 Shaw Sports Turf
List of Figures
- Figure 1: Global Sports Turf Revenue Breakdown (million, %) by Region 2024 & 2032
- Figure 2: North America Sports Turf Revenue (million), by Application 2024 & 2032
- Figure 3: North America Sports Turf Revenue Share (%), by Application 2024 & 2032
- Figure 4: North America Sports Turf Revenue (million), by Types 2024 & 2032
- Figure 5: North America Sports Turf Revenue Share (%), by Types 2024 & 2032
- Figure 6: North America Sports Turf Revenue (million), by Country 2024 & 2032
- Figure 7: North America Sports Turf Revenue Share (%), by Country 2024 & 2032
- Figure 8: South America Sports Turf Revenue (million), by Application 2024 & 2032
- Figure 9: South America Sports Turf Revenue Share (%), by Application 2024 & 2032
- Figure 10: South America Sports Turf Revenue (million), by Types 2024 & 2032
- Figure 11: South America Sports Turf Revenue Share (%), by Types 2024 & 2032
- Figure 12: South America Sports Turf Revenue (million), by Country 2024 & 2032
- Figure 13: South America Sports Turf Revenue Share (%), by Country 2024 & 2032
- Figure 14: Europe Sports Turf Revenue (million), by Application 2024 & 2032
- Figure 15: Europe Sports Turf Revenue Share (%), by Application 2024 & 2032
- Figure 16: Europe Sports Turf Revenue (million), by Types 2024 & 2032
- Figure 17: Europe Sports Turf Revenue Share (%), by Types 2024 & 2032
- Figure 18: Europe Sports Turf Revenue (million), by Country 2024 & 2032
- Figure 19: Europe Sports Turf Revenue Share (%), by Country 2024 & 2032
- Figure 20: Middle East & Africa Sports Turf Revenue (million), by Application 2024 & 2032
- Figure 21: Middle East & Africa Sports Turf Revenue Share (%), by Application 2024 & 2032
- Figure 22: Middle East & Africa Sports Turf Revenue (million), by Types 2024 & 2032
- Figure 23: Middle East & Africa Sports Turf Revenue Share (%), by Types 2024 & 2032
- Figure 24: Middle East & Africa Sports Turf Revenue (million), by Country 2024 & 2032
- Figure 25: Middle East & Africa Sports Turf Revenue Share (%), by Country 2024 & 2032
- Figure 26: Asia Pacific Sports Turf Revenue (million), by Application 2024 & 2032
- Figure 27: Asia Pacific Sports Turf Revenue Share (%), by Application 2024 & 2032
- Figure 28: Asia Pacific Sports Turf Revenue (million), by Types 2024 & 2032
- Figure 29: Asia Pacific Sports Turf Revenue Share (%), by Types 2024 & 2032
- Figure 30: Asia Pacific Sports Turf Revenue (million), by Country 2024 & 2032
- Figure 31: Asia Pacific Sports Turf Revenue Share (%), by Country 2024 & 2032
List of Tables
- Table 1: Global Sports Turf Revenue million Forecast, by Region 2019 & 2032
- Table 2: Global Sports Turf Revenue million Forecast, by Application 2019 & 2032
- Table 3: Global Sports Turf Revenue million Forecast, by Types 2019 & 2032
- Table 4: Global Sports Turf Revenue million Forecast, by Region 2019 & 2032
- Table 5: Global Sports Turf Revenue million Forecast, by Application 2019 & 2032
- Table 6: Global Sports Turf Revenue million Forecast, by Types 2019 & 2032
- Table 7: Global Sports Turf Revenue million Forecast, by Country 2019 & 2032
- Table 8: United States Sports Turf Revenue (million) Forecast, by Application 2019 & 2032
- Table 9: Canada Sports Turf Revenue (million) Forecast, by Application 2019 & 2032
- Table 10: Mexico Sports Turf Revenue (million) Forecast, by Application 2019 & 2032
- Table 11: Global Sports Turf Revenue million Forecast, by Application 2019 & 2032
- Table 12: Global Sports Turf Revenue million Forecast, by Types 2019 & 2032
- Table 13: Global Sports Turf Revenue million Forecast, by Country 2019 & 2032
- Table 14: Brazil Sports Turf Revenue (million) Forecast, by Application 2019 & 2032
- Table 15: Argentina Sports Turf Revenue (million) Forecast, by Application 2019 & 2032
- Table 16: Rest of South America Sports Turf Revenue (million) Forecast, by Application 2019 & 2032
- Table 17: Global Sports Turf Revenue million Forecast, by Application 2019 & 2032
- Table 18: Global Sports Turf Revenue million Forecast, by Types 2019 & 2032
- Table 19: Global Sports Turf Revenue million Forecast, by Country 2019 & 2032
- Table 20: United Kingdom Sports Turf Revenue (million) Forecast, by Application 2019 & 2032
- Table 21: Germany Sports Turf Revenue (million) Forecast, by Application 2019 & 2032
- Table 22: France Sports Turf Revenue (million) Forecast, by Application 2019 & 2032
- Table 23: Italy Sports Turf Revenue (million) Forecast, by Application 2019 & 2032
- Table 24: Spain Sports Turf Revenue (million) Forecast, by Application 2019 & 2032
- Table 25: Russia Sports Turf Revenue (million) Forecast, by Application 2019 & 2032
- Table 26: Benelux Sports Turf Revenue (million) Forecast, by Application 2019 & 2032
- Table 27: Nordics Sports Turf Revenue (million) Forecast, by Application 2019 & 2032
- Table 28: Rest of Europe Sports Turf Revenue (million) Forecast, by Application 2019 & 2032
- Table 29: Global Sports Turf Revenue million Forecast, by Application 2019 & 2032
- Table 30: Global Sports Turf Revenue million Forecast, by Types 2019 & 2032
- Table 31: Global Sports Turf Revenue million Forecast, by Country 2019 & 2032
- Table 32: Turkey Sports Turf Revenue (million) Forecast, by Application 2019 & 2032
- Table 33: Israel Sports Turf Revenue (million) Forecast, by Application 2019 & 2032
- Table 34: GCC Sports Turf Revenue (million) Forecast, by Application 2019 & 2032
- Table 35: North Africa Sports Turf Revenue (million) Forecast, by Application 2019 & 2032
- Table 36: South Africa Sports Turf Revenue (million) Forecast, by Application 2019 & 2032
- Table 37: Rest of Middle East & Africa Sports Turf Revenue (million) Forecast, by Application 2019 & 2032
- Table 38: Global Sports Turf Revenue million Forecast, by Application 2019 & 2032
- Table 39: Global Sports Turf Revenue million Forecast, by Types 2019 & 2032
- Table 40: Global Sports Turf Revenue million Forecast, by Country 2019 & 2032
- Table 41: China Sports Turf Revenue (million) Forecast, by Application 2019 & 2032
- Table 42: India Sports Turf Revenue (million) Forecast, by Application 2019 & 2032
- Table 43: Japan Sports Turf Revenue (million) Forecast, by Application 2019 & 2032
- Table 44: South Korea Sports Turf Revenue (million) Forecast, by Application 2019 & 2032
- Table 45: ASEAN Sports Turf Revenue (million) Forecast, by Application 2019 & 2032
- Table 46: Oceania Sports Turf Revenue (million) Forecast, by Application 2019 & 2032
- Table 47: Rest of Asia Pacific Sports Turf Revenue (million) Forecast, by Application 2019 & 2032
Frequently Asked Questions
1. What is the projected Compound Annual Growth Rate (CAGR) of the Sports Turf?
The projected CAGR is approximately 7.2%.
2. Which companies are prominent players in the Sports Turf?
Key companies in the market include Shaw Sports Turf, Ten Cate, Hellas Construction, FieldTurf, SportGroup Holding, ACT USA Sports, Controlled Products, Sprinturf, CoCreation Grass, Domo Sports Grass, TurfStore, Global Syn-Turf, Inc., DuPont, Challenger Industires, Mondo S.p.A., Polytan GmbH, Sports Field Holdings, Taishan, ForestGrass.
3. What are the main segments of the Sports Turf?
The market segments include Application, Types.
4. Can you provide details about the market size?
The market size is estimated to be USD 2086.2 million as of 2022.
5. What are some drivers contributing to market growth?
N/A
6. What are the notable trends driving market growth?
N/A
7. Are there any restraints impacting market growth?
N/A
8. Can you provide examples of recent developments in the market?
N/A
9. What pricing options are available for accessing the report?
Pricing options include single-user, multi-user, and enterprise licenses priced at USD 5900.00, USD 8850.00, and USD 11800.00 respectively.
10. Is the market size provided in terms of value or volume?
The market size is provided in terms of value, measured in million.
11. Are there any specific market keywords associated with the report?
Yes, the market keyword associated with the report is "Sports Turf," which aids in identifying and referencing the specific market segment covered.
12. How do I determine which pricing option suits my needs best?
The pricing options vary based on user requirements and access needs. Individual users may opt for single-user licenses, while businesses requiring broader access may choose multi-user or enterprise licenses for cost-effective access to the report.
13. Are there any additional resources or data provided in the Sports Turf report?
While the report offers comprehensive insights, it's advisable to review the specific contents or supplementary materials provided to ascertain if additional resources or data are available.
14. How can I stay updated on further developments or reports in the Sports Turf?
To stay informed about further developments, trends, and reports in the Sports Turf, consider subscribing to industry newsletters, following relevant companies and organizations, or regularly checking reputable industry news sources and publications.
Methodology
Step 1 - Identification of Relevant Samples Size from Population Database


Step 2 - Approaches for Defining Global Market Size (Value, Volume* & Price*)

Note*: In applicable scenarios
Step 3 - Data Sources
Primary Research
- Web Analytics
- Survey Reports
- Research Institute
- Latest Research Reports
- Opinion Leaders
Secondary Research
- Annual Reports
- White Paper
- Latest Press Release
- Industry Association
- Paid Database
- Investor Presentations

Step 4 - Data Triangulation
Involves using different sources of information in order to increase the validity of a study
These sources are likely to be stakeholders in a program - participants, other researchers, program staff, other community members, and so on.
Then we put all data in single framework & apply various statistical tools to find out the dynamic on the market.
During the analysis stage, feedback from the stakeholder groups would be compared to determine areas of agreement as well as areas of divergence
