

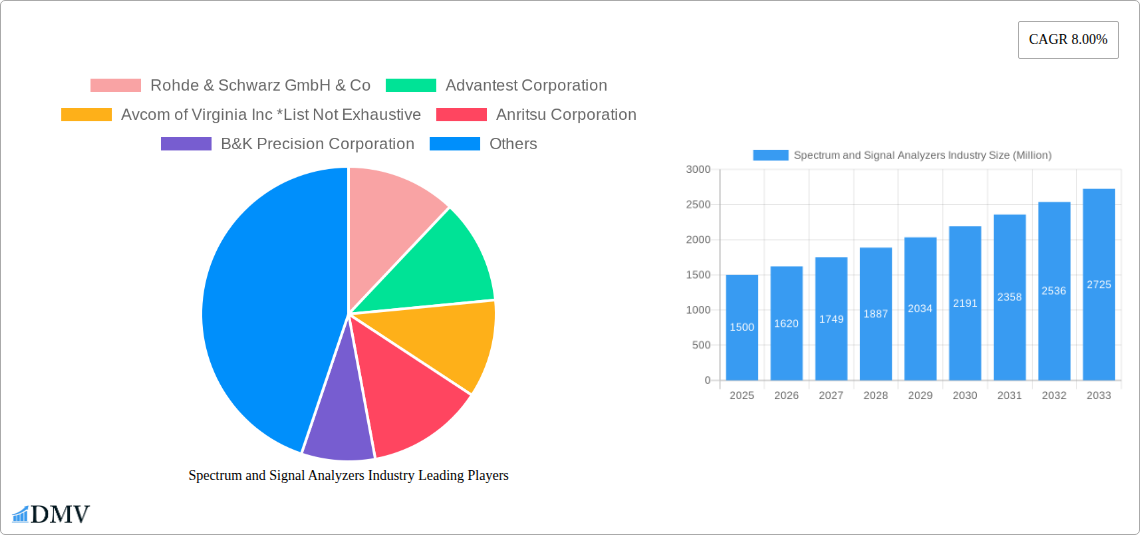
Key Insights
The Spectrum and Signal Analyzers market is experiencing robust growth, driven by the increasing demand for advanced testing and measurement solutions across diverse sectors. The market's Compound Annual Growth Rate (CAGR) of 8% from 2019 to 2033 indicates a significant expansion, projected to reach a substantial market size. Key drivers include the proliferation of 5G and other wireless technologies, necessitating rigorous testing for compliance and performance optimization. The automotive industry's shift towards autonomous vehicles and advanced driver-assistance systems (ADAS) is also fueling demand, as these technologies rely heavily on precise signal analysis for safety and functionality. Furthermore, advancements in aerospace and defense technologies, coupled with the growing need for reliable communication and navigation systems, are contributing significantly to market growth. The market is segmented by frequency range (less than 6 GHz, 6-18 GHz, and more than 18 GHz), reflecting the varying needs of different applications. Similarly, end-user industries such as IT & telecommunications, automotive, aerospace & defense, and healthcare each present unique opportunities and growth trajectories. Competition is fierce among established players like Rohde & Schwarz, Advantest, and Keysight Technologies, driving innovation and price competitiveness.
The forecast period (2025-2033) promises continued expansion, with the growth trajectory likely influenced by technological advancements in signal processing, miniaturization of devices, and the increasing integration of artificial intelligence (AI) in testing methodologies. While regulatory changes and economic fluctuations might pose challenges, the overall outlook remains positive. Specific regional growth rates will vary, with North America and Asia Pacific expected to lead, given their robust technological infrastructure and significant investments in research and development. The market's success depends on addressing emerging challenges, such as the complexities of testing millimeter-wave technologies and the need for cost-effective solutions that meet the growing demands of high-volume manufacturing. Industry consolidation and strategic partnerships will also play a crucial role in shaping the future landscape of the spectrum and signal analyzers market.
Spectrum and Signal Analyzers Industry Market Composition & Trends
This comprehensive report analyzes the Spectrum and Signal Analyzers market, providing a detailed overview of its composition and key trends from 2019 to 2033. The study period covers the historical period (2019-2024), the base year (2025), and the forecast period (2025-2033). The market is characterized by a moderately concentrated competitive landscape with key players like Rohde & Schwarz GmbH & Co, Advantest Corporation, and Keysight Technologies Inc. holding significant market share. However, the presence of numerous smaller players ensures a dynamic market. The report delves into market share distribution among these players, revealing the competitive intensity and identifying potential shifts in dominance. We also analyze the impact of mergers and acquisitions (M&A), including deal values (in Millions) where available, illustrating their role in shaping market structure and technological innovation. Innovation is driven by advancements in RF technology, higher frequency demands (5G, etc.), and the increasing need for precise signal analysis across diverse industries. Regulatory landscapes, particularly concerning spectrum allocation and electromagnetic compatibility, significantly impact market growth. The report identifies substitute products and their influence on the market, alongside a detailed profile of end-users across various sectors, further illuminating market dynamics. The estimated market value for 2025 is xx Million, projected to reach xx Million by 2033.
- Market Concentration: Moderately concentrated, with top players holding xx% of market share in 2025.
- Innovation Catalysts: Advancements in RF technology, demand for higher frequency analysis (5G and beyond), increasing need for precise signal analysis.
- Regulatory Landscape: Stringent regulations regarding spectrum allocation and electromagnetic compatibility influence market growth.
- Substitute Products: Impact of alternative technologies on market share analyzed.
- M&A Activities: Analysis of significant M&A deals (xx Million in total deal value from 2019-2024) and their implications on market consolidation.
Spectrum and Signal Analyzers Industry Industry Evolution
The Spectrum and Signal Analyzers market has experienced significant evolution over the past few years, driven by technological leaps, changing consumer demands, and expansion into new applications. From 2019 to 2024, the market exhibited a Compound Annual Growth Rate (CAGR) of xx%, with the IT & Telecommunication sector being a primary growth driver. The increasing adoption of 5G and other high-frequency communication technologies fuels demand for higher-performance analyzers capable of handling wider bandwidths and higher frequencies. The automotive industry's increasing reliance on advanced driver-assistance systems (ADAS) and autonomous driving technologies is another significant factor. This necessitates highly accurate and precise signal analysis for the reliable functioning of these complex systems. The aerospace and defense sectors, with their stringent quality and performance requirements, also significantly contribute to market growth. Technological advancements, such as the incorporation of higher dynamic range, improved phase distortion, and the integration of real-time capabilities in modern spectrum analyzers, are driving product innovation and market expansion. The market is expected to maintain its growth trajectory, with a projected CAGR of xx% from 2025 to 2033, driven by continued technological advancements, growing adoption in emerging end-user industries, and the increasing sophistication of wireless communication. Adoption metrics across different segments are analyzed, illustrating the varying levels of technology penetration and the drivers behind market share shifts.
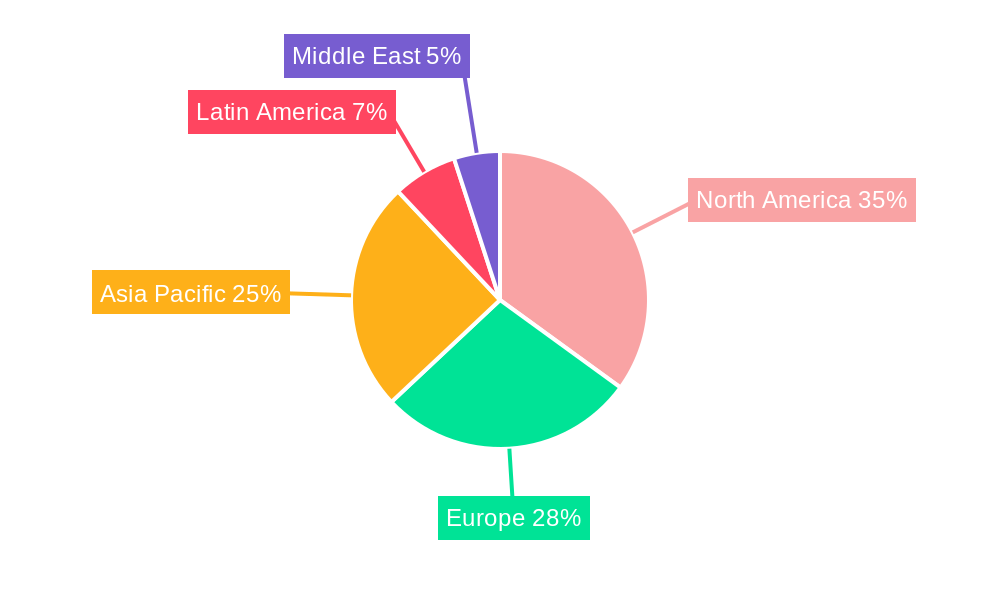
Leading Regions, Countries, or Segments in Spectrum and Signal Analyzers Industry
The North American region currently holds the largest market share in the spectrum and signal analyzers industry, driven primarily by substantial investments in research and development, a robust technological infrastructure, and the high concentration of key players in the region. However, the Asia-Pacific region is projected to witness the highest growth rate during the forecast period, fueled by the booming telecommunications sector and increased manufacturing activities in countries like China and South Korea.
By Frequency Range:
- Less than 6 GHz: Remains a dominant segment due to the widespread adoption of existing wireless technologies. Growth is steady but less dramatic compared to higher-frequency segments. Key drivers include continued advancements and cost optimization within this established sector.
- 6-18 GHz: Experiencing rapid growth fueled by the expansion of 5G networks and satellite communication systems. Significant investments and regulatory support are major drivers for this segment.
- More than 18 GHz: Shows considerable potential but remains a relatively smaller segment due to the nascent stage of certain high-frequency technologies (like mmWave). However, potential for future growth is high, especially with advancements in 6G infrastructure and other high-frequency applications.
By End-user Industry:
- IT & Telecommunication: Largest segment, driven by extensive R&D, new communication technologies (5G, 6G), and ongoing infrastructure improvements. Strong regulatory support further bolsters market growth within this sector.
- Automotive: Rapid growth due to increasing adoption of ADAS and autonomous driving technologies. The trend towards connected vehicles also boosts market demand significantly.
- Aerospace & Defense: Consistent growth driven by stringent quality and performance requirements in this sector. High levels of investment in defense modernization are a critical driver.
- Healthcare: A smaller but growing segment, with applications in medical imaging and other specialized medical equipment.
- Other End-user Industries: A diverse range of applications, including industrial automation and scientific research, contributes to consistent market demand.
Spectrum and Signal Analyzers Industry Product Innovations
Recent years have witnessed significant advancements in spectrum and signal analyzers. Key innovations include the integration of real-time signal processing capabilities for improved speed and accuracy, wider frequency ranges to accommodate higher-frequency communication technologies, and enhanced dynamic range for improved sensitivity and signal clarity. The introduction of software-defined radios (SDRs) provides greater flexibility and adaptability to evolving needs. Furthermore, improvements in user interface design, incorporating intuitive software and data visualization tools, have enhanced ease of use and improved user experience. These innovations, combined with optimized performance metrics, are driving market growth by providing more efficient and versatile analysis capabilities across various industries.
Propelling Factors for Spectrum and Signal Analyzers Industry Growth
The growth of the spectrum and signal analyzers market is propelled by several key factors. Technological advancements, especially in high-frequency technologies like 5G and beyond, necessitate the development of advanced analyzers capable of handling wider bandwidths and higher frequencies. The increasing demand for precise and accurate signal analysis across various industries, including telecommunications, automotive, aerospace, and healthcare, further contributes to market growth. Government regulations and standards, like those related to spectrum allocation and electromagnetic compatibility, play a significant role in driving demand for compliant and high-performance testing equipment. Economic factors, such as increased R&D spending and investment in infrastructure development, contribute to higher market volumes.
Obstacles in the Spectrum and Signal Analyzers Industry Market
Several factors pose challenges to the spectrum and signal analyzers market. Regulatory hurdles and evolving compliance standards can lead to increased costs and complexities for manufacturers and users. Supply chain disruptions, particularly for specialized components, may affect the availability of analyzers and increase prices. Intense competition among established players and the emergence of new entrants further complicates market dynamics, putting pressure on profit margins. These factors create uncertainties, demanding strategic adaptation and risk management from stakeholders. A predicted xx% decline in production output due to xx (e.g., material scarcity) in 2024 highlights the importance of mitigating supply chain risks.
Future Opportunities in Spectrum and Signal Analyzers Industry
The future of the spectrum and signal analyzers market holds significant opportunities. The emerging field of 6G and related high-frequency technologies will drive demand for advanced analyzers with extended frequency ranges and increased processing power. The growth of IoT (Internet of Things) and connected devices will create a substantial need for efficient and cost-effective signal analysis solutions. Expanding applications in fields like autonomous vehicles, precision medicine, and renewable energy provide new growth avenues. The development of more intelligent and AI-powered analyzers with advanced data analytics capabilities will also reshape the industry.
Major Players in the Spectrum and Signal Analyzers Industry Ecosystem
- Rohde & Schwarz GmbH & Co
- Advantest Corporation
- Avcom of Virginia Inc
- Anritsu Corporation
- B&K Precision Corporation
- National Instruments Corporation
- LP Technologies Inc
- Keysight Technologies Inc
- Yokogawa Electric Corporation
- Teledyne Lecroy Inc
- Stanford Research Systems Inc
Key Developments in Spectrum and Signal Analyzers Industry Industry
- August 2022: Yokogawa introduced the AQ6375E and AQ6376E optical spectrum analyzers, expanding capabilities in optical device innovation and production.
- June 2021: Signal Hound launched the SM435B 43.5 GHz RF spectrum analyzer and monitor receiver, broadening its reach into 5G, aerospace, and military applications.
- June 2021: Signal Hound released the BB60D 6 GHz real-time spectrum analyzer, boasting a 10dB higher dynamic range and improved phase distortion.
Strategic Spectrum and Signal Analyzers Industry Market Forecast
The spectrum and signal analyzers market is poised for robust growth, driven by several key factors. Technological advancements in higher-frequency communications (5G, 6G), the rise of the IoT, and the increasing demand for precise signal analysis across various industries will propel market expansion. New applications in emerging sectors like autonomous vehicles and precision medicine will contribute to significant growth. Continuous innovation in analyzer technology, such as the incorporation of AI and machine learning capabilities, will further enhance performance and expand market opportunities. The market's projected CAGR of xx% through 2033 underscores the considerable market potential.
Spectrum and Signal Analyzers Industry Segmentation
-
1. Frequency Range
- 1.1. Less than 6 GHz
- 1.2. 6-18 GHz
- 1.3. More than 18 GHz
-
2. End-user Industry
- 2.1. IT & Telecommunication
- 2.2. Automotive
- 2.3. Aerospace & Defense
- 2.4. Healthcare
- 2.5. Other End-user Industries
Spectrum and Signal Analyzers Industry Segmentation By Geography
- 1. North America
- 2. Europe
- 3. Asia Pacific
- 4. Latin America
- 5. Middle East
Spectrum and Signal Analyzers Industry REPORT HIGHLIGHTS
| Aspects | Details |
|---|---|
| Study Period | 2019-2033 |
| Base Year | 2024 |
| Estimated Year | 2025 |
| Forecast Period | 2025-2033 |
| Historical Period | 2019-2024 |
| Growth Rate | CAGR of 8.00% from 2019-2033 |
| Segmentation |
|
Table of Contents
- 1. Introduction
- 1.1. Research Scope
- 1.2. Market Segmentation
- 1.3. Research Methodology
- 1.4. Definitions and Assumptions
- 2. Executive Summary
- 2.1. Introduction
- 3. Market Dynamics
- 3.1. Introduction
- 3.2. Market Drivers
- 3.2.1. Growing Demand for Spectrum Analyzers With Multi-Tasking Capabilities; Technological Advancement Leading to Innovation in Spectrum Analyzer Offering
- 3.3. Market Restrains
- 3.3.1. Requirement of Cost-Effective Spectrum Analyzers With Maximum Features
- 3.4. Market Trends
- 3.4.1. Automotive Segment is Expected to Witness Significant Growth
- 4. Market Factor Analysis
- 4.1. Porters Five Forces
- 4.2. Supply/Value Chain
- 4.3. PESTEL analysis
- 4.4. Market Entropy
- 4.5. Patent/Trademark Analysis
- 5. Global Spectrum and Signal Analyzers Industry Analysis, Insights and Forecast, 2019-2031
- 5.1. Market Analysis, Insights and Forecast - by Frequency Range
- 5.1.1. Less than 6 GHz
- 5.1.2. 6-18 GHz
- 5.1.3. More than 18 GHz
- 5.2. Market Analysis, Insights and Forecast - by End-user Industry
- 5.2.1. IT & Telecommunication
- 5.2.2. Automotive
- 5.2.3. Aerospace & Defense
- 5.2.4. Healthcare
- 5.2.5. Other End-user Industries
- 5.3. Market Analysis, Insights and Forecast - by Region
- 5.3.1. North America
- 5.3.2. Europe
- 5.3.3. Asia Pacific
- 5.3.4. Latin America
- 5.3.5. Middle East
- 5.1. Market Analysis, Insights and Forecast - by Frequency Range
- 6. North America Spectrum and Signal Analyzers Industry Analysis, Insights and Forecast, 2019-2031
- 6.1. Market Analysis, Insights and Forecast - by Frequency Range
- 6.1.1. Less than 6 GHz
- 6.1.2. 6-18 GHz
- 6.1.3. More than 18 GHz
- 6.2. Market Analysis, Insights and Forecast - by End-user Industry
- 6.2.1. IT & Telecommunication
- 6.2.2. Automotive
- 6.2.3. Aerospace & Defense
- 6.2.4. Healthcare
- 6.2.5. Other End-user Industries
- 6.1. Market Analysis, Insights and Forecast - by Frequency Range
- 7. Europe Spectrum and Signal Analyzers Industry Analysis, Insights and Forecast, 2019-2031
- 7.1. Market Analysis, Insights and Forecast - by Frequency Range
- 7.1.1. Less than 6 GHz
- 7.1.2. 6-18 GHz
- 7.1.3. More than 18 GHz
- 7.2. Market Analysis, Insights and Forecast - by End-user Industry
- 7.2.1. IT & Telecommunication
- 7.2.2. Automotive
- 7.2.3. Aerospace & Defense
- 7.2.4. Healthcare
- 7.2.5. Other End-user Industries
- 7.1. Market Analysis, Insights and Forecast - by Frequency Range
- 8. Asia Pacific Spectrum and Signal Analyzers Industry Analysis, Insights and Forecast, 2019-2031
- 8.1. Market Analysis, Insights and Forecast - by Frequency Range
- 8.1.1. Less than 6 GHz
- 8.1.2. 6-18 GHz
- 8.1.3. More than 18 GHz
- 8.2. Market Analysis, Insights and Forecast - by End-user Industry
- 8.2.1. IT & Telecommunication
- 8.2.2. Automotive
- 8.2.3. Aerospace & Defense
- 8.2.4. Healthcare
- 8.2.5. Other End-user Industries
- 8.1. Market Analysis, Insights and Forecast - by Frequency Range
- 9. Latin America Spectrum and Signal Analyzers Industry Analysis, Insights and Forecast, 2019-2031
- 9.1. Market Analysis, Insights and Forecast - by Frequency Range
- 9.1.1. Less than 6 GHz
- 9.1.2. 6-18 GHz
- 9.1.3. More than 18 GHz
- 9.2. Market Analysis, Insights and Forecast - by End-user Industry
- 9.2.1. IT & Telecommunication
- 9.2.2. Automotive
- 9.2.3. Aerospace & Defense
- 9.2.4. Healthcare
- 9.2.5. Other End-user Industries
- 9.1. Market Analysis, Insights and Forecast - by Frequency Range
- 10. Middle East Spectrum and Signal Analyzers Industry Analysis, Insights and Forecast, 2019-2031
- 10.1. Market Analysis, Insights and Forecast - by Frequency Range
- 10.1.1. Less than 6 GHz
- 10.1.2. 6-18 GHz
- 10.1.3. More than 18 GHz
- 10.2. Market Analysis, Insights and Forecast - by End-user Industry
- 10.2.1. IT & Telecommunication
- 10.2.2. Automotive
- 10.2.3. Aerospace & Defense
- 10.2.4. Healthcare
- 10.2.5. Other End-user Industries
- 10.1. Market Analysis, Insights and Forecast - by Frequency Range
- 11. North America Spectrum and Signal Analyzers Industry Analysis, Insights and Forecast, 2019-2031
- 11.1. Market Analysis, Insights and Forecast - By Country/Sub-region
- 11.1.1.
- 12. Europe Spectrum and Signal Analyzers Industry Analysis, Insights and Forecast, 2019-2031
- 12.1. Market Analysis, Insights and Forecast - By Country/Sub-region
- 12.1.1.
- 13. Asia Pacific Spectrum and Signal Analyzers Industry Analysis, Insights and Forecast, 2019-2031
- 13.1. Market Analysis, Insights and Forecast - By Country/Sub-region
- 13.1.1.
- 14. Latin America Spectrum and Signal Analyzers Industry Analysis, Insights and Forecast, 2019-2031
- 14.1. Market Analysis, Insights and Forecast - By Country/Sub-region
- 14.1.1.
- 15. Middle East Spectrum and Signal Analyzers Industry Analysis, Insights and Forecast, 2019-2031
- 15.1. Market Analysis, Insights and Forecast - By Country/Sub-region
- 15.1.1.
- 16. Competitive Analysis
- 16.1. Global Market Share Analysis 2024
- 16.2. Company Profiles
- 16.2.1 Rohde & Schwarz GmbH & Co
- 16.2.1.1. Overview
- 16.2.1.2. Products
- 16.2.1.3. SWOT Analysis
- 16.2.1.4. Recent Developments
- 16.2.1.5. Financials (Based on Availability)
- 16.2.2 Advantest Corporation
- 16.2.2.1. Overview
- 16.2.2.2. Products
- 16.2.2.3. SWOT Analysis
- 16.2.2.4. Recent Developments
- 16.2.2.5. Financials (Based on Availability)
- 16.2.3 Avcom of Virginia Inc *List Not Exhaustive
- 16.2.3.1. Overview
- 16.2.3.2. Products
- 16.2.3.3. SWOT Analysis
- 16.2.3.4. Recent Developments
- 16.2.3.5. Financials (Based on Availability)
- 16.2.4 Anritsu Corporation
- 16.2.4.1. Overview
- 16.2.4.2. Products
- 16.2.4.3. SWOT Analysis
- 16.2.4.4. Recent Developments
- 16.2.4.5. Financials (Based on Availability)
- 16.2.5 B&K Precision Corporation
- 16.2.5.1. Overview
- 16.2.5.2. Products
- 16.2.5.3. SWOT Analysis
- 16.2.5.4. Recent Developments
- 16.2.5.5. Financials (Based on Availability)
- 16.2.6 National Instruments Corporation
- 16.2.6.1. Overview
- 16.2.6.2. Products
- 16.2.6.3. SWOT Analysis
- 16.2.6.4. Recent Developments
- 16.2.6.5. Financials (Based on Availability)
- 16.2.7 LP Technologies Inc
- 16.2.7.1. Overview
- 16.2.7.2. Products
- 16.2.7.3. SWOT Analysis
- 16.2.7.4. Recent Developments
- 16.2.7.5. Financials (Based on Availability)
- 16.2.8 Keysight Technologies Inc
- 16.2.8.1. Overview
- 16.2.8.2. Products
- 16.2.8.3. SWOT Analysis
- 16.2.8.4. Recent Developments
- 16.2.8.5. Financials (Based on Availability)
- 16.2.9 Yokogawa Electric Corporation
- 16.2.9.1. Overview
- 16.2.9.2. Products
- 16.2.9.3. SWOT Analysis
- 16.2.9.4. Recent Developments
- 16.2.9.5. Financials (Based on Availability)
- 16.2.10 Teledyne Lecroy Inc
- 16.2.10.1. Overview
- 16.2.10.2. Products
- 16.2.10.3. SWOT Analysis
- 16.2.10.4. Recent Developments
- 16.2.10.5. Financials (Based on Availability)
- 16.2.11 Stanford Research Systems Inc
- 16.2.11.1. Overview
- 16.2.11.2. Products
- 16.2.11.3. SWOT Analysis
- 16.2.11.4. Recent Developments
- 16.2.11.5. Financials (Based on Availability)
- 16.2.1 Rohde & Schwarz GmbH & Co
List of Figures
- Figure 1: Global Spectrum and Signal Analyzers Industry Revenue Breakdown (Million, %) by Region 2024 & 2032
- Figure 2: North America Spectrum and Signal Analyzers Industry Revenue (Million), by Country 2024 & 2032
- Figure 3: North America Spectrum and Signal Analyzers Industry Revenue Share (%), by Country 2024 & 2032
- Figure 4: Europe Spectrum and Signal Analyzers Industry Revenue (Million), by Country 2024 & 2032
- Figure 5: Europe Spectrum and Signal Analyzers Industry Revenue Share (%), by Country 2024 & 2032
- Figure 6: Asia Pacific Spectrum and Signal Analyzers Industry Revenue (Million), by Country 2024 & 2032
- Figure 7: Asia Pacific Spectrum and Signal Analyzers Industry Revenue Share (%), by Country 2024 & 2032
- Figure 8: Latin America Spectrum and Signal Analyzers Industry Revenue (Million), by Country 2024 & 2032
- Figure 9: Latin America Spectrum and Signal Analyzers Industry Revenue Share (%), by Country 2024 & 2032
- Figure 10: Middle East Spectrum and Signal Analyzers Industry Revenue (Million), by Country 2024 & 2032
- Figure 11: Middle East Spectrum and Signal Analyzers Industry Revenue Share (%), by Country 2024 & 2032
- Figure 12: North America Spectrum and Signal Analyzers Industry Revenue (Million), by Frequency Range 2024 & 2032
- Figure 13: North America Spectrum and Signal Analyzers Industry Revenue Share (%), by Frequency Range 2024 & 2032
- Figure 14: North America Spectrum and Signal Analyzers Industry Revenue (Million), by End-user Industry 2024 & 2032
- Figure 15: North America Spectrum and Signal Analyzers Industry Revenue Share (%), by End-user Industry 2024 & 2032
- Figure 16: North America Spectrum and Signal Analyzers Industry Revenue (Million), by Country 2024 & 2032
- Figure 17: North America Spectrum and Signal Analyzers Industry Revenue Share (%), by Country 2024 & 2032
- Figure 18: Europe Spectrum and Signal Analyzers Industry Revenue (Million), by Frequency Range 2024 & 2032
- Figure 19: Europe Spectrum and Signal Analyzers Industry Revenue Share (%), by Frequency Range 2024 & 2032
- Figure 20: Europe Spectrum and Signal Analyzers Industry Revenue (Million), by End-user Industry 2024 & 2032
- Figure 21: Europe Spectrum and Signal Analyzers Industry Revenue Share (%), by End-user Industry 2024 & 2032
- Figure 22: Europe Spectrum and Signal Analyzers Industry Revenue (Million), by Country 2024 & 2032
- Figure 23: Europe Spectrum and Signal Analyzers Industry Revenue Share (%), by Country 2024 & 2032
- Figure 24: Asia Pacific Spectrum and Signal Analyzers Industry Revenue (Million), by Frequency Range 2024 & 2032
- Figure 25: Asia Pacific Spectrum and Signal Analyzers Industry Revenue Share (%), by Frequency Range 2024 & 2032
- Figure 26: Asia Pacific Spectrum and Signal Analyzers Industry Revenue (Million), by End-user Industry 2024 & 2032
- Figure 27: Asia Pacific Spectrum and Signal Analyzers Industry Revenue Share (%), by End-user Industry 2024 & 2032
- Figure 28: Asia Pacific Spectrum and Signal Analyzers Industry Revenue (Million), by Country 2024 & 2032
- Figure 29: Asia Pacific Spectrum and Signal Analyzers Industry Revenue Share (%), by Country 2024 & 2032
- Figure 30: Latin America Spectrum and Signal Analyzers Industry Revenue (Million), by Frequency Range 2024 & 2032
- Figure 31: Latin America Spectrum and Signal Analyzers Industry Revenue Share (%), by Frequency Range 2024 & 2032
- Figure 32: Latin America Spectrum and Signal Analyzers Industry Revenue (Million), by End-user Industry 2024 & 2032
- Figure 33: Latin America Spectrum and Signal Analyzers Industry Revenue Share (%), by End-user Industry 2024 & 2032
- Figure 34: Latin America Spectrum and Signal Analyzers Industry Revenue (Million), by Country 2024 & 2032
- Figure 35: Latin America Spectrum and Signal Analyzers Industry Revenue Share (%), by Country 2024 & 2032
- Figure 36: Middle East Spectrum and Signal Analyzers Industry Revenue (Million), by Frequency Range 2024 & 2032
- Figure 37: Middle East Spectrum and Signal Analyzers Industry Revenue Share (%), by Frequency Range 2024 & 2032
- Figure 38: Middle East Spectrum and Signal Analyzers Industry Revenue (Million), by End-user Industry 2024 & 2032
- Figure 39: Middle East Spectrum and Signal Analyzers Industry Revenue Share (%), by End-user Industry 2024 & 2032
- Figure 40: Middle East Spectrum and Signal Analyzers Industry Revenue (Million), by Country 2024 & 2032
- Figure 41: Middle East Spectrum and Signal Analyzers Industry Revenue Share (%), by Country 2024 & 2032
List of Tables
- Table 1: Global Spectrum and Signal Analyzers Industry Revenue Million Forecast, by Region 2019 & 2032
- Table 2: Global Spectrum and Signal Analyzers Industry Revenue Million Forecast, by Frequency Range 2019 & 2032
- Table 3: Global Spectrum and Signal Analyzers Industry Revenue Million Forecast, by End-user Industry 2019 & 2032
- Table 4: Global Spectrum and Signal Analyzers Industry Revenue Million Forecast, by Region 2019 & 2032
- Table 5: Global Spectrum and Signal Analyzers Industry Revenue Million Forecast, by Country 2019 & 2032
- Table 6: Spectrum and Signal Analyzers Industry Revenue (Million) Forecast, by Application 2019 & 2032
- Table 7: Global Spectrum and Signal Analyzers Industry Revenue Million Forecast, by Country 2019 & 2032
- Table 8: Spectrum and Signal Analyzers Industry Revenue (Million) Forecast, by Application 2019 & 2032
- Table 9: Global Spectrum and Signal Analyzers Industry Revenue Million Forecast, by Country 2019 & 2032
- Table 10: Spectrum and Signal Analyzers Industry Revenue (Million) Forecast, by Application 2019 & 2032
- Table 11: Global Spectrum and Signal Analyzers Industry Revenue Million Forecast, by Country 2019 & 2032
- Table 12: Spectrum and Signal Analyzers Industry Revenue (Million) Forecast, by Application 2019 & 2032
- Table 13: Global Spectrum and Signal Analyzers Industry Revenue Million Forecast, by Country 2019 & 2032
- Table 14: Spectrum and Signal Analyzers Industry Revenue (Million) Forecast, by Application 2019 & 2032
- Table 15: Global Spectrum and Signal Analyzers Industry Revenue Million Forecast, by Frequency Range 2019 & 2032
- Table 16: Global Spectrum and Signal Analyzers Industry Revenue Million Forecast, by End-user Industry 2019 & 2032
- Table 17: Global Spectrum and Signal Analyzers Industry Revenue Million Forecast, by Country 2019 & 2032
- Table 18: Global Spectrum and Signal Analyzers Industry Revenue Million Forecast, by Frequency Range 2019 & 2032
- Table 19: Global Spectrum and Signal Analyzers Industry Revenue Million Forecast, by End-user Industry 2019 & 2032
- Table 20: Global Spectrum and Signal Analyzers Industry Revenue Million Forecast, by Country 2019 & 2032
- Table 21: Global Spectrum and Signal Analyzers Industry Revenue Million Forecast, by Frequency Range 2019 & 2032
- Table 22: Global Spectrum and Signal Analyzers Industry Revenue Million Forecast, by End-user Industry 2019 & 2032
- Table 23: Global Spectrum and Signal Analyzers Industry Revenue Million Forecast, by Country 2019 & 2032
- Table 24: Global Spectrum and Signal Analyzers Industry Revenue Million Forecast, by Frequency Range 2019 & 2032
- Table 25: Global Spectrum and Signal Analyzers Industry Revenue Million Forecast, by End-user Industry 2019 & 2032
- Table 26: Global Spectrum and Signal Analyzers Industry Revenue Million Forecast, by Country 2019 & 2032
- Table 27: Global Spectrum and Signal Analyzers Industry Revenue Million Forecast, by Frequency Range 2019 & 2032
- Table 28: Global Spectrum and Signal Analyzers Industry Revenue Million Forecast, by End-user Industry 2019 & 2032
- Table 29: Global Spectrum and Signal Analyzers Industry Revenue Million Forecast, by Country 2019 & 2032
Frequently Asked Questions
1. What is the projected Compound Annual Growth Rate (CAGR) of the Spectrum and Signal Analyzers Industry?
The projected CAGR is approximately 8.00%.
2. Which companies are prominent players in the Spectrum and Signal Analyzers Industry?
Key companies in the market include Rohde & Schwarz GmbH & Co, Advantest Corporation, Avcom of Virginia Inc *List Not Exhaustive, Anritsu Corporation, B&K Precision Corporation, National Instruments Corporation, LP Technologies Inc, Keysight Technologies Inc, Yokogawa Electric Corporation, Teledyne Lecroy Inc, Stanford Research Systems Inc.
3. What are the main segments of the Spectrum and Signal Analyzers Industry?
The market segments include Frequency Range, End-user Industry.
4. Can you provide details about the market size?
The market size is estimated to be USD XX Million as of 2022.
5. What are some drivers contributing to market growth?
Growing Demand for Spectrum Analyzers With Multi-Tasking Capabilities; Technological Advancement Leading to Innovation in Spectrum Analyzer Offering.
6. What are the notable trends driving market growth?
Automotive Segment is Expected to Witness Significant Growth.
7. Are there any restraints impacting market growth?
Requirement of Cost-Effective Spectrum Analyzers With Maximum Features.
8. Can you provide examples of recent developments in the market?
August 2022 - Yokogawa introduced two unique optical spectrum analyzers (OSAs) to address industry demand for a device that can measure a wide variety of wavelengths in order to satisfy new requirements in optical device innovation and production. The Yokogawa AQ6375E and AQ6376E were the unique grating-based OSAs with top-tier optical performance that span SWIR over 2 m & MWIR beyond 3 m.
9. What pricing options are available for accessing the report?
Pricing options include single-user, multi-user, and enterprise licenses priced at USD 4750, USD 5250, and USD 8750 respectively.
10. Is the market size provided in terms of value or volume?
The market size is provided in terms of value, measured in Million.
11. Are there any specific market keywords associated with the report?
Yes, the market keyword associated with the report is "Spectrum and Signal Analyzers Industry," which aids in identifying and referencing the specific market segment covered.
12. How do I determine which pricing option suits my needs best?
The pricing options vary based on user requirements and access needs. Individual users may opt for single-user licenses, while businesses requiring broader access may choose multi-user or enterprise licenses for cost-effective access to the report.
13. Are there any additional resources or data provided in the Spectrum and Signal Analyzers Industry report?
While the report offers comprehensive insights, it's advisable to review the specific contents or supplementary materials provided to ascertain if additional resources or data are available.
14. How can I stay updated on further developments or reports in the Spectrum and Signal Analyzers Industry?
To stay informed about further developments, trends, and reports in the Spectrum and Signal Analyzers Industry, consider subscribing to industry newsletters, following relevant companies and organizations, or regularly checking reputable industry news sources and publications.
Methodology
Step 1 - Identification of Relevant Samples Size from Population Database


Step 2 - Approaches for Defining Global Market Size (Value, Volume* & Price*)

Note*: In applicable scenarios
Step 3 - Data Sources
Primary Research
- Web Analytics
- Survey Reports
- Research Institute
- Latest Research Reports
- Opinion Leaders
Secondary Research
- Annual Reports
- White Paper
- Latest Press Release
- Industry Association
- Paid Database
- Investor Presentations

Step 4 - Data Triangulation
Involves using different sources of information in order to increase the validity of a study
These sources are likely to be stakeholders in a program - participants, other researchers, program staff, other community members, and so on.
Then we put all data in single framework & apply various statistical tools to find out the dynamic on the market.
During the analysis stage, feedback from the stakeholder groups would be compared to determine areas of agreement as well as areas of divergence
