

Key Insights
The global sonobuoy market is experiencing robust growth, driven by increasing defense budgets worldwide and the escalating demand for advanced maritime surveillance and anti-submarine warfare (ASW) capabilities. The market's Compound Annual Growth Rate (CAGR) exceeding 6.50% from 2019 to 2024 indicates a significant upward trajectory. This growth is fueled by technological advancements leading to improved sonobuoy performance, including enhanced detection ranges, improved signal processing, and the integration of more sophisticated sensors. The active sonobuoy segment dominates the market due to its superior detection capabilities compared to passive systems, although passive sonobuoys maintain relevance for specific applications requiring stealth. Commercial applications, while smaller than the defense sector, are also contributing to market expansion, driven by growing offshore oil and gas exploration and the need for enhanced maritime security. Key geographical regions such as North America and Europe currently hold substantial market share, primarily due to the concentration of defense spending and technological innovation in these regions. However, the Asia-Pacific region is poised for significant growth, driven by increasing geopolitical tensions and the expansion of naval capabilities in countries such as China and India. Market restraints include the high cost of sonobuoys and the need for specialized deployment and maintenance infrastructure.
The competitive landscape is characterized by a mix of established players like L3Harris Technologies, General Dynamics, Ultra, and Thales, alongside specialized manufacturers. These companies continuously invest in research and development to improve sonobuoy technology, incorporating features like improved durability, extended operational lifespan, and advanced data transmission capabilities. Future growth will likely depend on the continued adoption of advanced technologies such as AI-powered signal processing and the integration of sonobuoy data with broader maritime surveillance networks. The market is anticipated to maintain its growth trajectory through 2033, driven by sustained demand from both defense and commercial sectors, but with potential fluctuations tied to global political and economic factors. Further diversification into specialized applications, such as environmental monitoring and oceanographic research, may also stimulate future market expansion.
Sonobuoy Industry Market Report: 2019-2033
This comprehensive report provides a detailed analysis of the global sonobuoy industry, offering invaluable insights for stakeholders seeking to navigate this dynamic market. Covering the period from 2019 to 2033, with a base year of 2025 and a forecast period of 2025-2033, this report delivers a robust understanding of market trends, technological advancements, and future opportunities. The global market is projected to reach xx Million by 2033, presenting significant growth potential for investors and industry players alike.
Sonobuoy Industry Market Composition & Trends
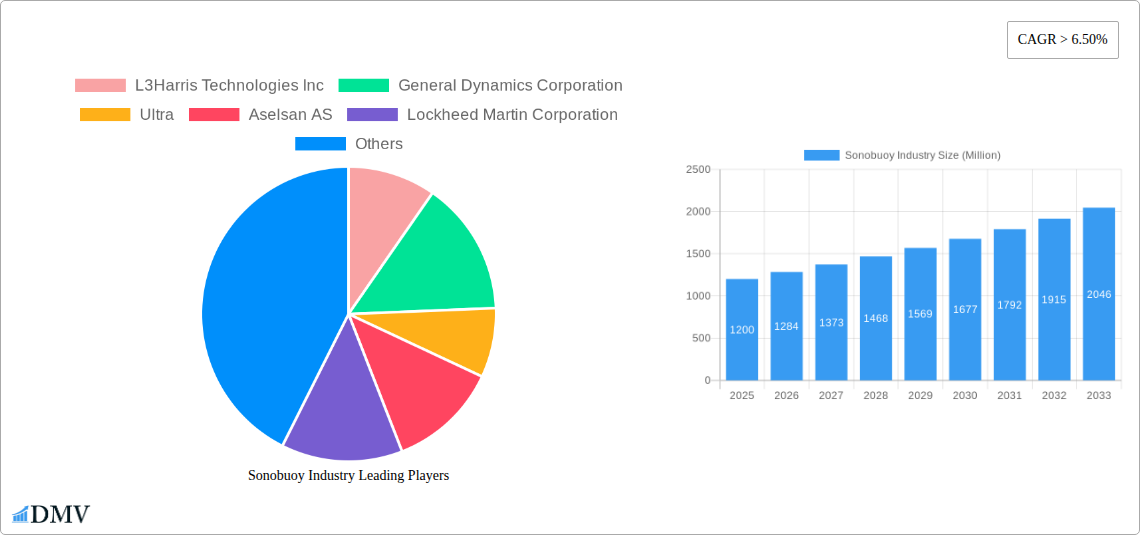
The global sonobuoy market, valued at xx Million in 2024, is characterized by moderate concentration, with key players such as L3Harris Technologies Inc, General Dynamics Corporation, Ultra, Aselsan AS, Lockheed Martin Corporation, Radixon Group, SeaLandAire Technologies Inc, Sparton, and Thales Group holding significant market share. The market share distribution is currently estimated at xx% for the top 5 players, reflecting a moderately consolidated landscape. Innovation is driven by advancements in acoustic sensor technology, signal processing, and data analytics, enhancing detection capabilities and operational efficiency. Regulatory landscapes, particularly within the defense sector, significantly impact market dynamics through procurement policies and technological standardization initiatives. Substitute technologies, such as advanced underwater surveillance systems, pose a moderate competitive threat. The end-user profile comprises primarily defense forces (navy branches globally) and commercial entities engaged in oceanographic research and surveillance. M&A activity in the sector has been moderate, with deal values averaging xx Million per transaction in the historical period, driven primarily by strategic acquisitions to enhance technological capabilities and expand market reach.
- Market Concentration: Moderately concentrated, with top 5 players holding xx% market share.
- Innovation Catalysts: Advancements in acoustic sensor technology, signal processing, and data analytics.
- Regulatory Landscape: Stringent regulations, primarily within the defense sector, influence market growth.
- Substitute Products: Advanced underwater surveillance systems pose a moderate competitive threat.
- End-User Profiles: Primarily defense forces (navies) and commercial research/surveillance entities.
- M&A Activity: Moderate activity, with average deal values of xx Million.
Sonobuoy Industry Evolution
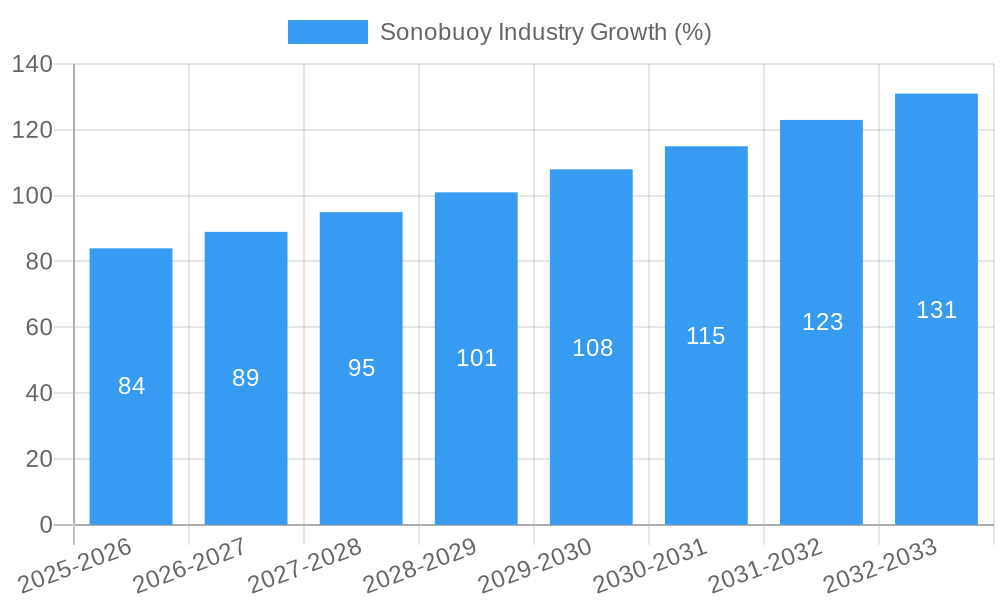
The sonobuoy market exhibits a steady growth trajectory, driven by escalating geopolitical tensions and increased demand for maritime surveillance capabilities. The historical period (2019-2024) witnessed a Compound Annual Growth Rate (CAGR) of xx%, primarily fuelled by defense spending increases and advancements in sonobuoy technology. Technological advancements, including the development of advanced digital signal processing and improved acoustic sensors, significantly enhance the performance and effectiveness of sonobuoys. This has led to increased adoption rates among defense forces, boosting market growth. Shifting consumer demands towards enhanced situational awareness and improved underwater threat detection further bolster the demand for sophisticated sonobuoys. The forecast period (2025-2033) is projected to witness a CAGR of xx%, indicating continued market expansion, fueled by continuous technological innovation, growing defense budgets, and increasing global maritime security concerns. This growth is expected to be particularly pronounced in regions experiencing escalating maritime activities and geopolitical instability. The integration of sonobuoy data with other surveillance systems, such as unmanned aerial vehicles (UAVs) and satellites, further enhances their strategic importance, driving market expansion.
Leading Regions, Countries, or Segments in Sonobuoy Industry
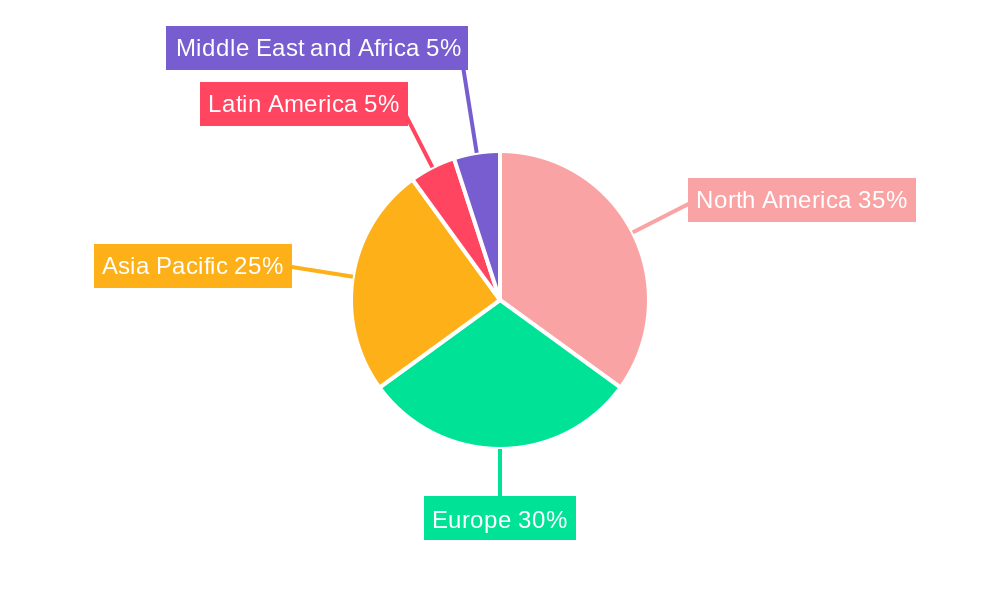
The defense segment dominates the sonobuoy market, accounting for xx% of total revenue in 2024. This dominance is largely attributed to substantial investments by various national defense forces in enhancing their anti-submarine warfare capabilities. North America and Europe are currently the leading regions for sonobuoy deployment and technological advancements, driven by robust defense budgets and a significant presence of major industry players. Active sonobuoys hold the largest segment share owing to their superior detection capabilities compared to passive systems.
- Key Drivers for Defense Segment Dominance:
- High defense spending globally.
- Enhanced anti-submarine warfare (ASW) capabilities demand.
- Technological advancements in active sonobuoys.
- Key Drivers for North America/Europe Region Dominance:
- Robust defense budgets.
- Presence of major sonobuoy manufacturers.
- Advanced technological infrastructure.
Sonobuoy Industry Product Innovations
Recent innovations in sonobuoy technology focus on enhancing detection range, improving signal processing, and integrating with advanced data fusion systems. Miniaturization efforts and the development of more energy-efficient sonobuoys have also been key areas of focus. Unique selling propositions include advanced signal processing algorithms for improved target classification and reduced false alarms, improved durability and operational life, and seamless integration with existing naval platforms and systems. These advancements significantly enhance situational awareness and improve the effectiveness of anti-submarine warfare operations.
Propelling Factors for Sonobuoy Industry Growth
Several factors drive the growth of the sonobuoy industry. Technological advancements, such as improved signal processing and miniaturization, are improving sonobuoy capabilities. Increased defense spending globally, particularly in maritime security, fuels demand for sophisticated sonobuoys. Furthermore, the growing need for underwater surveillance and the rising geopolitical tensions are propelling market growth. Government regulations and initiatives supporting maritime security also contribute to the expansion of this sector.
Obstacles in the Sonobuoy Industry Market
The sonobuoy industry faces challenges, including supply chain disruptions affecting component availability and manufacturing costs. Regulatory hurdles and stringent environmental regulations can impact product development and deployment. Intense competition from established players and emerging technologies also presents a significant obstacle. These factors can collectively impact production, delivery times, and profitability, ultimately hindering market growth.
Future Opportunities in Sonobuoy Industry
Future growth in the sonobuoy market is anticipated due to emerging markets in developing nations investing in maritime security. Advancements in artificial intelligence (AI) and machine learning (ML) for signal processing offer substantial opportunities for enhancing sonobuoy performance. Furthermore, the integration of sonobuoy data with other sensor systems for comprehensive situational awareness represents a significant opportunity for market expansion.
Major Players in the Sonobuoy Industry Ecosystem
- L3Harris Technologies Inc
- General Dynamics Corporation
- Ultra
- Aselsan AS
- Lockheed Martin Corporation
- Radixon Group
- SeaLandAire Technologies Inc
- Sparton
- Thales Group
Key Developments in Sonobuoy Industry Industry
- November 2022: UMS SKELDAR and Ultra Maritime partnered to develop an ASW sonobuoy dispensing capability using the SKELDAR V-200 UAS for the Canadian Armed Forces. This collaboration signifies a move towards unmanned ASW operations.
- November 2022: Saab AB secured a contract for the MK39 EMATT, a sonobuoy-sized training target for the US Navy. This highlights the importance of training and simulation in ASW operations.
Strategic Sonobuoy Industry Market Forecast
The sonobuoy market is poised for continued growth, driven by sustained investment in maritime security and advancements in underwater sensing technologies. New applications in commercial sectors and ongoing technological innovations promise to unlock further market potential. The integration of AI and improved data analytics will drive the adoption of smarter, more efficient sonobuoy systems. These factors will contribute to a robust growth trajectory throughout the forecast period.
Sonobuoy Industry Segmentation
- 1. Production Analysis
- 2. Consumption Analysis
- 3. Import Market Analysis (Value & Volume)
- 4. Export Market Analysis (Value & Volume)
- 5. Price Trend Analysis
Sonobuoy Industry Segmentation By Geography
-
1. North America
- 1.1. United States
- 1.2. Canada
- 1.3. Mexico
-
2. South America
- 2.1. Brazil
- 2.2. Argentina
- 2.3. Rest of South America
-
3. Europe
- 3.1. United Kingdom
- 3.2. Germany
- 3.3. France
- 3.4. Italy
- 3.5. Spain
- 3.6. Russia
- 3.7. Benelux
- 3.8. Nordics
- 3.9. Rest of Europe
-
4. Middle East & Africa
- 4.1. Turkey
- 4.2. Israel
- 4.3. GCC
- 4.4. North Africa
- 4.5. South Africa
- 4.6. Rest of Middle East & Africa
-
5. Asia Pacific
- 5.1. China
- 5.2. India
- 5.3. Japan
- 5.4. South Korea
- 5.5. ASEAN
- 5.6. Oceania
- 5.7. Rest of Asia Pacific
Sonobuoy Industry REPORT HIGHLIGHTS
| Aspects | Details |
|---|---|
| Study Period | 2019-2033 |
| Base Year | 2024 |
| Estimated Year | 2025 |
| Forecast Period | 2025-2033 |
| Historical Period | 2019-2024 |
| Growth Rate | CAGR of > 6.50% from 2019-2033 |
| Segmentation |
|
Table of Contents
- 1. Introduction
- 1.1. Research Scope
- 1.2. Market Segmentation
- 1.3. Research Methodology
- 1.4. Definitions and Assumptions
- 2. Executive Summary
- 2.1. Introduction
- 3. Market Dynamics
- 3.1. Introduction
- 3.2. Market Drivers
- 3.2.1. ; Increased Seaborne Threats And Ambiguous Maritime Security Policies; Increasing Adoption Of Security Technologies In Bric Countries
- 3.3. Market Restrains
- 3.3.1. ; High Risk Rate In Ungoverned Zones; Unstructured Security Standards And Technologies
- 3.4. Market Trends
- 3.4.1. The Defense Segment Will Showcase Highest Growth During the Forecast Period
- 4. Market Factor Analysis
- 4.1. Porters Five Forces
- 4.2. Supply/Value Chain
- 4.3. PESTEL analysis
- 4.4. Market Entropy
- 4.5. Patent/Trademark Analysis
- 5. Global Sonobuoy Industry Analysis, Insights and Forecast, 2019-2031
- 5.1. Market Analysis, Insights and Forecast - by Production Analysis
- 5.2. Market Analysis, Insights and Forecast - by Consumption Analysis
- 5.3. Market Analysis, Insights and Forecast - by Import Market Analysis (Value & Volume)
- 5.4. Market Analysis, Insights and Forecast - by Export Market Analysis (Value & Volume)
- 5.5. Market Analysis, Insights and Forecast - by Price Trend Analysis
- 5.6. Market Analysis, Insights and Forecast - by Region
- 5.6.1. North America
- 5.6.2. South America
- 5.6.3. Europe
- 5.6.4. Middle East & Africa
- 5.6.5. Asia Pacific
- 5.1. Market Analysis, Insights and Forecast - by Production Analysis
- 6. North America Sonobuoy Industry Analysis, Insights and Forecast, 2019-2031
- 6.1. Market Analysis, Insights and Forecast - by Production Analysis
- 6.2. Market Analysis, Insights and Forecast - by Consumption Analysis
- 6.3. Market Analysis, Insights and Forecast - by Import Market Analysis (Value & Volume)
- 6.4. Market Analysis, Insights and Forecast - by Export Market Analysis (Value & Volume)
- 6.5. Market Analysis, Insights and Forecast - by Price Trend Analysis
- 6.1. Market Analysis, Insights and Forecast - by Production Analysis
- 7. South America Sonobuoy Industry Analysis, Insights and Forecast, 2019-2031
- 7.1. Market Analysis, Insights and Forecast - by Production Analysis
- 7.2. Market Analysis, Insights and Forecast - by Consumption Analysis
- 7.3. Market Analysis, Insights and Forecast - by Import Market Analysis (Value & Volume)
- 7.4. Market Analysis, Insights and Forecast - by Export Market Analysis (Value & Volume)
- 7.5. Market Analysis, Insights and Forecast - by Price Trend Analysis
- 7.1. Market Analysis, Insights and Forecast - by Production Analysis
- 8. Europe Sonobuoy Industry Analysis, Insights and Forecast, 2019-2031
- 8.1. Market Analysis, Insights and Forecast - by Production Analysis
- 8.2. Market Analysis, Insights and Forecast - by Consumption Analysis
- 8.3. Market Analysis, Insights and Forecast - by Import Market Analysis (Value & Volume)
- 8.4. Market Analysis, Insights and Forecast - by Export Market Analysis (Value & Volume)
- 8.5. Market Analysis, Insights and Forecast - by Price Trend Analysis
- 8.1. Market Analysis, Insights and Forecast - by Production Analysis
- 9. Middle East & Africa Sonobuoy Industry Analysis, Insights and Forecast, 2019-2031
- 9.1. Market Analysis, Insights and Forecast - by Production Analysis
- 9.2. Market Analysis, Insights and Forecast - by Consumption Analysis
- 9.3. Market Analysis, Insights and Forecast - by Import Market Analysis (Value & Volume)
- 9.4. Market Analysis, Insights and Forecast - by Export Market Analysis (Value & Volume)
- 9.5. Market Analysis, Insights and Forecast - by Price Trend Analysis
- 9.1. Market Analysis, Insights and Forecast - by Production Analysis
- 10. Asia Pacific Sonobuoy Industry Analysis, Insights and Forecast, 2019-2031
- 10.1. Market Analysis, Insights and Forecast - by Production Analysis
- 10.2. Market Analysis, Insights and Forecast - by Consumption Analysis
- 10.3. Market Analysis, Insights and Forecast - by Import Market Analysis (Value & Volume)
- 10.4. Market Analysis, Insights and Forecast - by Export Market Analysis (Value & Volume)
- 10.5. Market Analysis, Insights and Forecast - by Price Trend Analysis
- 10.1. Market Analysis, Insights and Forecast - by Production Analysis
- 11. North America Sonobuoy Industry Analysis, Insights and Forecast, 2019-2031
- 11.1. Market Analysis, Insights and Forecast - By Country/Sub-region
- 11.1.1 United States
- 11.1.2 Canada
- 12. Europe Sonobuoy Industry Analysis, Insights and Forecast, 2019-2031
- 12.1. Market Analysis, Insights and Forecast - By Country/Sub-region
- 12.1.1 United Kingdom
- 12.1.2 France
- 12.1.3 Germany
- 12.1.4 Russia
- 12.1.5 Rest of Europe
- 13. Asia Pacific Sonobuoy Industry Analysis, Insights and Forecast, 2019-2031
- 13.1. Market Analysis, Insights and Forecast - By Country/Sub-region
- 13.1.1 China
- 13.1.2 India
- 13.1.3 Japan
- 13.1.4 South Korea
- 13.1.5 Rest of Asia Pacific
- 14. Latin America Sonobuoy Industry Analysis, Insights and Forecast, 2019-2031
- 14.1. Market Analysis, Insights and Forecast - By Country/Sub-region
- 14.1.1 Brazil
- 14.1.2 Rest of Latin America
- 15. Middle East and Africa Sonobuoy Industry Analysis, Insights and Forecast, 2019-2031
- 15.1. Market Analysis, Insights and Forecast - By Country/Sub-region
- 15.1.1 Saudi Arabia
- 15.1.2 United Arab Emirates
- 15.1.3 South Africa
- 15.1.4 Rest of Middle East and Africa
- 16. Competitive Analysis
- 16.1. Global Market Share Analysis 2024
- 16.2. Company Profiles
- 16.2.1 L3Harris Technologies Inc
- 16.2.1.1. Overview
- 16.2.1.2. Products
- 16.2.1.3. SWOT Analysis
- 16.2.1.4. Recent Developments
- 16.2.1.5. Financials (Based on Availability)
- 16.2.2 General Dynamics Corporation
- 16.2.2.1. Overview
- 16.2.2.2. Products
- 16.2.2.3. SWOT Analysis
- 16.2.2.4. Recent Developments
- 16.2.2.5. Financials (Based on Availability)
- 16.2.3 Ultra
- 16.2.3.1. Overview
- 16.2.3.2. Products
- 16.2.3.3. SWOT Analysis
- 16.2.3.4. Recent Developments
- 16.2.3.5. Financials (Based on Availability)
- 16.2.4 Aselsan AS
- 16.2.4.1. Overview
- 16.2.4.2. Products
- 16.2.4.3. SWOT Analysis
- 16.2.4.4. Recent Developments
- 16.2.4.5. Financials (Based on Availability)
- 16.2.5 Lockheed Martin Corporation
- 16.2.5.1. Overview
- 16.2.5.2. Products
- 16.2.5.3. SWOT Analysis
- 16.2.5.4. Recent Developments
- 16.2.5.5. Financials (Based on Availability)
- 16.2.6 Radixon Grou
- 16.2.6.1. Overview
- 16.2.6.2. Products
- 16.2.6.3. SWOT Analysis
- 16.2.6.4. Recent Developments
- 16.2.6.5. Financials (Based on Availability)
- 16.2.7 SeaLandAire Technologies Inc
- 16.2.7.1. Overview
- 16.2.7.2. Products
- 16.2.7.3. SWOT Analysis
- 16.2.7.4. Recent Developments
- 16.2.7.5. Financials (Based on Availability)
- 16.2.8 Sparton
- 16.2.8.1. Overview
- 16.2.8.2. Products
- 16.2.8.3. SWOT Analysis
- 16.2.8.4. Recent Developments
- 16.2.8.5. Financials (Based on Availability)
- 16.2.9 Thales Group
- 16.2.9.1. Overview
- 16.2.9.2. Products
- 16.2.9.3. SWOT Analysis
- 16.2.9.4. Recent Developments
- 16.2.9.5. Financials (Based on Availability)
- 16.2.1 L3Harris Technologies Inc
List of Figures
- Figure 1: Global Sonobuoy Industry Revenue Breakdown (Million, %) by Region 2024 & 2032
- Figure 2: North America Sonobuoy Industry Revenue (Million), by Country 2024 & 2032
- Figure 3: North America Sonobuoy Industry Revenue Share (%), by Country 2024 & 2032
- Figure 4: Europe Sonobuoy Industry Revenue (Million), by Country 2024 & 2032
- Figure 5: Europe Sonobuoy Industry Revenue Share (%), by Country 2024 & 2032
- Figure 6: Asia Pacific Sonobuoy Industry Revenue (Million), by Country 2024 & 2032
- Figure 7: Asia Pacific Sonobuoy Industry Revenue Share (%), by Country 2024 & 2032
- Figure 8: Latin America Sonobuoy Industry Revenue (Million), by Country 2024 & 2032
- Figure 9: Latin America Sonobuoy Industry Revenue Share (%), by Country 2024 & 2032
- Figure 10: Middle East and Africa Sonobuoy Industry Revenue (Million), by Country 2024 & 2032
- Figure 11: Middle East and Africa Sonobuoy Industry Revenue Share (%), by Country 2024 & 2032
- Figure 12: North America Sonobuoy Industry Revenue (Million), by Production Analysis 2024 & 2032
- Figure 13: North America Sonobuoy Industry Revenue Share (%), by Production Analysis 2024 & 2032
- Figure 14: North America Sonobuoy Industry Revenue (Million), by Consumption Analysis 2024 & 2032
- Figure 15: North America Sonobuoy Industry Revenue Share (%), by Consumption Analysis 2024 & 2032
- Figure 16: North America Sonobuoy Industry Revenue (Million), by Import Market Analysis (Value & Volume) 2024 & 2032
- Figure 17: North America Sonobuoy Industry Revenue Share (%), by Import Market Analysis (Value & Volume) 2024 & 2032
- Figure 18: North America Sonobuoy Industry Revenue (Million), by Export Market Analysis (Value & Volume) 2024 & 2032
- Figure 19: North America Sonobuoy Industry Revenue Share (%), by Export Market Analysis (Value & Volume) 2024 & 2032
- Figure 20: North America Sonobuoy Industry Revenue (Million), by Price Trend Analysis 2024 & 2032
- Figure 21: North America Sonobuoy Industry Revenue Share (%), by Price Trend Analysis 2024 & 2032
- Figure 22: North America Sonobuoy Industry Revenue (Million), by Country 2024 & 2032
- Figure 23: North America Sonobuoy Industry Revenue Share (%), by Country 2024 & 2032
- Figure 24: South America Sonobuoy Industry Revenue (Million), by Production Analysis 2024 & 2032
- Figure 25: South America Sonobuoy Industry Revenue Share (%), by Production Analysis 2024 & 2032
- Figure 26: South America Sonobuoy Industry Revenue (Million), by Consumption Analysis 2024 & 2032
- Figure 27: South America Sonobuoy Industry Revenue Share (%), by Consumption Analysis 2024 & 2032
- Figure 28: South America Sonobuoy Industry Revenue (Million), by Import Market Analysis (Value & Volume) 2024 & 2032
- Figure 29: South America Sonobuoy Industry Revenue Share (%), by Import Market Analysis (Value & Volume) 2024 & 2032
- Figure 30: South America Sonobuoy Industry Revenue (Million), by Export Market Analysis (Value & Volume) 2024 & 2032
- Figure 31: South America Sonobuoy Industry Revenue Share (%), by Export Market Analysis (Value & Volume) 2024 & 2032
- Figure 32: South America Sonobuoy Industry Revenue (Million), by Price Trend Analysis 2024 & 2032
- Figure 33: South America Sonobuoy Industry Revenue Share (%), by Price Trend Analysis 2024 & 2032
- Figure 34: South America Sonobuoy Industry Revenue (Million), by Country 2024 & 2032
- Figure 35: South America Sonobuoy Industry Revenue Share (%), by Country 2024 & 2032
- Figure 36: Europe Sonobuoy Industry Revenue (Million), by Production Analysis 2024 & 2032
- Figure 37: Europe Sonobuoy Industry Revenue Share (%), by Production Analysis 2024 & 2032
- Figure 38: Europe Sonobuoy Industry Revenue (Million), by Consumption Analysis 2024 & 2032
- Figure 39: Europe Sonobuoy Industry Revenue Share (%), by Consumption Analysis 2024 & 2032
- Figure 40: Europe Sonobuoy Industry Revenue (Million), by Import Market Analysis (Value & Volume) 2024 & 2032
- Figure 41: Europe Sonobuoy Industry Revenue Share (%), by Import Market Analysis (Value & Volume) 2024 & 2032
- Figure 42: Europe Sonobuoy Industry Revenue (Million), by Export Market Analysis (Value & Volume) 2024 & 2032
- Figure 43: Europe Sonobuoy Industry Revenue Share (%), by Export Market Analysis (Value & Volume) 2024 & 2032
- Figure 44: Europe Sonobuoy Industry Revenue (Million), by Price Trend Analysis 2024 & 2032
- Figure 45: Europe Sonobuoy Industry Revenue Share (%), by Price Trend Analysis 2024 & 2032
- Figure 46: Europe Sonobuoy Industry Revenue (Million), by Country 2024 & 2032
- Figure 47: Europe Sonobuoy Industry Revenue Share (%), by Country 2024 & 2032
- Figure 48: Middle East & Africa Sonobuoy Industry Revenue (Million), by Production Analysis 2024 & 2032
- Figure 49: Middle East & Africa Sonobuoy Industry Revenue Share (%), by Production Analysis 2024 & 2032
- Figure 50: Middle East & Africa Sonobuoy Industry Revenue (Million), by Consumption Analysis 2024 & 2032
- Figure 51: Middle East & Africa Sonobuoy Industry Revenue Share (%), by Consumption Analysis 2024 & 2032
- Figure 52: Middle East & Africa Sonobuoy Industry Revenue (Million), by Import Market Analysis (Value & Volume) 2024 & 2032
- Figure 53: Middle East & Africa Sonobuoy Industry Revenue Share (%), by Import Market Analysis (Value & Volume) 2024 & 2032
- Figure 54: Middle East & Africa Sonobuoy Industry Revenue (Million), by Export Market Analysis (Value & Volume) 2024 & 2032
- Figure 55: Middle East & Africa Sonobuoy Industry Revenue Share (%), by Export Market Analysis (Value & Volume) 2024 & 2032
- Figure 56: Middle East & Africa Sonobuoy Industry Revenue (Million), by Price Trend Analysis 2024 & 2032
- Figure 57: Middle East & Africa Sonobuoy Industry Revenue Share (%), by Price Trend Analysis 2024 & 2032
- Figure 58: Middle East & Africa Sonobuoy Industry Revenue (Million), by Country 2024 & 2032
- Figure 59: Middle East & Africa Sonobuoy Industry Revenue Share (%), by Country 2024 & 2032
- Figure 60: Asia Pacific Sonobuoy Industry Revenue (Million), by Production Analysis 2024 & 2032
- Figure 61: Asia Pacific Sonobuoy Industry Revenue Share (%), by Production Analysis 2024 & 2032
- Figure 62: Asia Pacific Sonobuoy Industry Revenue (Million), by Consumption Analysis 2024 & 2032
- Figure 63: Asia Pacific Sonobuoy Industry Revenue Share (%), by Consumption Analysis 2024 & 2032
- Figure 64: Asia Pacific Sonobuoy Industry Revenue (Million), by Import Market Analysis (Value & Volume) 2024 & 2032
- Figure 65: Asia Pacific Sonobuoy Industry Revenue Share (%), by Import Market Analysis (Value & Volume) 2024 & 2032
- Figure 66: Asia Pacific Sonobuoy Industry Revenue (Million), by Export Market Analysis (Value & Volume) 2024 & 2032
- Figure 67: Asia Pacific Sonobuoy Industry Revenue Share (%), by Export Market Analysis (Value & Volume) 2024 & 2032
- Figure 68: Asia Pacific Sonobuoy Industry Revenue (Million), by Price Trend Analysis 2024 & 2032
- Figure 69: Asia Pacific Sonobuoy Industry Revenue Share (%), by Price Trend Analysis 2024 & 2032
- Figure 70: Asia Pacific Sonobuoy Industry Revenue (Million), by Country 2024 & 2032
- Figure 71: Asia Pacific Sonobuoy Industry Revenue Share (%), by Country 2024 & 2032
List of Tables
- Table 1: Global Sonobuoy Industry Revenue Million Forecast, by Region 2019 & 2032
- Table 2: Global Sonobuoy Industry Revenue Million Forecast, by Production Analysis 2019 & 2032
- Table 3: Global Sonobuoy Industry Revenue Million Forecast, by Consumption Analysis 2019 & 2032
- Table 4: Global Sonobuoy Industry Revenue Million Forecast, by Import Market Analysis (Value & Volume) 2019 & 2032
- Table 5: Global Sonobuoy Industry Revenue Million Forecast, by Export Market Analysis (Value & Volume) 2019 & 2032
- Table 6: Global Sonobuoy Industry Revenue Million Forecast, by Price Trend Analysis 2019 & 2032
- Table 7: Global Sonobuoy Industry Revenue Million Forecast, by Region 2019 & 2032
- Table 8: Global Sonobuoy Industry Revenue Million Forecast, by Country 2019 & 2032
- Table 9: United States Sonobuoy Industry Revenue (Million) Forecast, by Application 2019 & 2032
- Table 10: Canada Sonobuoy Industry Revenue (Million) Forecast, by Application 2019 & 2032
- Table 11: Global Sonobuoy Industry Revenue Million Forecast, by Country 2019 & 2032
- Table 12: United Kingdom Sonobuoy Industry Revenue (Million) Forecast, by Application 2019 & 2032
- Table 13: France Sonobuoy Industry Revenue (Million) Forecast, by Application 2019 & 2032
- Table 14: Germany Sonobuoy Industry Revenue (Million) Forecast, by Application 2019 & 2032
- Table 15: Russia Sonobuoy Industry Revenue (Million) Forecast, by Application 2019 & 2032
- Table 16: Rest of Europe Sonobuoy Industry Revenue (Million) Forecast, by Application 2019 & 2032
- Table 17: Global Sonobuoy Industry Revenue Million Forecast, by Country 2019 & 2032
- Table 18: China Sonobuoy Industry Revenue (Million) Forecast, by Application 2019 & 2032
- Table 19: India Sonobuoy Industry Revenue (Million) Forecast, by Application 2019 & 2032
- Table 20: Japan Sonobuoy Industry Revenue (Million) Forecast, by Application 2019 & 2032
- Table 21: South Korea Sonobuoy Industry Revenue (Million) Forecast, by Application 2019 & 2032
- Table 22: Rest of Asia Pacific Sonobuoy Industry Revenue (Million) Forecast, by Application 2019 & 2032
- Table 23: Global Sonobuoy Industry Revenue Million Forecast, by Country 2019 & 2032
- Table 24: Brazil Sonobuoy Industry Revenue (Million) Forecast, by Application 2019 & 2032
- Table 25: Rest of Latin America Sonobuoy Industry Revenue (Million) Forecast, by Application 2019 & 2032
- Table 26: Global Sonobuoy Industry Revenue Million Forecast, by Country 2019 & 2032
- Table 27: Saudi Arabia Sonobuoy Industry Revenue (Million) Forecast, by Application 2019 & 2032
- Table 28: United Arab Emirates Sonobuoy Industry Revenue (Million) Forecast, by Application 2019 & 2032
- Table 29: South Africa Sonobuoy Industry Revenue (Million) Forecast, by Application 2019 & 2032
- Table 30: Rest of Middle East and Africa Sonobuoy Industry Revenue (Million) Forecast, by Application 2019 & 2032
- Table 31: Global Sonobuoy Industry Revenue Million Forecast, by Production Analysis 2019 & 2032
- Table 32: Global Sonobuoy Industry Revenue Million Forecast, by Consumption Analysis 2019 & 2032
- Table 33: Global Sonobuoy Industry Revenue Million Forecast, by Import Market Analysis (Value & Volume) 2019 & 2032
- Table 34: Global Sonobuoy Industry Revenue Million Forecast, by Export Market Analysis (Value & Volume) 2019 & 2032
- Table 35: Global Sonobuoy Industry Revenue Million Forecast, by Price Trend Analysis 2019 & 2032
- Table 36: Global Sonobuoy Industry Revenue Million Forecast, by Country 2019 & 2032
- Table 37: United States Sonobuoy Industry Revenue (Million) Forecast, by Application 2019 & 2032
- Table 38: Canada Sonobuoy Industry Revenue (Million) Forecast, by Application 2019 & 2032
- Table 39: Mexico Sonobuoy Industry Revenue (Million) Forecast, by Application 2019 & 2032
- Table 40: Global Sonobuoy Industry Revenue Million Forecast, by Production Analysis 2019 & 2032
- Table 41: Global Sonobuoy Industry Revenue Million Forecast, by Consumption Analysis 2019 & 2032
- Table 42: Global Sonobuoy Industry Revenue Million Forecast, by Import Market Analysis (Value & Volume) 2019 & 2032
- Table 43: Global Sonobuoy Industry Revenue Million Forecast, by Export Market Analysis (Value & Volume) 2019 & 2032
- Table 44: Global Sonobuoy Industry Revenue Million Forecast, by Price Trend Analysis 2019 & 2032
- Table 45: Global Sonobuoy Industry Revenue Million Forecast, by Country 2019 & 2032
- Table 46: Brazil Sonobuoy Industry Revenue (Million) Forecast, by Application 2019 & 2032
- Table 47: Argentina Sonobuoy Industry Revenue (Million) Forecast, by Application 2019 & 2032
- Table 48: Rest of South America Sonobuoy Industry Revenue (Million) Forecast, by Application 2019 & 2032
- Table 49: Global Sonobuoy Industry Revenue Million Forecast, by Production Analysis 2019 & 2032
- Table 50: Global Sonobuoy Industry Revenue Million Forecast, by Consumption Analysis 2019 & 2032
- Table 51: Global Sonobuoy Industry Revenue Million Forecast, by Import Market Analysis (Value & Volume) 2019 & 2032
- Table 52: Global Sonobuoy Industry Revenue Million Forecast, by Export Market Analysis (Value & Volume) 2019 & 2032
- Table 53: Global Sonobuoy Industry Revenue Million Forecast, by Price Trend Analysis 2019 & 2032
- Table 54: Global Sonobuoy Industry Revenue Million Forecast, by Country 2019 & 2032
- Table 55: United Kingdom Sonobuoy Industry Revenue (Million) Forecast, by Application 2019 & 2032
- Table 56: Germany Sonobuoy Industry Revenue (Million) Forecast, by Application 2019 & 2032
- Table 57: France Sonobuoy Industry Revenue (Million) Forecast, by Application 2019 & 2032
- Table 58: Italy Sonobuoy Industry Revenue (Million) Forecast, by Application 2019 & 2032
- Table 59: Spain Sonobuoy Industry Revenue (Million) Forecast, by Application 2019 & 2032
- Table 60: Russia Sonobuoy Industry Revenue (Million) Forecast, by Application 2019 & 2032
- Table 61: Benelux Sonobuoy Industry Revenue (Million) Forecast, by Application 2019 & 2032
- Table 62: Nordics Sonobuoy Industry Revenue (Million) Forecast, by Application 2019 & 2032
- Table 63: Rest of Europe Sonobuoy Industry Revenue (Million) Forecast, by Application 2019 & 2032
- Table 64: Global Sonobuoy Industry Revenue Million Forecast, by Production Analysis 2019 & 2032
- Table 65: Global Sonobuoy Industry Revenue Million Forecast, by Consumption Analysis 2019 & 2032
- Table 66: Global Sonobuoy Industry Revenue Million Forecast, by Import Market Analysis (Value & Volume) 2019 & 2032
- Table 67: Global Sonobuoy Industry Revenue Million Forecast, by Export Market Analysis (Value & Volume) 2019 & 2032
- Table 68: Global Sonobuoy Industry Revenue Million Forecast, by Price Trend Analysis 2019 & 2032
- Table 69: Global Sonobuoy Industry Revenue Million Forecast, by Country 2019 & 2032
- Table 70: Turkey Sonobuoy Industry Revenue (Million) Forecast, by Application 2019 & 2032
- Table 71: Israel Sonobuoy Industry Revenue (Million) Forecast, by Application 2019 & 2032
- Table 72: GCC Sonobuoy Industry Revenue (Million) Forecast, by Application 2019 & 2032
- Table 73: North Africa Sonobuoy Industry Revenue (Million) Forecast, by Application 2019 & 2032
- Table 74: South Africa Sonobuoy Industry Revenue (Million) Forecast, by Application 2019 & 2032
- Table 75: Rest of Middle East & Africa Sonobuoy Industry Revenue (Million) Forecast, by Application 2019 & 2032
- Table 76: Global Sonobuoy Industry Revenue Million Forecast, by Production Analysis 2019 & 2032
- Table 77: Global Sonobuoy Industry Revenue Million Forecast, by Consumption Analysis 2019 & 2032
- Table 78: Global Sonobuoy Industry Revenue Million Forecast, by Import Market Analysis (Value & Volume) 2019 & 2032
- Table 79: Global Sonobuoy Industry Revenue Million Forecast, by Export Market Analysis (Value & Volume) 2019 & 2032
- Table 80: Global Sonobuoy Industry Revenue Million Forecast, by Price Trend Analysis 2019 & 2032
- Table 81: Global Sonobuoy Industry Revenue Million Forecast, by Country 2019 & 2032
- Table 82: China Sonobuoy Industry Revenue (Million) Forecast, by Application 2019 & 2032
- Table 83: India Sonobuoy Industry Revenue (Million) Forecast, by Application 2019 & 2032
- Table 84: Japan Sonobuoy Industry Revenue (Million) Forecast, by Application 2019 & 2032
- Table 85: South Korea Sonobuoy Industry Revenue (Million) Forecast, by Application 2019 & 2032
- Table 86: ASEAN Sonobuoy Industry Revenue (Million) Forecast, by Application 2019 & 2032
- Table 87: Oceania Sonobuoy Industry Revenue (Million) Forecast, by Application 2019 & 2032
- Table 88: Rest of Asia Pacific Sonobuoy Industry Revenue (Million) Forecast, by Application 2019 & 2032
Frequently Asked Questions
1. What is the projected Compound Annual Growth Rate (CAGR) of the Sonobuoy Industry?
The projected CAGR is approximately > 6.50%.
2. Which companies are prominent players in the Sonobuoy Industry?
Key companies in the market include L3Harris Technologies Inc, General Dynamics Corporation, Ultra, Aselsan AS, Lockheed Martin Corporation, Radixon Grou, SeaLandAire Technologies Inc, Sparton, Thales Group.
3. What are the main segments of the Sonobuoy Industry?
The market segments include Production Analysis, Consumption Analysis, Import Market Analysis (Value & Volume), Export Market Analysis (Value & Volume), Price Trend Analysis.
4. Can you provide details about the market size?
The market size is estimated to be USD XX Million as of 2022.
5. What are some drivers contributing to market growth?
; Increased Seaborne Threats And Ambiguous Maritime Security Policies; Increasing Adoption Of Security Technologies In Bric Countries.
6. What are the notable trends driving market growth?
The Defense Segment Will Showcase Highest Growth During the Forecast Period.
7. Are there any restraints impacting market growth?
; High Risk Rate In Ungoverned Zones; Unstructured Security Standards And Technologies.
8. Can you provide examples of recent developments in the market?
November 2022: UMS SKELDAR entered into a cooperative agreement with Ultra Maritime, which was selected through the Department of National Defence's (DND) Innovation for Defence Excellence and Security (IDEaS) program. The objective of the partnership is to investigate the development of an Anti-Submarine Warfare (ASW) sonobuoy dispensing capability utilizing the SKELDAR V-200 Uncrewed Aircraft System (UAS) for the Canadian Armed Forces (CAF).
9. What pricing options are available for accessing the report?
Pricing options include single-user, multi-user, and enterprise licenses priced at USD 4750, USD 5250, and USD 8750 respectively.
10. Is the market size provided in terms of value or volume?
The market size is provided in terms of value, measured in Million.
11. Are there any specific market keywords associated with the report?
Yes, the market keyword associated with the report is "Sonobuoy Industry," which aids in identifying and referencing the specific market segment covered.
12. How do I determine which pricing option suits my needs best?
The pricing options vary based on user requirements and access needs. Individual users may opt for single-user licenses, while businesses requiring broader access may choose multi-user or enterprise licenses for cost-effective access to the report.
13. Are there any additional resources or data provided in the Sonobuoy Industry report?
While the report offers comprehensive insights, it's advisable to review the specific contents or supplementary materials provided to ascertain if additional resources or data are available.
14. How can I stay updated on further developments or reports in the Sonobuoy Industry?
To stay informed about further developments, trends, and reports in the Sonobuoy Industry, consider subscribing to industry newsletters, following relevant companies and organizations, or regularly checking reputable industry news sources and publications.
Methodology
Step 1 - Identification of Relevant Samples Size from Population Database


Step 2 - Approaches for Defining Global Market Size (Value, Volume* & Price*)

Note*: In applicable scenarios
Step 3 - Data Sources
Primary Research
- Web Analytics
- Survey Reports
- Research Institute
- Latest Research Reports
- Opinion Leaders
Secondary Research
- Annual Reports
- White Paper
- Latest Press Release
- Industry Association
- Paid Database
- Investor Presentations

Step 4 - Data Triangulation
Involves using different sources of information in order to increase the validity of a study
These sources are likely to be stakeholders in a program - participants, other researchers, program staff, other community members, and so on.
Then we put all data in single framework & apply various statistical tools to find out the dynamic on the market.
During the analysis stage, feedback from the stakeholder groups would be compared to determine areas of agreement as well as areas of divergence
