

Key Insights
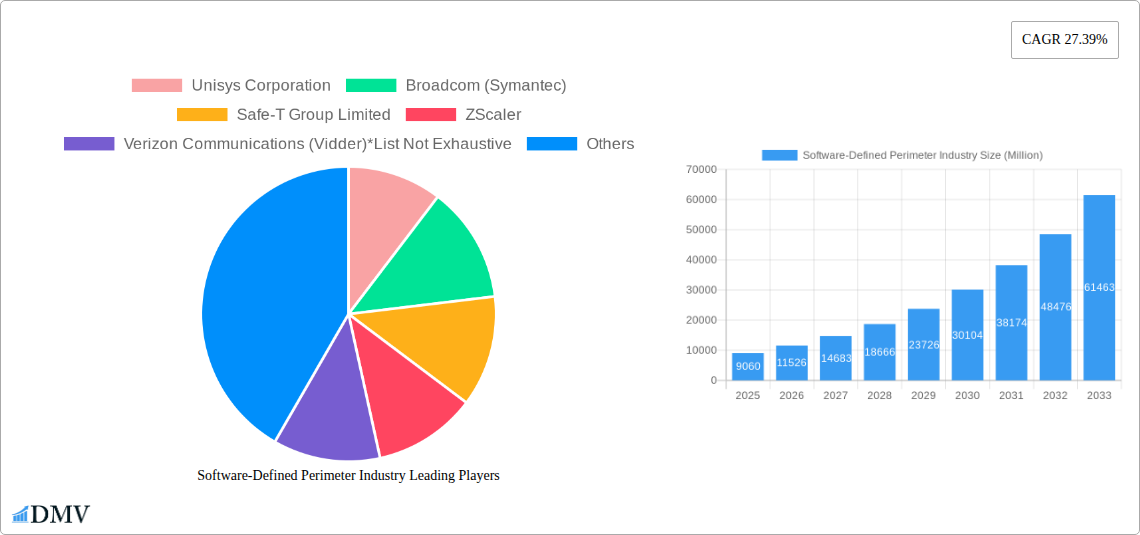
The Software-Defined Perimeter (SDP) market is experiencing robust growth, projected to reach $9.06 billion in 2025 and exhibiting a remarkable Compound Annual Growth Rate (CAGR) of 27.39%. This expansion is fueled by several key drivers. The increasing prevalence of remote work and the heightened need for robust cybersecurity solutions in a distributed environment are significantly boosting adoption. Furthermore, the rising adoption of cloud-based applications and the need for secure access to sensitive data across various devices are driving demand. The complexity and cost associated with traditional VPNs, which often fall short in securing modern distributed architectures, further propels the shift towards SDPs. Significant advancements in technology, such as improved micro-segmentation and enhanced authentication mechanisms, are also contributing to this market growth. The market is segmented by end-user verticals (BFSI, Telecom & IT, Healthcare, Retail, Government, and Others), type (solutions and services), and deployment mode (cloud and on-premise). While the cloud deployment mode currently dominates, on-premise solutions retain a significant share, particularly among organizations with stringent data residency requirements.
Competitive dynamics are intense, with established players like Cisco, Palo Alto Networks, and Check Point competing alongside emerging innovators like Cato Networks and Safe-T Group. The market is witnessing a trend toward consolidation, with mergers and acquisitions expected to further shape the landscape. The growth trajectory, however, is not without challenges. Concerns regarding initial implementation costs and the need for specialized expertise may act as restraints in some segments. However, the long-term cost benefits of enhanced security and improved operational efficiency are expected to outweigh these initial hurdles. The market’s future growth hinges on continued technological innovation, the increasing sophistication of cyber threats, and the sustained adoption of cloud-based infrastructure across various industries. The Asia Pacific region is anticipated to experience the fastest growth, driven by increasing digitalization and a growing awareness of cybersecurity threats.
Software-Defined Perimeter (SDP) Industry Report: 2019-2033
This comprehensive report provides an in-depth analysis of the Software-Defined Perimeter (SDP) industry, offering invaluable insights for stakeholders seeking to navigate this rapidly evolving market. With a study period spanning 2019-2033, a base year of 2025, and a forecast period of 2025-2033, this report unveils the key trends, challenges, and opportunities shaping the future of SDP. The market is projected to reach $xx Million by 2033, representing substantial growth potential.
Software-Defined Perimeter Industry Market Composition & Trends
The Software-Defined Perimeter (SDP) market exhibits a moderately consolidated landscape, with key players such as Unisys Corporation, Broadcom (Symantec), Safe-T Group Limited, ZScaler, and Verizon Communications (Vidder) holding significant market share. However, the emergence of innovative startups and the ongoing expansion of established players suggest a dynamic competitive environment. The market share distribution in 2025 is estimated at: Zscaler (25%), Palo Alto Networks (15%), Cato Networks (12%), and others (48%). M&A activity is significant, with total deal values exceeding $xx Million in the past five years, driven by the need for enhanced security capabilities and expanded market reach.
- Market Concentration: Moderately consolidated, with several major players holding significant market share.
- Innovation Catalysts: Increasing cyber threats and the growing adoption of cloud and remote work models.
- Regulatory Landscapes: Compliance mandates like GDPR and CCPA are driving SDP adoption.
- Substitute Products: Traditional VPNs and other perimeter security solutions.
- End-User Profiles: BFSI, Telecom & IT, Healthcare, Retail, and Government sectors are leading adopters.
- M&A Activity: Significant M&A activity, with deal values exceeding $xx Million in recent years.
Software-Defined Perimeter Industry Evolution
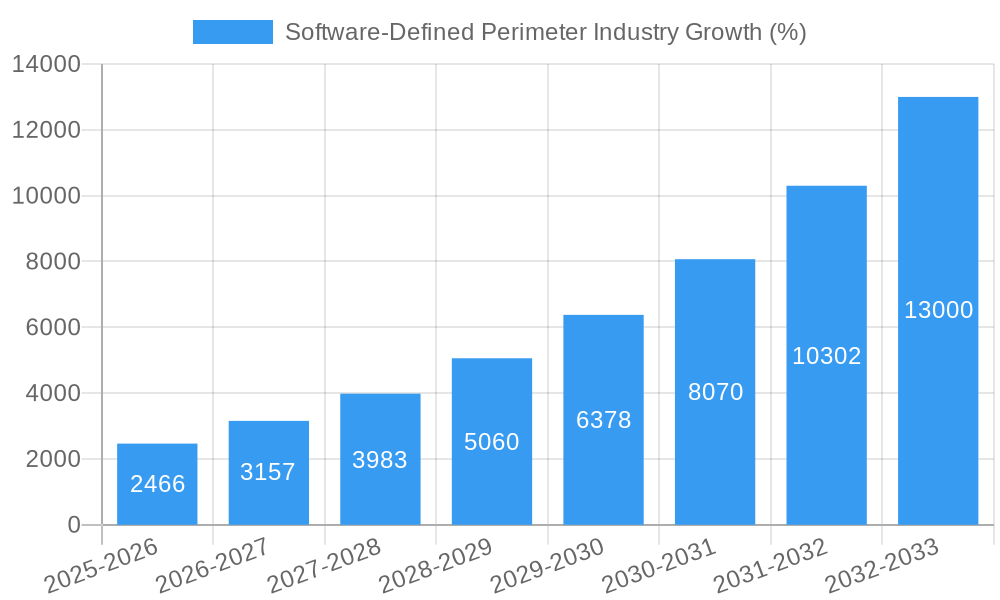
The SDP market has witnessed exponential growth, driven by increasing concerns over cybersecurity threats and the proliferation of remote work. The historical period (2019-2024) saw a Compound Annual Growth Rate (CAGR) of xx%, and the forecast period (2025-2033) is projected to see a CAGR of xx%, reaching a market value of $xx Million by 2033. This growth is fueled by technological advancements, such as the integration of AI and machine learning for enhanced threat detection and improved scalability, as well as shifting consumer demands for robust security in cloud and hybrid environments. Adoption rates are increasing, with a projected xx% penetration rate in the BFSI sector by 2033. The market is also seeing a shift towards cloud-based SDP solutions, driven by cost-effectiveness and ease of deployment.
Leading Regions, Countries, or Segments in Software-Defined Perimeter Industry
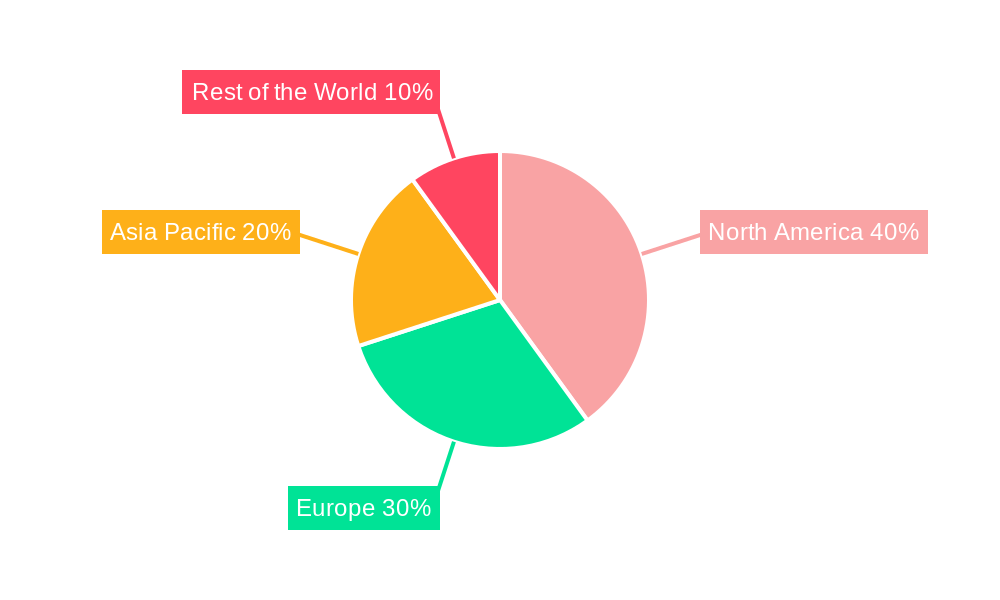
The North American region currently dominates the SDP market, followed by Europe and Asia-Pacific. Within the end-user verticals, the BFSI and Telecom & IT sectors show the highest adoption rates, driven by stringent regulatory requirements and the sensitive nature of their data. Cloud-based deployment models are also leading the way, primarily because of their scalability and flexibility.
- Key Drivers (North America): High levels of IT spending, strong cybersecurity awareness, and advanced technological infrastructure.
- Key Drivers (BFSI): Stringent regulatory compliance needs and high sensitivity of financial data.
- Key Drivers (Cloud Deployment): Cost-effectiveness, scalability, and ease of deployment.
Software-Defined Perimeter Industry Product Innovations
Recent product innovations include the integration of AI and machine learning for advanced threat detection, improved user experience through simplified authentication processes, and enhanced scalability to support large and complex networks. These innovations have led to SDP solutions that provide robust security with minimal disruption to user productivity, differentiating them from legacy VPN solutions. Key improvements include granular access control, real-time threat monitoring, and improved integration with existing security infrastructure.
Propelling Factors for Software-Defined Perimeter Industry Growth
Several factors are driving the growth of the SDP market. Firstly, the increasing sophistication and frequency of cyberattacks are compelling organizations to adopt more robust security solutions. Secondly, the rise of remote work and cloud adoption has expanded the attack surface, making SDP essential for protecting sensitive data. Thirdly, regulatory compliance requirements are pushing organizations towards zero-trust security models, a core component of SDP.
Obstacles in the Software-Defined Perimeter Industry Market
Despite significant growth potential, the SDP market faces several challenges. High initial investment costs can be a barrier to entry for smaller organizations. Furthermore, complex integration with existing IT infrastructure can hinder adoption. Finally, the need for skilled professionals to manage and maintain SDP solutions poses a significant hurdle. These factors currently represent approximately xx% of the market's overall restraint.
Future Opportunities in Software-Defined Perimeter Industry
The SDP market holds significant future opportunities. The expanding adoption of IoT devices and edge computing will create demand for SDP solutions to secure these endpoints. Furthermore, advancements in AI and machine learning will lead to more intelligent and adaptive SDP solutions. Finally, emerging markets in developing economies present significant growth potential as these regions enhance their digital infrastructure.
Major Players in the Software-Defined Perimeter Industry Ecosystem
- Unisys Corporation
- Broadcom (Symantec)
- Safe-T Group Limited
- ZScaler
- Verizon Communications (Vidder)
- Cato Networks Limited
- Cisco Systems Inc
- Fortinet Corporation
- APPGate
- Perimeter
- Okta Inc
- Akamai Technologies Inc (Soha Systems)
- Palo Alto Networks Inc
- Check Point
Key Developments in Software-Defined Perimeter Industry
- January 2023: InstaSafe expands its SDP solutions across India and SAARC.
- February 2022: Appgate extends SDP solution support for Kubernetes clusters.
Strategic Software-Defined Perimeter Industry Market Forecast
The SDP market is poised for significant growth, driven by the increasing need for robust security in an increasingly interconnected world. The convergence of cloud computing, IoT, and AI will further fuel demand for advanced SDP solutions. This report anticipates continued strong growth, driven by increased adoption across various industries and regions, ultimately leading to a significant market expansion in the coming years.
Software-Defined Perimeter Industry Segmentation
-
1. Type
- 1.1. Solutions
- 1.2. Services
-
2. Deployment Mode
- 2.1. Cloud
- 2.2. On-Premise
-
3. End-User Verticals
- 3.1. BFSI
- 3.2. Telecom and IT
- 3.3. Healthcare
- 3.4. Retail
- 3.5. Government
- 3.6. Other End-user Verticals
Software-Defined Perimeter Industry Segmentation By Geography
- 1. North America
- 2. Europe
- 3. Asia Pacific
- 4. Rest of the World
Software-Defined Perimeter Industry REPORT HIGHLIGHTS
| Aspects | Details |
|---|---|
| Study Period | 2019-2033 |
| Base Year | 2024 |
| Estimated Year | 2025 |
| Forecast Period | 2025-2033 |
| Historical Period | 2019-2024 |
| Growth Rate | CAGR of 27.39% from 2019-2033 |
| Segmentation |
|
Table of Contents
- 1. Introduction
- 1.1. Research Scope
- 1.2. Market Segmentation
- 1.3. Research Methodology
- 1.4. Definitions and Assumptions
- 2. Executive Summary
- 2.1. Introduction
- 3. Market Dynamics
- 3.1. Introduction
- 3.2. Market Drivers
- 3.2.1 Ongoing Migration to The Cloud
- 3.2.2 Adoption of IoT & BYOD; Stringent Data Compliance Requirements and Need for Scalable Data Safeguarding Strategies
- 3.3. Market Restrains
- 3.3.1. Growing Demand for Open-Source Security Standards
- 3.4. Market Trends
- 3.4.1. BFSI Sector Will Experience Significant Growth
- 4. Market Factor Analysis
- 4.1. Porters Five Forces
- 4.2. Supply/Value Chain
- 4.3. PESTEL analysis
- 4.4. Market Entropy
- 4.5. Patent/Trademark Analysis
- 5. Global Software-Defined Perimeter Industry Analysis, Insights and Forecast, 2019-2031
- 5.1. Market Analysis, Insights and Forecast - by Type
- 5.1.1. Solutions
- 5.1.2. Services
- 5.2. Market Analysis, Insights and Forecast - by Deployment Mode
- 5.2.1. Cloud
- 5.2.2. On-Premise
- 5.3. Market Analysis, Insights and Forecast - by End-User Verticals
- 5.3.1. BFSI
- 5.3.2. Telecom and IT
- 5.3.3. Healthcare
- 5.3.4. Retail
- 5.3.5. Government
- 5.3.6. Other End-user Verticals
- 5.4. Market Analysis, Insights and Forecast - by Region
- 5.4.1. North America
- 5.4.2. Europe
- 5.4.3. Asia Pacific
- 5.4.4. Rest of the World
- 5.1. Market Analysis, Insights and Forecast - by Type
- 6. North America Software-Defined Perimeter Industry Analysis, Insights and Forecast, 2019-2031
- 6.1. Market Analysis, Insights and Forecast - by Type
- 6.1.1. Solutions
- 6.1.2. Services
- 6.2. Market Analysis, Insights and Forecast - by Deployment Mode
- 6.2.1. Cloud
- 6.2.2. On-Premise
- 6.3. Market Analysis, Insights and Forecast - by End-User Verticals
- 6.3.1. BFSI
- 6.3.2. Telecom and IT
- 6.3.3. Healthcare
- 6.3.4. Retail
- 6.3.5. Government
- 6.3.6. Other End-user Verticals
- 6.1. Market Analysis, Insights and Forecast - by Type
- 7. Europe Software-Defined Perimeter Industry Analysis, Insights and Forecast, 2019-2031
- 7.1. Market Analysis, Insights and Forecast - by Type
- 7.1.1. Solutions
- 7.1.2. Services
- 7.2. Market Analysis, Insights and Forecast - by Deployment Mode
- 7.2.1. Cloud
- 7.2.2. On-Premise
- 7.3. Market Analysis, Insights and Forecast - by End-User Verticals
- 7.3.1. BFSI
- 7.3.2. Telecom and IT
- 7.3.3. Healthcare
- 7.3.4. Retail
- 7.3.5. Government
- 7.3.6. Other End-user Verticals
- 7.1. Market Analysis, Insights and Forecast - by Type
- 8. Asia Pacific Software-Defined Perimeter Industry Analysis, Insights and Forecast, 2019-2031
- 8.1. Market Analysis, Insights and Forecast - by Type
- 8.1.1. Solutions
- 8.1.2. Services
- 8.2. Market Analysis, Insights and Forecast - by Deployment Mode
- 8.2.1. Cloud
- 8.2.2. On-Premise
- 8.3. Market Analysis, Insights and Forecast - by End-User Verticals
- 8.3.1. BFSI
- 8.3.2. Telecom and IT
- 8.3.3. Healthcare
- 8.3.4. Retail
- 8.3.5. Government
- 8.3.6. Other End-user Verticals
- 8.1. Market Analysis, Insights and Forecast - by Type
- 9. Rest of the World Software-Defined Perimeter Industry Analysis, Insights and Forecast, 2019-2031
- 9.1. Market Analysis, Insights and Forecast - by Type
- 9.1.1. Solutions
- 9.1.2. Services
- 9.2. Market Analysis, Insights and Forecast - by Deployment Mode
- 9.2.1. Cloud
- 9.2.2. On-Premise
- 9.3. Market Analysis, Insights and Forecast - by End-User Verticals
- 9.3.1. BFSI
- 9.3.2. Telecom and IT
- 9.3.3. Healthcare
- 9.3.4. Retail
- 9.3.5. Government
- 9.3.6. Other End-user Verticals
- 9.1. Market Analysis, Insights and Forecast - by Type
- 10. North America Software-Defined Perimeter Industry Analysis, Insights and Forecast, 2019-2031
- 10.1. Market Analysis, Insights and Forecast - By Country/Sub-region
- 10.1.1.
- 11. Europe Software-Defined Perimeter Industry Analysis, Insights and Forecast, 2019-2031
- 11.1. Market Analysis, Insights and Forecast - By Country/Sub-region
- 11.1.1.
- 12. Asia Pacific Software-Defined Perimeter Industry Analysis, Insights and Forecast, 2019-2031
- 12.1. Market Analysis, Insights and Forecast - By Country/Sub-region
- 12.1.1.
- 13. Rest of the World Software-Defined Perimeter Industry Analysis, Insights and Forecast, 2019-2031
- 13.1. Market Analysis, Insights and Forecast - By Country/Sub-region
- 13.1.1.
- 14. Competitive Analysis
- 14.1. Global Market Share Analysis 2024
- 14.2. Company Profiles
- 14.2.1 Unisys Corporation
- 14.2.1.1. Overview
- 14.2.1.2. Products
- 14.2.1.3. SWOT Analysis
- 14.2.1.4. Recent Developments
- 14.2.1.5. Financials (Based on Availability)
- 14.2.2 Broadcom (Symantec)
- 14.2.2.1. Overview
- 14.2.2.2. Products
- 14.2.2.3. SWOT Analysis
- 14.2.2.4. Recent Developments
- 14.2.2.5. Financials (Based on Availability)
- 14.2.3 Safe-T Group Limited
- 14.2.3.1. Overview
- 14.2.3.2. Products
- 14.2.3.3. SWOT Analysis
- 14.2.3.4. Recent Developments
- 14.2.3.5. Financials (Based on Availability)
- 14.2.4 ZScaler
- 14.2.4.1. Overview
- 14.2.4.2. Products
- 14.2.4.3. SWOT Analysis
- 14.2.4.4. Recent Developments
- 14.2.4.5. Financials (Based on Availability)
- 14.2.5 Verizon Communications (Vidder)*List Not Exhaustive
- 14.2.5.1. Overview
- 14.2.5.2. Products
- 14.2.5.3. SWOT Analysis
- 14.2.5.4. Recent Developments
- 14.2.5.5. Financials (Based on Availability)
- 14.2.6 Cato Networks Limited
- 14.2.6.1. Overview
- 14.2.6.2. Products
- 14.2.6.3. SWOT Analysis
- 14.2.6.4. Recent Developments
- 14.2.6.5. Financials (Based on Availability)
- 14.2.7 Cisco Systems Inc
- 14.2.7.1. Overview
- 14.2.7.2. Products
- 14.2.7.3. SWOT Analysis
- 14.2.7.4. Recent Developments
- 14.2.7.5. Financials (Based on Availability)
- 14.2.8 Fortinent Corporation
- 14.2.8.1. Overview
- 14.2.8.2. Products
- 14.2.8.3. SWOT Analysis
- 14.2.8.4. Recent Developments
- 14.2.8.5. Financials (Based on Availability)
- 14.2.9 APPGate
- 14.2.9.1. Overview
- 14.2.9.2. Products
- 14.2.9.3. SWOT Analysis
- 14.2.9.4. Recent Developments
- 14.2.9.5. Financials (Based on Availability)
- 14.2.10 Perimeter
- 14.2.10.1. Overview
- 14.2.10.2. Products
- 14.2.10.3. SWOT Analysis
- 14.2.10.4. Recent Developments
- 14.2.10.5. Financials (Based on Availability)
- 14.2.11 Okta Inc
- 14.2.11.1. Overview
- 14.2.11.2. Products
- 14.2.11.3. SWOT Analysis
- 14.2.11.4. Recent Developments
- 14.2.11.5. Financials (Based on Availability)
- 14.2.12 Akamai Technologies Inc (Soha Systems)
- 14.2.12.1. Overview
- 14.2.12.2. Products
- 14.2.12.3. SWOT Analysis
- 14.2.12.4. Recent Developments
- 14.2.12.5. Financials (Based on Availability)
- 14.2.13 Palo Alto Networks Inc
- 14.2.13.1. Overview
- 14.2.13.2. Products
- 14.2.13.3. SWOT Analysis
- 14.2.13.4. Recent Developments
- 14.2.13.5. Financials (Based on Availability)
- 14.2.14 Check Point
- 14.2.14.1. Overview
- 14.2.14.2. Products
- 14.2.14.3. SWOT Analysis
- 14.2.14.4. Recent Developments
- 14.2.14.5. Financials (Based on Availability)
- 14.2.1 Unisys Corporation
List of Figures
- Figure 1: Global Software-Defined Perimeter Industry Revenue Breakdown (Million, %) by Region 2024 & 2032
- Figure 2: North America Software-Defined Perimeter Industry Revenue (Million), by Country 2024 & 2032
- Figure 3: North America Software-Defined Perimeter Industry Revenue Share (%), by Country 2024 & 2032
- Figure 4: Europe Software-Defined Perimeter Industry Revenue (Million), by Country 2024 & 2032
- Figure 5: Europe Software-Defined Perimeter Industry Revenue Share (%), by Country 2024 & 2032
- Figure 6: Asia Pacific Software-Defined Perimeter Industry Revenue (Million), by Country 2024 & 2032
- Figure 7: Asia Pacific Software-Defined Perimeter Industry Revenue Share (%), by Country 2024 & 2032
- Figure 8: Rest of the World Software-Defined Perimeter Industry Revenue (Million), by Country 2024 & 2032
- Figure 9: Rest of the World Software-Defined Perimeter Industry Revenue Share (%), by Country 2024 & 2032
- Figure 10: North America Software-Defined Perimeter Industry Revenue (Million), by Type 2024 & 2032
- Figure 11: North America Software-Defined Perimeter Industry Revenue Share (%), by Type 2024 & 2032
- Figure 12: North America Software-Defined Perimeter Industry Revenue (Million), by Deployment Mode 2024 & 2032
- Figure 13: North America Software-Defined Perimeter Industry Revenue Share (%), by Deployment Mode 2024 & 2032
- Figure 14: North America Software-Defined Perimeter Industry Revenue (Million), by End-User Verticals 2024 & 2032
- Figure 15: North America Software-Defined Perimeter Industry Revenue Share (%), by End-User Verticals 2024 & 2032
- Figure 16: North America Software-Defined Perimeter Industry Revenue (Million), by Country 2024 & 2032
- Figure 17: North America Software-Defined Perimeter Industry Revenue Share (%), by Country 2024 & 2032
- Figure 18: Europe Software-Defined Perimeter Industry Revenue (Million), by Type 2024 & 2032
- Figure 19: Europe Software-Defined Perimeter Industry Revenue Share (%), by Type 2024 & 2032
- Figure 20: Europe Software-Defined Perimeter Industry Revenue (Million), by Deployment Mode 2024 & 2032
- Figure 21: Europe Software-Defined Perimeter Industry Revenue Share (%), by Deployment Mode 2024 & 2032
- Figure 22: Europe Software-Defined Perimeter Industry Revenue (Million), by End-User Verticals 2024 & 2032
- Figure 23: Europe Software-Defined Perimeter Industry Revenue Share (%), by End-User Verticals 2024 & 2032
- Figure 24: Europe Software-Defined Perimeter Industry Revenue (Million), by Country 2024 & 2032
- Figure 25: Europe Software-Defined Perimeter Industry Revenue Share (%), by Country 2024 & 2032
- Figure 26: Asia Pacific Software-Defined Perimeter Industry Revenue (Million), by Type 2024 & 2032
- Figure 27: Asia Pacific Software-Defined Perimeter Industry Revenue Share (%), by Type 2024 & 2032
- Figure 28: Asia Pacific Software-Defined Perimeter Industry Revenue (Million), by Deployment Mode 2024 & 2032
- Figure 29: Asia Pacific Software-Defined Perimeter Industry Revenue Share (%), by Deployment Mode 2024 & 2032
- Figure 30: Asia Pacific Software-Defined Perimeter Industry Revenue (Million), by End-User Verticals 2024 & 2032
- Figure 31: Asia Pacific Software-Defined Perimeter Industry Revenue Share (%), by End-User Verticals 2024 & 2032
- Figure 32: Asia Pacific Software-Defined Perimeter Industry Revenue (Million), by Country 2024 & 2032
- Figure 33: Asia Pacific Software-Defined Perimeter Industry Revenue Share (%), by Country 2024 & 2032
- Figure 34: Rest of the World Software-Defined Perimeter Industry Revenue (Million), by Type 2024 & 2032
- Figure 35: Rest of the World Software-Defined Perimeter Industry Revenue Share (%), by Type 2024 & 2032
- Figure 36: Rest of the World Software-Defined Perimeter Industry Revenue (Million), by Deployment Mode 2024 & 2032
- Figure 37: Rest of the World Software-Defined Perimeter Industry Revenue Share (%), by Deployment Mode 2024 & 2032
- Figure 38: Rest of the World Software-Defined Perimeter Industry Revenue (Million), by End-User Verticals 2024 & 2032
- Figure 39: Rest of the World Software-Defined Perimeter Industry Revenue Share (%), by End-User Verticals 2024 & 2032
- Figure 40: Rest of the World Software-Defined Perimeter Industry Revenue (Million), by Country 2024 & 2032
- Figure 41: Rest of the World Software-Defined Perimeter Industry Revenue Share (%), by Country 2024 & 2032
List of Tables
- Table 1: Global Software-Defined Perimeter Industry Revenue Million Forecast, by Region 2019 & 2032
- Table 2: Global Software-Defined Perimeter Industry Revenue Million Forecast, by Type 2019 & 2032
- Table 3: Global Software-Defined Perimeter Industry Revenue Million Forecast, by Deployment Mode 2019 & 2032
- Table 4: Global Software-Defined Perimeter Industry Revenue Million Forecast, by End-User Verticals 2019 & 2032
- Table 5: Global Software-Defined Perimeter Industry Revenue Million Forecast, by Region 2019 & 2032
- Table 6: Global Software-Defined Perimeter Industry Revenue Million Forecast, by Country 2019 & 2032
- Table 7: Software-Defined Perimeter Industry Revenue (Million) Forecast, by Application 2019 & 2032
- Table 8: Global Software-Defined Perimeter Industry Revenue Million Forecast, by Country 2019 & 2032
- Table 9: Software-Defined Perimeter Industry Revenue (Million) Forecast, by Application 2019 & 2032
- Table 10: Global Software-Defined Perimeter Industry Revenue Million Forecast, by Country 2019 & 2032
- Table 11: Software-Defined Perimeter Industry Revenue (Million) Forecast, by Application 2019 & 2032
- Table 12: Global Software-Defined Perimeter Industry Revenue Million Forecast, by Country 2019 & 2032
- Table 13: Software-Defined Perimeter Industry Revenue (Million) Forecast, by Application 2019 & 2032
- Table 14: Global Software-Defined Perimeter Industry Revenue Million Forecast, by Type 2019 & 2032
- Table 15: Global Software-Defined Perimeter Industry Revenue Million Forecast, by Deployment Mode 2019 & 2032
- Table 16: Global Software-Defined Perimeter Industry Revenue Million Forecast, by End-User Verticals 2019 & 2032
- Table 17: Global Software-Defined Perimeter Industry Revenue Million Forecast, by Country 2019 & 2032
- Table 18: Global Software-Defined Perimeter Industry Revenue Million Forecast, by Type 2019 & 2032
- Table 19: Global Software-Defined Perimeter Industry Revenue Million Forecast, by Deployment Mode 2019 & 2032
- Table 20: Global Software-Defined Perimeter Industry Revenue Million Forecast, by End-User Verticals 2019 & 2032
- Table 21: Global Software-Defined Perimeter Industry Revenue Million Forecast, by Country 2019 & 2032
- Table 22: Global Software-Defined Perimeter Industry Revenue Million Forecast, by Type 2019 & 2032
- Table 23: Global Software-Defined Perimeter Industry Revenue Million Forecast, by Deployment Mode 2019 & 2032
- Table 24: Global Software-Defined Perimeter Industry Revenue Million Forecast, by End-User Verticals 2019 & 2032
- Table 25: Global Software-Defined Perimeter Industry Revenue Million Forecast, by Country 2019 & 2032
- Table 26: Global Software-Defined Perimeter Industry Revenue Million Forecast, by Type 2019 & 2032
- Table 27: Global Software-Defined Perimeter Industry Revenue Million Forecast, by Deployment Mode 2019 & 2032
- Table 28: Global Software-Defined Perimeter Industry Revenue Million Forecast, by End-User Verticals 2019 & 2032
- Table 29: Global Software-Defined Perimeter Industry Revenue Million Forecast, by Country 2019 & 2032
Frequently Asked Questions
1. What is the projected Compound Annual Growth Rate (CAGR) of the Software-Defined Perimeter Industry?
The projected CAGR is approximately 27.39%.
2. Which companies are prominent players in the Software-Defined Perimeter Industry?
Key companies in the market include Unisys Corporation, Broadcom (Symantec), Safe-T Group Limited, ZScaler, Verizon Communications (Vidder)*List Not Exhaustive, Cato Networks Limited, Cisco Systems Inc, Fortinent Corporation, APPGate, Perimeter, Okta Inc, Akamai Technologies Inc (Soha Systems), Palo Alto Networks Inc, Check Point.
3. What are the main segments of the Software-Defined Perimeter Industry?
The market segments include Type, Deployment Mode, End-User Verticals.
4. Can you provide details about the market size?
The market size is estimated to be USD 9.06 Million as of 2022.
5. What are some drivers contributing to market growth?
Ongoing Migration to The Cloud. Adoption of IoT & BYOD; Stringent Data Compliance Requirements and Need for Scalable Data Safeguarding Strategies.
6. What are the notable trends driving market growth?
BFSI Sector Will Experience Significant Growth.
7. Are there any restraints impacting market growth?
Growing Demand for Open-Source Security Standards.
8. Can you provide examples of recent developments in the market?
January 2023: InstaSafe, a Bangalore-based security service provider, announced the expansion of its product base across India and SAARC by partnering with iValue InfoSolutions, a technology services and solutions aggregator across India and South-East Asia. Both organizations are working towards promoting software-defined perimeter (SDP) based zero trust security solutions to address cloud security, identity management, and remote access across the Indian subcontinent.
9. What pricing options are available for accessing the report?
Pricing options include single-user, multi-user, and enterprise licenses priced at USD 4750, USD 5250, and USD 8750 respectively.
10. Is the market size provided in terms of value or volume?
The market size is provided in terms of value, measured in Million.
11. Are there any specific market keywords associated with the report?
Yes, the market keyword associated with the report is "Software-Defined Perimeter Industry," which aids in identifying and referencing the specific market segment covered.
12. How do I determine which pricing option suits my needs best?
The pricing options vary based on user requirements and access needs. Individual users may opt for single-user licenses, while businesses requiring broader access may choose multi-user or enterprise licenses for cost-effective access to the report.
13. Are there any additional resources or data provided in the Software-Defined Perimeter Industry report?
While the report offers comprehensive insights, it's advisable to review the specific contents or supplementary materials provided to ascertain if additional resources or data are available.
14. How can I stay updated on further developments or reports in the Software-Defined Perimeter Industry?
To stay informed about further developments, trends, and reports in the Software-Defined Perimeter Industry, consider subscribing to industry newsletters, following relevant companies and organizations, or regularly checking reputable industry news sources and publications.
Methodology
Step 1 - Identification of Relevant Samples Size from Population Database


Step 2 - Approaches for Defining Global Market Size (Value, Volume* & Price*)

Note*: In applicable scenarios
Step 3 - Data Sources
Primary Research
- Web Analytics
- Survey Reports
- Research Institute
- Latest Research Reports
- Opinion Leaders
Secondary Research
- Annual Reports
- White Paper
- Latest Press Release
- Industry Association
- Paid Database
- Investor Presentations

Step 4 - Data Triangulation
Involves using different sources of information in order to increase the validity of a study
These sources are likely to be stakeholders in a program - participants, other researchers, program staff, other community members, and so on.
Then we put all data in single framework & apply various statistical tools to find out the dynamic on the market.
During the analysis stage, feedback from the stakeholder groups would be compared to determine areas of agreement as well as areas of divergence
