

Key Insights
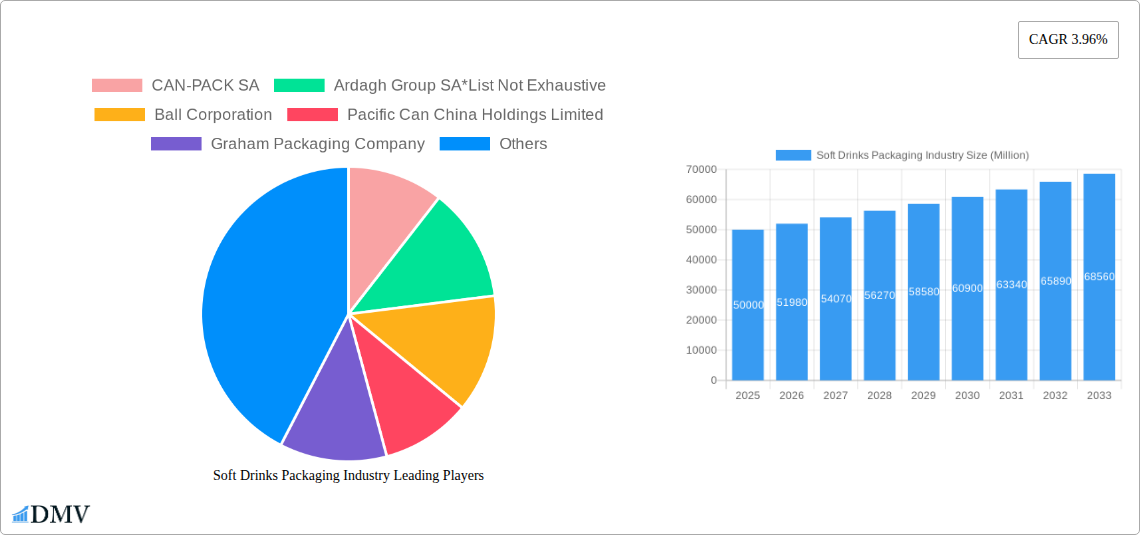
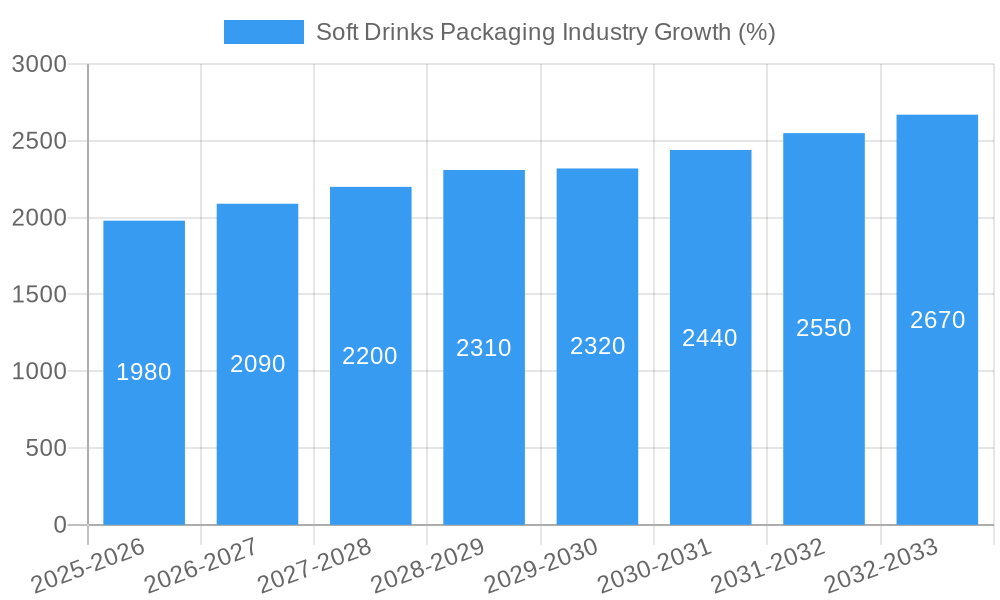
The global soft drinks packaging market, valued at approximately $XX million in 2025, is projected to experience robust growth, driven by a compound annual growth rate (CAGR) of 3.96% from 2025 to 2033. This expansion is fueled by several key factors. The rising consumption of soft drinks globally, particularly in developing economies, significantly contributes to increased demand for packaging solutions. Furthermore, the evolving consumer preferences towards convenient and sustainable packaging options are shaping market trends. This includes a growing demand for lightweight, recyclable materials like PET plastic and aluminum cans, as well as innovative packaging formats designed for enhanced shelf life and reduced environmental impact. The market segmentation reveals a strong preference for plastic and aluminum packaging materials due to their cost-effectiveness and suitability for high-speed filling lines. However, the increasing environmental concerns are driving manufacturers towards sustainable alternatives such as paper-based cartons and recyclable materials. This shift towards eco-friendly packaging necessitates substantial investments in research and development of innovative, sustainable materials and technologies. Competition among leading players such as CAN-PACK SA, Ardagh Group SA, Ball Corporation, and Amcor PLC is intense, with companies constantly innovating and expanding their product portfolios to meet the evolving demands of both consumers and brands. Geographical analysis indicates significant market potential in the Asia-Pacific region, driven by rapid economic growth and expanding middle-class populations. North America and Europe are also substantial markets, but growth rates might be slightly lower due to market maturity.
The restraints on market growth primarily involve fluctuating raw material prices, stringent environmental regulations, and the challenges associated with adopting sustainable packaging solutions at scale. Addressing these challenges requires collaborations across the supply chain, including material suppliers, packaging manufacturers, and beverage companies, to ensure the responsible and sustainable sourcing and utilization of packaging materials. Looking ahead, the industry's trajectory suggests a continuous focus on innovation, sustainability, and convenience. The development of lightweight, recyclable, and aesthetically appealing packaging solutions will be key to maintaining market growth and satisfying evolving consumer expectations. Furthermore, the increasing adoption of digital printing and smart packaging technologies provides opportunities for enhanced brand engagement and product traceability.
This insightful report provides a comprehensive analysis of the Soft Drinks Packaging Industry, projecting a market value of $XX Million by 2033. It covers the period 2019-2033, with a base year of 2025 and a forecast period of 2025-2033. This deep dive into market dynamics offers valuable insights for stakeholders seeking to navigate this evolving landscape.
Soft Drinks Packaging Industry Market Composition & Trends
This section analyzes the competitive landscape of the soft drinks packaging industry, examining market concentration, innovation drivers, regulatory shifts, substitute product threats, end-user profiles, and mergers and acquisitions (M&A) activity. The market is characterized by a moderately concentrated structure, with key players like Amcor PLC, Ball Corporation, and Crown Holdings Incorporated holding significant market share. However, smaller regional players also contribute substantially to the overall market volume.
- Market Share Distribution (2024): Amcor PLC (15%), Ball Corporation (12%), Crown Holdings Incorporated (10%), Others (63%).
- Innovation Catalysts: Sustainability initiatives, lightweighting technologies, and smart packaging solutions are driving significant innovation.
- Regulatory Landscape: Growing emphasis on recyclability and reduced plastic usage is shaping industry regulations globally.
- Substitute Products: While traditional materials (plastic, glass, metal) dominate, alternative materials like paper-based packaging are gaining traction.
- End-User Profiles: The primary end-users are soft drink manufacturers, with regional variations in packaging preferences.
- M&A Activity (2019-2024): Total M&A deal value estimated at $XX Million, indicating consolidation within the industry. Notable deals included acquisitions focused on expanding geographic reach and technological capabilities.
Soft Drinks Packaging Industry Industry Evolution
The soft drinks packaging industry has witnessed substantial growth over the past five years, driven by rising soft drink consumption and evolving consumer preferences. Technological advancements such as lightweighting, improved barrier properties, and enhanced printing techniques have played a crucial role in optimizing packaging efficiency and appeal. Shifting consumer demands toward sustainability are impacting packaging choices, pushing manufacturers to adopt eco-friendly materials and designs.
The market experienced a Compound Annual Growth Rate (CAGR) of XX% during the historical period (2019-2024) and is projected to grow at a CAGR of XX% during the forecast period (2025-2033). This growth is attributed to factors like increased demand for convenient packaging formats, rising disposable incomes in developing economies, and the growing popularity of ready-to-drink beverages. Adoption of sustainable packaging solutions, including recycled content, is also accelerating.
Leading Regions, Countries, or Segments in Soft Drinks Packaging Industry
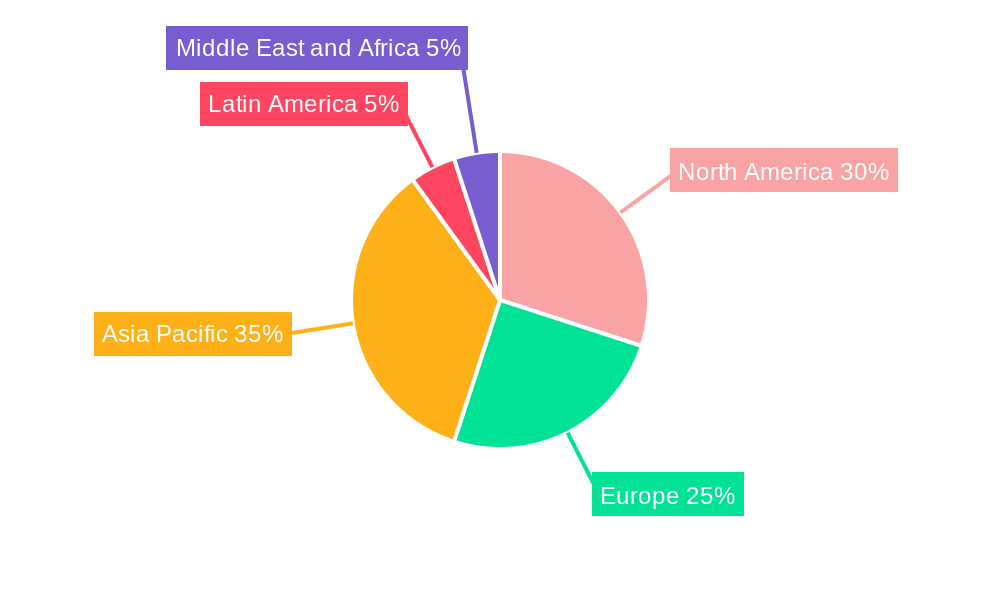
The global soft drinks packaging market is geographically diverse, with significant variations in material and product type preferences.
By Material:
- Plastic: Remains the dominant material due to its cost-effectiveness, versatility, and ease of processing. Key drivers include low production costs and widespread availability of raw materials.
- Metal: Aluminum cans hold a substantial share, particularly in the carbonated soft drinks segment. Drivers include recyclability and product protection.
- Glass: Maintains a strong presence, particularly for premium and niche beverages, driven by its perceived quality and sustainability.
- Paper and Paperboard: Growing rapidly due to increasing demand for sustainable packaging. Drivers include eco-consciousness and advancements in barrier coatings.
By Product Type:
- Bottles: Plastic bottles dominate due to their low cost and ease of production, although the trend is shifting towards recyclable and sustainable alternatives.
- Cans: Metal cans are prevalent in carbonated beverages due to their robust nature and recyclability.
- Cartons and Boxes: Paper-based cartons and boxes are gaining traction due to their sustainability.
Dominant Region: North America and Europe currently hold the largest market share, primarily due to high per capita soft drink consumption and established packaging infrastructure. However, Asia-Pacific is expected to experience rapid growth in the coming years.
Soft Drinks Packaging Industry Product Innovations
Recent innovations focus on enhanced sustainability, improved barrier properties, and enhanced consumer experience. Examples include lightweighting technologies that reduce material usage, the incorporation of recycled content, and the development of innovative closures that improve convenience and reduce waste. Smart packaging solutions with features like tamper-evident seals and interactive labels are also gaining traction, enhancing product security and improving consumer engagement. These innovations are driven by the need to meet evolving consumer demands and stringent environmental regulations.
Propelling Factors for Soft Drinks Packaging Growth
Several factors are driving the growth of the soft drinks packaging industry. Technological advancements like lightweighting and sustainable materials are reducing costs and environmental impact. Economic growth in emerging markets is boosting demand for packaged beverages. Stringent environmental regulations are pushing manufacturers to adopt eco-friendly packaging options, further fueling industry growth. For example, the EU's Single-Use Plastics Directive is driving innovation in recyclable and compostable packaging solutions.
Obstacles in the Soft Drinks Packaging Industry Market
The soft drinks packaging industry faces several challenges. Fluctuations in raw material prices, particularly for petroleum-based plastics, impact profitability. Supply chain disruptions can lead to production delays and increased costs. Intense competition and the need to constantly innovate to meet evolving consumer demands add to the pressure. Regulatory changes related to material composition and waste management can also create significant hurdles for manufacturers. For example, plastic taxes and extended producer responsibility schemes are imposing increased costs and compliance burdens.
Future Opportunities in Soft Drinks Packaging Industry
Future growth opportunities lie in developing sustainable and innovative packaging solutions. The rising demand for eco-friendly materials, such as plant-based plastics and biodegradable polymers, presents significant opportunities for manufacturers. Smart packaging technologies, offering enhanced functionalities such as tracking and temperature monitoring, will continue to gain traction. Expanding into emerging markets with growing soft drink consumption will also unlock considerable growth potential.
Major Players in the Soft Drinks Packaging Industry Ecosystem
- CAN-PACK SA
- Ardagh Group SA
- Ball Corporation
- Pacific Can China Holdings Limited
- Graham Packaging Company
- Amcor PLC
- Crown Holdings Incorporated
- CKS Packaging Inc
- Toyo Seikan Group Holdings Ltd
- Tetra Pak Inc
- Owens-Illinois Inc
- Refresco Group NV
Key Developments in Soft Drinks Packaging Industry
- December 2022: Amcor's collaboration with Licella Holdings to invest in an advanced plastic recycling facility in Australia signals a commitment to circular economy practices and increased recycled content in packaging.
- August 2022: Crown Holdings Incorporated's partnership with Socorro Bebidas to expand infinitely recyclable beverage cans showcases the growing demand for sustainable packaging options in the beverage industry.
Strategic Soft Drinks Packaging Industry Market Forecast
The soft drinks packaging industry is poised for continued growth, driven by increasing demand, innovative packaging solutions, and a growing focus on sustainability. The market's future success will depend on manufacturers' ability to adapt to evolving consumer preferences, adopt sustainable practices, and effectively manage supply chain challenges. The focus on circular economy principles and the development of innovative, eco-friendly packaging materials will be key drivers of growth in the coming years.
Soft Drinks Packaging Industry Segmentation
-
1. Material
- 1.1. Plastic
- 1.2. Metal
- 1.3. Glass
- 1.4. Paper and Paperboard
-
2. Product Type
- 2.1. Bottle
- 2.2. Can
- 2.3. Cartons and Boxes
Soft Drinks Packaging Industry Segmentation By Geography
-
1. North America
- 1.1. United States
- 1.2. Canada
-
2. Europe
- 2.1. Germany
- 2.2. United Kingdom
- 2.3. France
- 2.4. Spain
-
3. Asia Pacific
- 3.1. China
- 3.2. Japan
- 3.3. India
- 3.4. Australia
-
4. Latin America
- 4.1. Brazil
- 4.2. Mexico
- 4.3. Argentina
-
5. Middle East and Africa
- 5.1. Saudi Arabia
- 5.2. South Africa
- 5.3. United Arab Emirates
Soft Drinks Packaging Industry REPORT HIGHLIGHTS
| Aspects | Details |
|---|---|
| Study Period | 2019-2033 |
| Base Year | 2024 |
| Estimated Year | 2025 |
| Forecast Period | 2025-2033 |
| Historical Period | 2019-2024 |
| Growth Rate | CAGR of 3.96% from 2019-2033 |
| Segmentation |
|
Table of Contents
- 1. Introduction
- 1.1. Research Scope
- 1.2. Market Segmentation
- 1.3. Research Methodology
- 1.4. Definitions and Assumptions
- 2. Executive Summary
- 2.1. Introduction
- 3. Market Dynamics
- 3.1. Introduction
- 3.2. Market Drivers
- 3.2.1. Increasing Disposable Income and Growing Economies; Growing Demand for Ready-to-use Drinks
- 3.3. Market Restrains
- 3.3.1. Stringent Government Regulations Against Non-biodegradable Products
- 3.4. Market Trends
- 3.4.1. Plastic to Account for the Largest Market Share
- 4. Market Factor Analysis
- 4.1. Porters Five Forces
- 4.2. Supply/Value Chain
- 4.3. PESTEL analysis
- 4.4. Market Entropy
- 4.5. Patent/Trademark Analysis
- 5. Global Soft Drinks Packaging Industry Analysis, Insights and Forecast, 2019-2031
- 5.1. Market Analysis, Insights and Forecast - by Material
- 5.1.1. Plastic
- 5.1.2. Metal
- 5.1.3. Glass
- 5.1.4. Paper and Paperboard
- 5.2. Market Analysis, Insights and Forecast - by Product Type
- 5.2.1. Bottle
- 5.2.2. Can
- 5.2.3. Cartons and Boxes
- 5.3. Market Analysis, Insights and Forecast - by Region
- 5.3.1. North America
- 5.3.2. Europe
- 5.3.3. Asia Pacific
- 5.3.4. Latin America
- 5.3.5. Middle East and Africa
- 5.1. Market Analysis, Insights and Forecast - by Material
- 6. North America Soft Drinks Packaging Industry Analysis, Insights and Forecast, 2019-2031
- 6.1. Market Analysis, Insights and Forecast - by Material
- 6.1.1. Plastic
- 6.1.2. Metal
- 6.1.3. Glass
- 6.1.4. Paper and Paperboard
- 6.2. Market Analysis, Insights and Forecast - by Product Type
- 6.2.1. Bottle
- 6.2.2. Can
- 6.2.3. Cartons and Boxes
- 6.1. Market Analysis, Insights and Forecast - by Material
- 7. Europe Soft Drinks Packaging Industry Analysis, Insights and Forecast, 2019-2031
- 7.1. Market Analysis, Insights and Forecast - by Material
- 7.1.1. Plastic
- 7.1.2. Metal
- 7.1.3. Glass
- 7.1.4. Paper and Paperboard
- 7.2. Market Analysis, Insights and Forecast - by Product Type
- 7.2.1. Bottle
- 7.2.2. Can
- 7.2.3. Cartons and Boxes
- 7.1. Market Analysis, Insights and Forecast - by Material
- 8. Asia Pacific Soft Drinks Packaging Industry Analysis, Insights and Forecast, 2019-2031
- 8.1. Market Analysis, Insights and Forecast - by Material
- 8.1.1. Plastic
- 8.1.2. Metal
- 8.1.3. Glass
- 8.1.4. Paper and Paperboard
- 8.2. Market Analysis, Insights and Forecast - by Product Type
- 8.2.1. Bottle
- 8.2.2. Can
- 8.2.3. Cartons and Boxes
- 8.1. Market Analysis, Insights and Forecast - by Material
- 9. Latin America Soft Drinks Packaging Industry Analysis, Insights and Forecast, 2019-2031
- 9.1. Market Analysis, Insights and Forecast - by Material
- 9.1.1. Plastic
- 9.1.2. Metal
- 9.1.3. Glass
- 9.1.4. Paper and Paperboard
- 9.2. Market Analysis, Insights and Forecast - by Product Type
- 9.2.1. Bottle
- 9.2.2. Can
- 9.2.3. Cartons and Boxes
- 9.1. Market Analysis, Insights and Forecast - by Material
- 10. Middle East and Africa Soft Drinks Packaging Industry Analysis, Insights and Forecast, 2019-2031
- 10.1. Market Analysis, Insights and Forecast - by Material
- 10.1.1. Plastic
- 10.1.2. Metal
- 10.1.3. Glass
- 10.1.4. Paper and Paperboard
- 10.2. Market Analysis, Insights and Forecast - by Product Type
- 10.2.1. Bottle
- 10.2.2. Can
- 10.2.3. Cartons and Boxes
- 10.1. Market Analysis, Insights and Forecast - by Material
- 11. North America Soft Drinks Packaging Industry Analysis, Insights and Forecast, 2019-2031
- 11.1. Market Analysis, Insights and Forecast - By Country/Sub-region
- 11.1.1 United States
- 11.1.2 Canada
- 12. Europe Soft Drinks Packaging Industry Analysis, Insights and Forecast, 2019-2031
- 12.1. Market Analysis, Insights and Forecast - By Country/Sub-region
- 12.1.1 Germany
- 12.1.2 United Kingdom
- 12.1.3 France
- 12.1.4 Spain
- 13. Asia Pacific Soft Drinks Packaging Industry Analysis, Insights and Forecast, 2019-2031
- 13.1. Market Analysis, Insights and Forecast - By Country/Sub-region
- 13.1.1 China
- 13.1.2 Japan
- 13.1.3 India
- 13.1.4 Australia
- 14. Latin America Soft Drinks Packaging Industry Analysis, Insights and Forecast, 2019-2031
- 14.1. Market Analysis, Insights and Forecast - By Country/Sub-region
- 14.1.1 Brazil
- 14.1.2 Mexico
- 14.1.3 Argentina
- 15. Middle East and Africa Soft Drinks Packaging Industry Analysis, Insights and Forecast, 2019-2031
- 15.1. Market Analysis, Insights and Forecast - By Country/Sub-region
- 15.1.1 Saudi Arabia
- 15.1.2 South Africa
- 15.1.3 United Arab Emirates
- 16. Competitive Analysis
- 16.1. Global Market Share Analysis 2024
- 16.2. Company Profiles
- 16.2.1 CAN-PACK SA
- 16.2.1.1. Overview
- 16.2.1.2. Products
- 16.2.1.3. SWOT Analysis
- 16.2.1.4. Recent Developments
- 16.2.1.5. Financials (Based on Availability)
- 16.2.2 Ardagh Group SA*List Not Exhaustive
- 16.2.2.1. Overview
- 16.2.2.2. Products
- 16.2.2.3. SWOT Analysis
- 16.2.2.4. Recent Developments
- 16.2.2.5. Financials (Based on Availability)
- 16.2.3 Ball Corporation
- 16.2.3.1. Overview
- 16.2.3.2. Products
- 16.2.3.3. SWOT Analysis
- 16.2.3.4. Recent Developments
- 16.2.3.5. Financials (Based on Availability)
- 16.2.4 Pacific Can China Holdings Limited
- 16.2.4.1. Overview
- 16.2.4.2. Products
- 16.2.4.3. SWOT Analysis
- 16.2.4.4. Recent Developments
- 16.2.4.5. Financials (Based on Availability)
- 16.2.5 Graham Packaging Company
- 16.2.5.1. Overview
- 16.2.5.2. Products
- 16.2.5.3. SWOT Analysis
- 16.2.5.4. Recent Developments
- 16.2.5.5. Financials (Based on Availability)
- 16.2.6 Amcor PLC
- 16.2.6.1. Overview
- 16.2.6.2. Products
- 16.2.6.3. SWOT Analysis
- 16.2.6.4. Recent Developments
- 16.2.6.5. Financials (Based on Availability)
- 16.2.7 Crown Holdings Incorporated
- 16.2.7.1. Overview
- 16.2.7.2. Products
- 16.2.7.3. SWOT Analysis
- 16.2.7.4. Recent Developments
- 16.2.7.5. Financials (Based on Availability)
- 16.2.8 CKS Packaging Inc
- 16.2.8.1. Overview
- 16.2.8.2. Products
- 16.2.8.3. SWOT Analysis
- 16.2.8.4. Recent Developments
- 16.2.8.5. Financials (Based on Availability)
- 16.2.9 Toyo Seikan Group Holdings Ltd
- 16.2.9.1. Overview
- 16.2.9.2. Products
- 16.2.9.3. SWOT Analysis
- 16.2.9.4. Recent Developments
- 16.2.9.5. Financials (Based on Availability)
- 16.2.10 Tetra Pak Inc
- 16.2.10.1. Overview
- 16.2.10.2. Products
- 16.2.10.3. SWOT Analysis
- 16.2.10.4. Recent Developments
- 16.2.10.5. Financials (Based on Availability)
- 16.2.11 Owens-Illinois Inc
- 16.2.11.1. Overview
- 16.2.11.2. Products
- 16.2.11.3. SWOT Analysis
- 16.2.11.4. Recent Developments
- 16.2.11.5. Financials (Based on Availability)
- 16.2.12 Refresco Group NV
- 16.2.12.1. Overview
- 16.2.12.2. Products
- 16.2.12.3. SWOT Analysis
- 16.2.12.4. Recent Developments
- 16.2.12.5. Financials (Based on Availability)
- 16.2.1 CAN-PACK SA
List of Figures
- Figure 1: Global Soft Drinks Packaging Industry Revenue Breakdown (Million, %) by Region 2024 & 2032
- Figure 2: North America Soft Drinks Packaging Industry Revenue (Million), by Country 2024 & 2032
- Figure 3: North America Soft Drinks Packaging Industry Revenue Share (%), by Country 2024 & 2032
- Figure 4: Europe Soft Drinks Packaging Industry Revenue (Million), by Country 2024 & 2032
- Figure 5: Europe Soft Drinks Packaging Industry Revenue Share (%), by Country 2024 & 2032
- Figure 6: Asia Pacific Soft Drinks Packaging Industry Revenue (Million), by Country 2024 & 2032
- Figure 7: Asia Pacific Soft Drinks Packaging Industry Revenue Share (%), by Country 2024 & 2032
- Figure 8: Latin America Soft Drinks Packaging Industry Revenue (Million), by Country 2024 & 2032
- Figure 9: Latin America Soft Drinks Packaging Industry Revenue Share (%), by Country 2024 & 2032
- Figure 10: Middle East and Africa Soft Drinks Packaging Industry Revenue (Million), by Country 2024 & 2032
- Figure 11: Middle East and Africa Soft Drinks Packaging Industry Revenue Share (%), by Country 2024 & 2032
- Figure 12: North America Soft Drinks Packaging Industry Revenue (Million), by Material 2024 & 2032
- Figure 13: North America Soft Drinks Packaging Industry Revenue Share (%), by Material 2024 & 2032
- Figure 14: North America Soft Drinks Packaging Industry Revenue (Million), by Product Type 2024 & 2032
- Figure 15: North America Soft Drinks Packaging Industry Revenue Share (%), by Product Type 2024 & 2032
- Figure 16: North America Soft Drinks Packaging Industry Revenue (Million), by Country 2024 & 2032
- Figure 17: North America Soft Drinks Packaging Industry Revenue Share (%), by Country 2024 & 2032
- Figure 18: Europe Soft Drinks Packaging Industry Revenue (Million), by Material 2024 & 2032
- Figure 19: Europe Soft Drinks Packaging Industry Revenue Share (%), by Material 2024 & 2032
- Figure 20: Europe Soft Drinks Packaging Industry Revenue (Million), by Product Type 2024 & 2032
- Figure 21: Europe Soft Drinks Packaging Industry Revenue Share (%), by Product Type 2024 & 2032
- Figure 22: Europe Soft Drinks Packaging Industry Revenue (Million), by Country 2024 & 2032
- Figure 23: Europe Soft Drinks Packaging Industry Revenue Share (%), by Country 2024 & 2032
- Figure 24: Asia Pacific Soft Drinks Packaging Industry Revenue (Million), by Material 2024 & 2032
- Figure 25: Asia Pacific Soft Drinks Packaging Industry Revenue Share (%), by Material 2024 & 2032
- Figure 26: Asia Pacific Soft Drinks Packaging Industry Revenue (Million), by Product Type 2024 & 2032
- Figure 27: Asia Pacific Soft Drinks Packaging Industry Revenue Share (%), by Product Type 2024 & 2032
- Figure 28: Asia Pacific Soft Drinks Packaging Industry Revenue (Million), by Country 2024 & 2032
- Figure 29: Asia Pacific Soft Drinks Packaging Industry Revenue Share (%), by Country 2024 & 2032
- Figure 30: Latin America Soft Drinks Packaging Industry Revenue (Million), by Material 2024 & 2032
- Figure 31: Latin America Soft Drinks Packaging Industry Revenue Share (%), by Material 2024 & 2032
- Figure 32: Latin America Soft Drinks Packaging Industry Revenue (Million), by Product Type 2024 & 2032
- Figure 33: Latin America Soft Drinks Packaging Industry Revenue Share (%), by Product Type 2024 & 2032
- Figure 34: Latin America Soft Drinks Packaging Industry Revenue (Million), by Country 2024 & 2032
- Figure 35: Latin America Soft Drinks Packaging Industry Revenue Share (%), by Country 2024 & 2032
- Figure 36: Middle East and Africa Soft Drinks Packaging Industry Revenue (Million), by Material 2024 & 2032
- Figure 37: Middle East and Africa Soft Drinks Packaging Industry Revenue Share (%), by Material 2024 & 2032
- Figure 38: Middle East and Africa Soft Drinks Packaging Industry Revenue (Million), by Product Type 2024 & 2032
- Figure 39: Middle East and Africa Soft Drinks Packaging Industry Revenue Share (%), by Product Type 2024 & 2032
- Figure 40: Middle East and Africa Soft Drinks Packaging Industry Revenue (Million), by Country 2024 & 2032
- Figure 41: Middle East and Africa Soft Drinks Packaging Industry Revenue Share (%), by Country 2024 & 2032
List of Tables
- Table 1: Global Soft Drinks Packaging Industry Revenue Million Forecast, by Region 2019 & 2032
- Table 2: Global Soft Drinks Packaging Industry Revenue Million Forecast, by Material 2019 & 2032
- Table 3: Global Soft Drinks Packaging Industry Revenue Million Forecast, by Product Type 2019 & 2032
- Table 4: Global Soft Drinks Packaging Industry Revenue Million Forecast, by Region 2019 & 2032
- Table 5: Global Soft Drinks Packaging Industry Revenue Million Forecast, by Country 2019 & 2032
- Table 6: United States Soft Drinks Packaging Industry Revenue (Million) Forecast, by Application 2019 & 2032
- Table 7: Canada Soft Drinks Packaging Industry Revenue (Million) Forecast, by Application 2019 & 2032
- Table 8: Global Soft Drinks Packaging Industry Revenue Million Forecast, by Country 2019 & 2032
- Table 9: Germany Soft Drinks Packaging Industry Revenue (Million) Forecast, by Application 2019 & 2032
- Table 10: United Kingdom Soft Drinks Packaging Industry Revenue (Million) Forecast, by Application 2019 & 2032
- Table 11: France Soft Drinks Packaging Industry Revenue (Million) Forecast, by Application 2019 & 2032
- Table 12: Spain Soft Drinks Packaging Industry Revenue (Million) Forecast, by Application 2019 & 2032
- Table 13: Global Soft Drinks Packaging Industry Revenue Million Forecast, by Country 2019 & 2032
- Table 14: China Soft Drinks Packaging Industry Revenue (Million) Forecast, by Application 2019 & 2032
- Table 15: Japan Soft Drinks Packaging Industry Revenue (Million) Forecast, by Application 2019 & 2032
- Table 16: India Soft Drinks Packaging Industry Revenue (Million) Forecast, by Application 2019 & 2032
- Table 17: Australia Soft Drinks Packaging Industry Revenue (Million) Forecast, by Application 2019 & 2032
- Table 18: Global Soft Drinks Packaging Industry Revenue Million Forecast, by Country 2019 & 2032
- Table 19: Brazil Soft Drinks Packaging Industry Revenue (Million) Forecast, by Application 2019 & 2032
- Table 20: Mexico Soft Drinks Packaging Industry Revenue (Million) Forecast, by Application 2019 & 2032
- Table 21: Argentina Soft Drinks Packaging Industry Revenue (Million) Forecast, by Application 2019 & 2032
- Table 22: Global Soft Drinks Packaging Industry Revenue Million Forecast, by Country 2019 & 2032
- Table 23: Saudi Arabia Soft Drinks Packaging Industry Revenue (Million) Forecast, by Application 2019 & 2032
- Table 24: South Africa Soft Drinks Packaging Industry Revenue (Million) Forecast, by Application 2019 & 2032
- Table 25: United Arab Emirates Soft Drinks Packaging Industry Revenue (Million) Forecast, by Application 2019 & 2032
- Table 26: Global Soft Drinks Packaging Industry Revenue Million Forecast, by Material 2019 & 2032
- Table 27: Global Soft Drinks Packaging Industry Revenue Million Forecast, by Product Type 2019 & 2032
- Table 28: Global Soft Drinks Packaging Industry Revenue Million Forecast, by Country 2019 & 2032
- Table 29: United States Soft Drinks Packaging Industry Revenue (Million) Forecast, by Application 2019 & 2032
- Table 30: Canada Soft Drinks Packaging Industry Revenue (Million) Forecast, by Application 2019 & 2032
- Table 31: Global Soft Drinks Packaging Industry Revenue Million Forecast, by Material 2019 & 2032
- Table 32: Global Soft Drinks Packaging Industry Revenue Million Forecast, by Product Type 2019 & 2032
- Table 33: Global Soft Drinks Packaging Industry Revenue Million Forecast, by Country 2019 & 2032
- Table 34: Germany Soft Drinks Packaging Industry Revenue (Million) Forecast, by Application 2019 & 2032
- Table 35: United Kingdom Soft Drinks Packaging Industry Revenue (Million) Forecast, by Application 2019 & 2032
- Table 36: France Soft Drinks Packaging Industry Revenue (Million) Forecast, by Application 2019 & 2032
- Table 37: Spain Soft Drinks Packaging Industry Revenue (Million) Forecast, by Application 2019 & 2032
- Table 38: Global Soft Drinks Packaging Industry Revenue Million Forecast, by Material 2019 & 2032
- Table 39: Global Soft Drinks Packaging Industry Revenue Million Forecast, by Product Type 2019 & 2032
- Table 40: Global Soft Drinks Packaging Industry Revenue Million Forecast, by Country 2019 & 2032
- Table 41: China Soft Drinks Packaging Industry Revenue (Million) Forecast, by Application 2019 & 2032
- Table 42: Japan Soft Drinks Packaging Industry Revenue (Million) Forecast, by Application 2019 & 2032
- Table 43: India Soft Drinks Packaging Industry Revenue (Million) Forecast, by Application 2019 & 2032
- Table 44: Australia Soft Drinks Packaging Industry Revenue (Million) Forecast, by Application 2019 & 2032
- Table 45: Global Soft Drinks Packaging Industry Revenue Million Forecast, by Material 2019 & 2032
- Table 46: Global Soft Drinks Packaging Industry Revenue Million Forecast, by Product Type 2019 & 2032
- Table 47: Global Soft Drinks Packaging Industry Revenue Million Forecast, by Country 2019 & 2032
- Table 48: Brazil Soft Drinks Packaging Industry Revenue (Million) Forecast, by Application 2019 & 2032
- Table 49: Mexico Soft Drinks Packaging Industry Revenue (Million) Forecast, by Application 2019 & 2032
- Table 50: Argentina Soft Drinks Packaging Industry Revenue (Million) Forecast, by Application 2019 & 2032
- Table 51: Global Soft Drinks Packaging Industry Revenue Million Forecast, by Material 2019 & 2032
- Table 52: Global Soft Drinks Packaging Industry Revenue Million Forecast, by Product Type 2019 & 2032
- Table 53: Global Soft Drinks Packaging Industry Revenue Million Forecast, by Country 2019 & 2032
- Table 54: Saudi Arabia Soft Drinks Packaging Industry Revenue (Million) Forecast, by Application 2019 & 2032
- Table 55: South Africa Soft Drinks Packaging Industry Revenue (Million) Forecast, by Application 2019 & 2032
- Table 56: United Arab Emirates Soft Drinks Packaging Industry Revenue (Million) Forecast, by Application 2019 & 2032
Frequently Asked Questions
1. What is the projected Compound Annual Growth Rate (CAGR) of the Soft Drinks Packaging Industry?
The projected CAGR is approximately 3.96%.
2. Which companies are prominent players in the Soft Drinks Packaging Industry?
Key companies in the market include CAN-PACK SA, Ardagh Group SA*List Not Exhaustive, Ball Corporation, Pacific Can China Holdings Limited, Graham Packaging Company, Amcor PLC, Crown Holdings Incorporated, CKS Packaging Inc, Toyo Seikan Group Holdings Ltd, Tetra Pak Inc, Owens-Illinois Inc, Refresco Group NV.
3. What are the main segments of the Soft Drinks Packaging Industry?
The market segments include Material, Product Type.
4. Can you provide details about the market size?
The market size is estimated to be USD XX Million as of 2022.
5. What are some drivers contributing to market growth?
Increasing Disposable Income and Growing Economies; Growing Demand for Ready-to-use Drinks.
6. What are the notable trends driving market growth?
Plastic to Account for the Largest Market Share.
7. Are there any restraints impacting market growth?
Stringent Government Regulations Against Non-biodegradable Products.
8. Can you provide examples of recent developments in the market?
Dec 2022: Amcor announced a collaboration with Licella Holdings to invest in one of Australia's first plastic advanced recycling facilities, and the agreement supports Amcor and Licella's commitment to creating a local circular economy for soft plastics in Australia and helps promote Amcor's target to achieve 30% recycled content across its portfolio by 2030.
9. What pricing options are available for accessing the report?
Pricing options include single-user, multi-user, and enterprise licenses priced at USD 4750, USD 5250, and USD 8750 respectively.
10. Is the market size provided in terms of value or volume?
The market size is provided in terms of value, measured in Million.
11. Are there any specific market keywords associated with the report?
Yes, the market keyword associated with the report is "Soft Drinks Packaging Industry," which aids in identifying and referencing the specific market segment covered.
12. How do I determine which pricing option suits my needs best?
The pricing options vary based on user requirements and access needs. Individual users may opt for single-user licenses, while businesses requiring broader access may choose multi-user or enterprise licenses for cost-effective access to the report.
13. Are there any additional resources or data provided in the Soft Drinks Packaging Industry report?
While the report offers comprehensive insights, it's advisable to review the specific contents or supplementary materials provided to ascertain if additional resources or data are available.
14. How can I stay updated on further developments or reports in the Soft Drinks Packaging Industry?
To stay informed about further developments, trends, and reports in the Soft Drinks Packaging Industry, consider subscribing to industry newsletters, following relevant companies and organizations, or regularly checking reputable industry news sources and publications.
Methodology
Step 1 - Identification of Relevant Samples Size from Population Database


Step 2 - Approaches for Defining Global Market Size (Value, Volume* & Price*)

Note*: In applicable scenarios
Step 3 - Data Sources
Primary Research
- Web Analytics
- Survey Reports
- Research Institute
- Latest Research Reports
- Opinion Leaders
Secondary Research
- Annual Reports
- White Paper
- Latest Press Release
- Industry Association
- Paid Database
- Investor Presentations

Step 4 - Data Triangulation
Involves using different sources of information in order to increase the validity of a study
These sources are likely to be stakeholders in a program - participants, other researchers, program staff, other community members, and so on.
Then we put all data in single framework & apply various statistical tools to find out the dynamic on the market.
During the analysis stage, feedback from the stakeholder groups would be compared to determine areas of agreement as well as areas of divergence
