

Key Insights
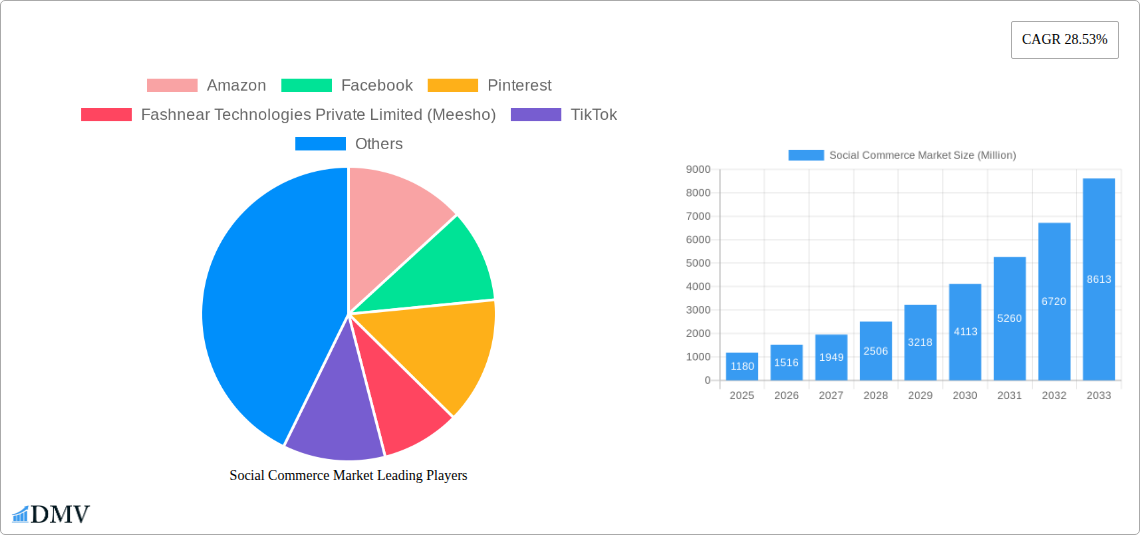
The social commerce market, valued at $1.18 billion in 2025, is experiencing explosive growth, projected to expand at a compound annual growth rate (CAGR) of 28.53% from 2025 to 2033. This surge is driven by several key factors. The increasing penetration of smartphones and internet access globally fuels wider adoption, particularly in emerging markets with large, digitally-savvy populations. Furthermore, the inherent trust and engagement fostered by social media platforms, combined with the convenience of integrating shopping directly into the user experience, creates a compelling value proposition. Influencer marketing and the rise of social selling strategies significantly contribute to market expansion, as do innovative features like live shopping streams and shoppable posts that streamline the purchase process. The diverse range of products offered, spanning personal care, apparel, and home goods, further broadens the market's appeal, catering to diverse consumer needs and preferences. While challenges exist, such as concerns around data privacy and security, the market's momentum is largely driven by these positive trends.
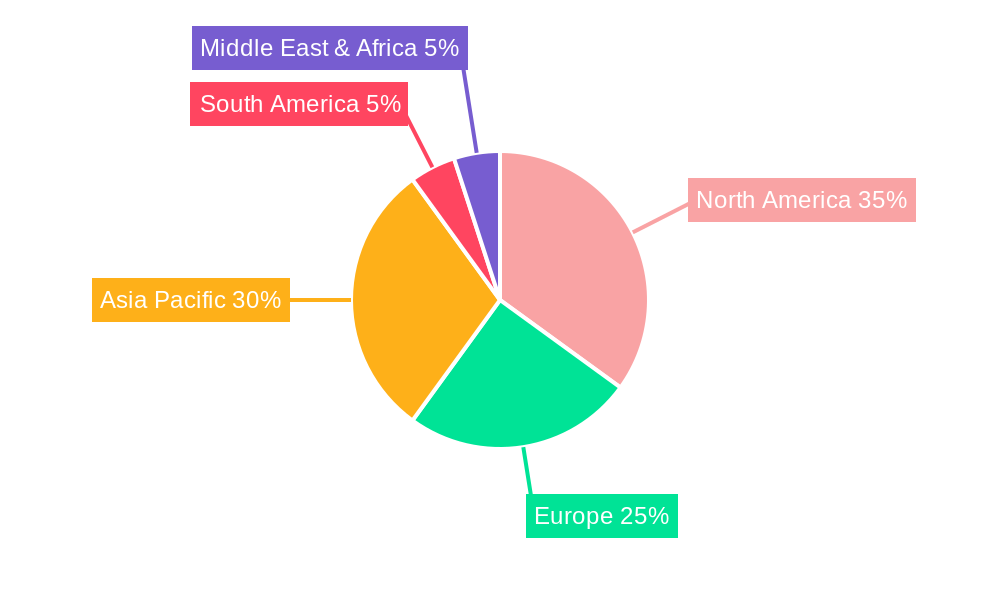
The market segmentation reveals significant opportunities across various models. B2C remains dominant, but the B2B and C2C segments are also showing robust growth, reflecting the versatile nature of social commerce for both businesses and individual sellers. Video commerce, social network-led commerce, and social reselling are the leading sales channels, highlighting the efficacy of visual content and community-driven approaches. The geographic distribution is diverse, with North America and Asia-Pacific expected to be key regions driving future market expansion, fueled by high internet penetration and adoption rates. However, substantial growth potential exists in other regions as digital infrastructure improves and consumer behavior adapts to online shopping. Companies like Amazon, Facebook, and TikTok are key players, leveraging their substantial user bases and technological capabilities to dominate market share, but the emergence of localized platforms and innovative startups also indicates a dynamic and competitive landscape.
Social Commerce Market Report: 2019-2033 Forecast
This comprehensive report provides a detailed analysis of the global social commerce market, encompassing its current state, future trajectory, and key players. We delve into market trends, technological advancements, and growth drivers, offering invaluable insights for stakeholders across the industry. The report covers the period from 2019 to 2033, with a focus on 2025 as the base and estimated year. The market is projected to reach xx Million by 2033, representing a substantial growth opportunity.
Social Commerce Market Composition & Trends
This section evaluates the competitive landscape of the social commerce market, focusing on market concentration, innovative technologies driving growth, evolving regulatory environments, substitute products, end-user profiles, and mergers & acquisitions (M&A) activity. We analyze the market share distribution amongst key players and examine the value of significant M&A deals. The social commerce landscape is dynamic, with significant shifts driven by technological innovation and evolving consumer preferences.
Market Concentration: The market exhibits a moderately concentrated structure, with a few dominant players like Amazon and Facebook holding substantial market share, while numerous smaller players compete for niche segments. Amazon's projected market share in 2025 is estimated at xx%. The remaining share is divided among players like Facebook, Pinterest, Meesho, TikTok, and others.
Innovation Catalysts: The integration of artificial intelligence (AI), augmented reality (AR), and short-form video content is revolutionizing the social commerce experience, enhancing product discovery and personalization. The rise of live shopping streams and influencer marketing further contributes to this dynamic environment.
Regulatory Landscape: Varying regulations across different geographies significantly impact social commerce operations, including data privacy, consumer protection, and advertising standards. Compliance and adaptation to regional regulations are crucial for success.
Substitute Products: Traditional e-commerce platforms pose a significant competitive threat, requiring social commerce businesses to constantly differentiate their offerings. The increasing adoption of social media platforms and the influence of social media personalities represent a potential shift in consumer behavior and buying habits.
End-User Profiles: Social commerce caters to a diverse range of consumers, from young adults to older demographics, each with specific purchasing behaviors and preferences. Understanding these nuances is crucial for targeted marketing and product development.
M&A Activities: The social commerce sector has witnessed several significant M&A deals in recent years, totaling an estimated xx Million in value during the historical period (2019-2024), primarily driven by the desire to expand market reach and integrate complementary technologies. We forecast an additional xx Million in M&A activity during the forecast period (2025-2033).
Social Commerce Market Industry Evolution
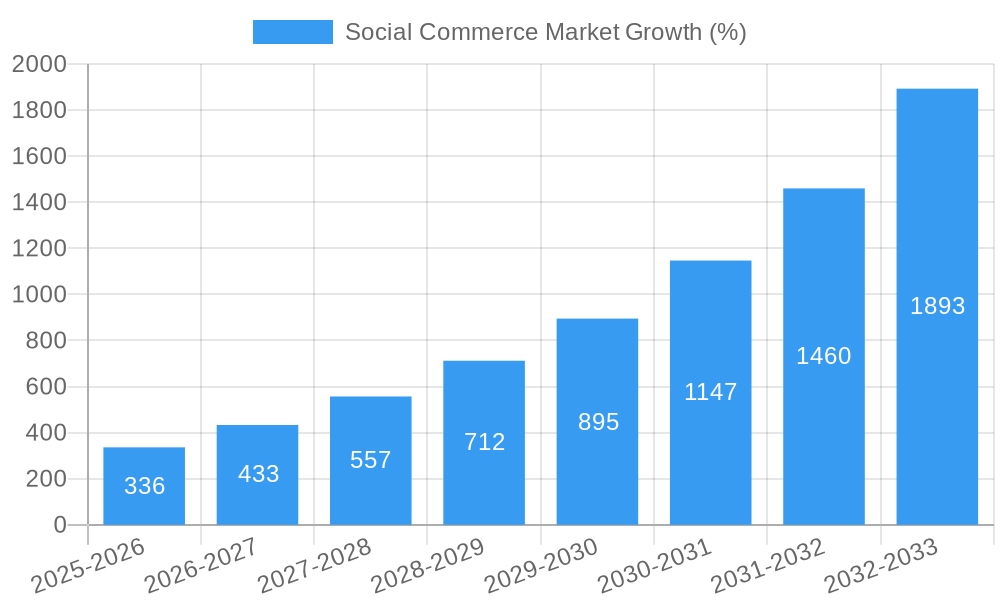
This section analyzes the historical and projected growth trajectories of the social commerce market, highlighting key technological advancements and the evolution of consumer behavior. We present data points on growth rates and adoption metrics. The market has experienced exponential growth driven by increased smartphone penetration, improved internet connectivity, and the growing influence of social media platforms.
The market's evolution is characterized by several key factors: the shift from desktop to mobile shopping, the integration of various technologies including AI, AR, and live streaming, and the growing adoption of social commerce by businesses of all sizes. The average annual growth rate (AAGR) during the historical period (2019-2024) was approximately xx%, with the B2C segment driving the majority of growth. We project an AAGR of xx% during the forecast period (2025-2033), driven by increasing consumer adoption and technological advancements. The adoption rate of social commerce among businesses is also projected to increase significantly, driven by the potential for improved customer engagement and sales growth. Consumer demand is shifting towards personalized shopping experiences, seamless integration with social media, and increased convenience and trust, aspects that are continually being addressed by social commerce innovations.
Leading Regions, Countries, or Segments in Social Commerce Market
This section identifies the leading regions, countries, and segments within the social commerce market, analyzing the factors contributing to their dominance. The analysis considers the Business Model (B2C, B2B, C2C), Product Type (Personal & Beauty Care, Apparel, Accessories, Home Products, Health Supplements, Food & Beverages, Other), and Sales Channel (Video Commerce, Social Network-Led Commerce, Social Reselling, Group Buying, Product Review Platforms).
Dominant Region: Asia-Pacific is expected to remain the leading region in 2025 due to high smartphone penetration, rapidly growing internet usage, and a large, young population actively engaged in social media. North America and Europe will follow, characterized by high consumer spending and established e-commerce infrastructure.
Dominant Country: China is expected to hold the largest market share in 2025, followed by the USA and India, due to factors such as extensive social media usage, favorable regulatory environments, and well-developed logistics networks.
Dominant Segments:
- By Business Model: B2C will dominate, accounting for the largest share in 2025, due to the high volume of individual consumer transactions.
- By Product Type: Apparel, accessories, and personal & beauty care are anticipated to be the leading product categories in 2025, driven by their suitability for visual display and strong online demand.
- By Sales Channel: Social network-led commerce and video commerce will likely maintain their dominance in 2025, leveraging the power of social media platforms and the engaging nature of video content.
Key Drivers:
- Investment Trends: Significant investments in social commerce platforms and technologies are fueling market growth in leading regions.
- Regulatory Support: Supportive regulatory environments, fostering innovation and facilitating market expansion, are crucial for growth.
Social Commerce Market Product Innovations
Recent innovations in social commerce include the integration of AR/VR technology for virtual try-ons, the rise of live-streaming shopping events, and the use of AI-powered recommendations to personalize the shopping experience. These innovations enhance user engagement, improve conversion rates, and provide unique selling propositions for social commerce platforms. Platforms are utilizing advanced analytics to refine targeting and optimize advertising campaigns, thereby increasing return on investment (ROI).
Propelling Factors for Social Commerce Market Growth
Several factors are driving the growth of the social commerce market. Technological advancements, such as the increasing sophistication of social media platforms and the integration of AI and AR, are transforming the shopping experience. Economic factors, including rising disposable incomes in emerging markets, also contribute to the increased adoption of social commerce. Favorable government policies and regulations are further supporting the growth of this sector. Examples include the recent partnerships between major e-commerce players and social media giants, aiming to create more integrated and seamless shopping experiences.
Obstacles in the Social Commerce Market
Despite the rapid growth, the social commerce market faces challenges. Regulatory hurdles, such as data privacy concerns and cross-border regulations, create complexities for businesses. Supply chain disruptions and logistics limitations can affect delivery times and customer satisfaction. Intense competition among established players and new entrants requires constant innovation and adaptation to maintain a competitive edge. These factors could potentially hinder market growth by an estimated xx% if not effectively addressed.
Future Opportunities in Social Commerce Market
The social commerce market presents several exciting future opportunities. The expansion into untapped markets, particularly in developing countries, holds significant potential. The integration of emerging technologies, such as the metaverse and blockchain, could create novel shopping experiences. Growing consumer demand for personalized and immersive shopping experiences will drive further innovation and growth in this dynamic sector.
Major Players in the Social Commerce Market Ecosystem
- Amazon
- Meesho (Fashnear Technologies Private Limited)
- TikTok
- YouTube
- Roposo
- Verint
Key Developments in Social Commerce Market Industry
- November 2023: Amazon partnered with Meta to revolutionize social commerce, integrating Amazon's platform with Meta's, creating a seamless shopping experience and boosting targeted advertising.
- April 2023: Amazon and Pinterest collaborated to deliver third-party ads on Pinterest, aiming to make every pin shoppable.
- December 2022: Amazon launched Inspire, a short-form video and photo feed enabling users to browse and shop from brand, influencer, and user-generated content.
Strategic Social Commerce Market Forecast
The social commerce market is poised for continued growth, driven by technological innovations, expanding consumer adoption, and strategic partnerships between key players. The integration of AI, AR, and other technologies will personalize shopping experiences, leading to higher conversion rates. The increasing popularity of live shopping and influencer marketing will further enhance engagement and drive sales. We anticipate a robust and sustained expansion throughout the forecast period, with the market experiencing significant growth across various segments and regions.
Social Commerce Market Segmentation
-
1. Business Model
- 1.1. Business to Consumer (B2C)
- 1.2. Business to Business (B2B)
- 1.3. Consumer to Consumer (C2C)
-
2. Product Type
- 2.1. Personal and Beauty Care
- 2.2. Apparel
- 2.3. Accessories
- 2.4. Home Products
- 2.5. Health Supplements
- 2.6. Food and Beverages
- 2.7. Other Product Types
-
3. Sales Channel
- 3.1. Video Commerce
- 3.2. Social Network-Led Commerce
- 3.3. Social Reselling
- 3.4. Group Buying
- 3.5. Product Review Platforms
Social Commerce Market Segmentation By Geography
-
1. North America
- 1.1. United States
- 1.2. Canada
- 1.3. Mexico
- 1.4. Rest of North America
-
2. Europe
- 2.1. United Kingdom
- 2.2. Germany
- 2.3. France
- 2.4. Russia
- 2.5. Italy
- 2.6. Spain
- 2.7. Rest of Europe
-
3. Asia Pacific
- 3.1. India
- 3.2. China
- 3.3. Japan
- 3.4. Australia
- 3.5. Rest of Asia Pacific
-
4. South America
- 4.1. Brazil
- 4.2. Argentina
- 4.3. Rest of South America
- 5. Middle East
-
6. United Arab Emirates
- 6.1. South Africa
- 6.2. Rest of Middle East
Social Commerce Market REPORT HIGHLIGHTS
| Aspects | Details |
|---|---|
| Study Period | 2019-2033 |
| Base Year | 2024 |
| Estimated Year | 2025 |
| Forecast Period | 2025-2033 |
| Historical Period | 2019-2024 |
| Growth Rate | CAGR of 28.53% from 2019-2033 |
| Segmentation |
|
Table of Contents
- 1. Introduction
- 1.1. Research Scope
- 1.2. Market Segmentation
- 1.3. Research Methodology
- 1.4. Definitions and Assumptions
- 2. Executive Summary
- 2.1. Introduction
- 3. Market Dynamics
- 3.1. Introduction
- 3.2. Market Drivers
- 3.2.1. Growing Number of Social Media Platforms; Shift in Consumer Preferences Toward Online Purchase
- 3.3. Market Restrains
- 3.3.1. Privacy Concerns Over Gathering and Using Personal Data; Intense Competition in the Social Commerce Space
- 3.4. Market Trends
- 3.4.1. Growing demand for business-to-consumer (B2C) social commerce is driving the market growth
- 4. Market Factor Analysis
- 4.1. Porters Five Forces
- 4.2. Supply/Value Chain
- 4.3. PESTEL analysis
- 4.4. Market Entropy
- 4.5. Patent/Trademark Analysis
- 5. Global Social Commerce Market Analysis, Insights and Forecast, 2019-2031
- 5.1. Market Analysis, Insights and Forecast - by Business Model
- 5.1.1. Business to Consumer (B2C)
- 5.1.2. Business to Business (B2B)
- 5.1.3. Consumer to Consumer (C2C)
- 5.2. Market Analysis, Insights and Forecast - by Product Type
- 5.2.1. Personal and Beauty Care
- 5.2.2. Apparel
- 5.2.3. Accessories
- 5.2.4. Home Products
- 5.2.5. Health Supplements
- 5.2.6. Food and Beverages
- 5.2.7. Other Product Types
- 5.3. Market Analysis, Insights and Forecast - by Sales Channel
- 5.3.1. Video Commerce
- 5.3.2. Social Network-Led Commerce
- 5.3.3. Social Reselling
- 5.3.4. Group Buying
- 5.3.5. Product Review Platforms
- 5.4. Market Analysis, Insights and Forecast - by Region
- 5.4.1. North America
- 5.4.2. Europe
- 5.4.3. Asia Pacific
- 5.4.4. South America
- 5.4.5. Middle East
- 5.4.6. United Arab Emirates
- 5.1. Market Analysis, Insights and Forecast - by Business Model
- 6. North America Social Commerce Market Analysis, Insights and Forecast, 2019-2031
- 6.1. Market Analysis, Insights and Forecast - by Business Model
- 6.1.1. Business to Consumer (B2C)
- 6.1.2. Business to Business (B2B)
- 6.1.3. Consumer to Consumer (C2C)
- 6.2. Market Analysis, Insights and Forecast - by Product Type
- 6.2.1. Personal and Beauty Care
- 6.2.2. Apparel
- 6.2.3. Accessories
- 6.2.4. Home Products
- 6.2.5. Health Supplements
- 6.2.6. Food and Beverages
- 6.2.7. Other Product Types
- 6.3. Market Analysis, Insights and Forecast - by Sales Channel
- 6.3.1. Video Commerce
- 6.3.2. Social Network-Led Commerce
- 6.3.3. Social Reselling
- 6.3.4. Group Buying
- 6.3.5. Product Review Platforms
- 6.1. Market Analysis, Insights and Forecast - by Business Model
- 7. Europe Social Commerce Market Analysis, Insights and Forecast, 2019-2031
- 7.1. Market Analysis, Insights and Forecast - by Business Model
- 7.1.1. Business to Consumer (B2C)
- 7.1.2. Business to Business (B2B)
- 7.1.3. Consumer to Consumer (C2C)
- 7.2. Market Analysis, Insights and Forecast - by Product Type
- 7.2.1. Personal and Beauty Care
- 7.2.2. Apparel
- 7.2.3. Accessories
- 7.2.4. Home Products
- 7.2.5. Health Supplements
- 7.2.6. Food and Beverages
- 7.2.7. Other Product Types
- 7.3. Market Analysis, Insights and Forecast - by Sales Channel
- 7.3.1. Video Commerce
- 7.3.2. Social Network-Led Commerce
- 7.3.3. Social Reselling
- 7.3.4. Group Buying
- 7.3.5. Product Review Platforms
- 7.1. Market Analysis, Insights and Forecast - by Business Model
- 8. Asia Pacific Social Commerce Market Analysis, Insights and Forecast, 2019-2031
- 8.1. Market Analysis, Insights and Forecast - by Business Model
- 8.1.1. Business to Consumer (B2C)
- 8.1.2. Business to Business (B2B)
- 8.1.3. Consumer to Consumer (C2C)
- 8.2. Market Analysis, Insights and Forecast - by Product Type
- 8.2.1. Personal and Beauty Care
- 8.2.2. Apparel
- 8.2.3. Accessories
- 8.2.4. Home Products
- 8.2.5. Health Supplements
- 8.2.6. Food and Beverages
- 8.2.7. Other Product Types
- 8.3. Market Analysis, Insights and Forecast - by Sales Channel
- 8.3.1. Video Commerce
- 8.3.2. Social Network-Led Commerce
- 8.3.3. Social Reselling
- 8.3.4. Group Buying
- 8.3.5. Product Review Platforms
- 8.1. Market Analysis, Insights and Forecast - by Business Model
- 9. South America Social Commerce Market Analysis, Insights and Forecast, 2019-2031
- 9.1. Market Analysis, Insights and Forecast - by Business Model
- 9.1.1. Business to Consumer (B2C)
- 9.1.2. Business to Business (B2B)
- 9.1.3. Consumer to Consumer (C2C)
- 9.2. Market Analysis, Insights and Forecast - by Product Type
- 9.2.1. Personal and Beauty Care
- 9.2.2. Apparel
- 9.2.3. Accessories
- 9.2.4. Home Products
- 9.2.5. Health Supplements
- 9.2.6. Food and Beverages
- 9.2.7. Other Product Types
- 9.3. Market Analysis, Insights and Forecast - by Sales Channel
- 9.3.1. Video Commerce
- 9.3.2. Social Network-Led Commerce
- 9.3.3. Social Reselling
- 9.3.4. Group Buying
- 9.3.5. Product Review Platforms
- 9.1. Market Analysis, Insights and Forecast - by Business Model
- 10. Middle East Social Commerce Market Analysis, Insights and Forecast, 2019-2031
- 10.1. Market Analysis, Insights and Forecast - by Business Model
- 10.1.1. Business to Consumer (B2C)
- 10.1.2. Business to Business (B2B)
- 10.1.3. Consumer to Consumer (C2C)
- 10.2. Market Analysis, Insights and Forecast - by Product Type
- 10.2.1. Personal and Beauty Care
- 10.2.2. Apparel
- 10.2.3. Accessories
- 10.2.4. Home Products
- 10.2.5. Health Supplements
- 10.2.6. Food and Beverages
- 10.2.7. Other Product Types
- 10.3. Market Analysis, Insights and Forecast - by Sales Channel
- 10.3.1. Video Commerce
- 10.3.2. Social Network-Led Commerce
- 10.3.3. Social Reselling
- 10.3.4. Group Buying
- 10.3.5. Product Review Platforms
- 10.1. Market Analysis, Insights and Forecast - by Business Model
- 11. United Arab Emirates Social Commerce Market Analysis, Insights and Forecast, 2019-2031
- 11.1. Market Analysis, Insights and Forecast - by Business Model
- 11.1.1. Business to Consumer (B2C)
- 11.1.2. Business to Business (B2B)
- 11.1.3. Consumer to Consumer (C2C)
- 11.2. Market Analysis, Insights and Forecast - by Product Type
- 11.2.1. Personal and Beauty Care
- 11.2.2. Apparel
- 11.2.3. Accessories
- 11.2.4. Home Products
- 11.2.5. Health Supplements
- 11.2.6. Food and Beverages
- 11.2.7. Other Product Types
- 11.3. Market Analysis, Insights and Forecast - by Sales Channel
- 11.3.1. Video Commerce
- 11.3.2. Social Network-Led Commerce
- 11.3.3. Social Reselling
- 11.3.4. Group Buying
- 11.3.5. Product Review Platforms
- 11.1. Market Analysis, Insights and Forecast - by Business Model
- 12. North America Social Commerce Market Analysis, Insights and Forecast, 2019-2031
- 12.1. Market Analysis, Insights and Forecast - By Country/Sub-region
- 12.1.1 United States
- 12.1.2 Canada
- 12.1.3 Mexico
- 12.1.4 Rest of North America
- 13. Europe Social Commerce Market Analysis, Insights and Forecast, 2019-2031
- 13.1. Market Analysis, Insights and Forecast - By Country/Sub-region
- 13.1.1 United Kingdom
- 13.1.2 Germany
- 13.1.3 France
- 13.1.4 Russia
- 13.1.5 Italy
- 13.1.6 Spain
- 13.1.7 Rest of Europe
- 14. Asia Pacific Social Commerce Market Analysis, Insights and Forecast, 2019-2031
- 14.1. Market Analysis, Insights and Forecast - By Country/Sub-region
- 14.1.1 India
- 14.1.2 China
- 14.1.3 Japan
- 14.1.4 Australia
- 14.1.5 Rest of Asia Pacific
- 15. South America Social Commerce Market Analysis, Insights and Forecast, 2019-2031
- 15.1. Market Analysis, Insights and Forecast - By Country/Sub-region
- 15.1.1 Brazil
- 15.1.2 Argentina
- 15.1.3 Rest of South America
- 16. Middle East Social Commerce Market Analysis, Insights and Forecast, 2019-2031
- 16.1. Market Analysis, Insights and Forecast - By Country/Sub-region
- 16.1.1.
- 17. United Arab Emirates Social Commerce Market Analysis, Insights and Forecast, 2019-2031
- 17.1. Market Analysis, Insights and Forecast - By Country/Sub-region
- 17.1.1 South Africa
- 17.1.2 Rest of Middle East
- 18. Competitive Analysis
- 18.1. Global Market Share Analysis 2024
- 18.2. Company Profiles
- 18.2.1 Amazon
- 18.2.1.1. Overview
- 18.2.1.2. Products
- 18.2.1.3. SWOT Analysis
- 18.2.1.4. Recent Developments
- 18.2.1.5. Financials (Based on Availability)
- 18.2.2 Facebook
- 18.2.2.1. Overview
- 18.2.2.2. Products
- 18.2.2.3. SWOT Analysis
- 18.2.2.4. Recent Developments
- 18.2.2.5. Financials (Based on Availability)
- 18.2.3 Pinterest
- 18.2.3.1. Overview
- 18.2.3.2. Products
- 18.2.3.3. SWOT Analysis
- 18.2.3.4. Recent Developments
- 18.2.3.5. Financials (Based on Availability)
- 18.2.4 Fashnear Technologies Private Limited (Meesho)
- 18.2.4.1. Overview
- 18.2.4.2. Products
- 18.2.4.3. SWOT Analysis
- 18.2.4.4. Recent Developments
- 18.2.4.5. Financials (Based on Availability)
- 18.2.5 TikTok
- 18.2.5.1. Overview
- 18.2.5.2. Products
- 18.2.5.3. SWOT Analysis
- 18.2.5.4. Recent Developments
- 18.2.5.5. Financials (Based on Availability)
- 18.2.6 Instagram
- 18.2.6.1. Overview
- 18.2.6.2. Products
- 18.2.6.3. SWOT Analysis
- 18.2.6.4. Recent Developments
- 18.2.6.5. Financials (Based on Availability)
- 18.2.7 Twitter**List Not Exhaustive
- 18.2.7.1. Overview
- 18.2.7.2. Products
- 18.2.7.3. SWOT Analysis
- 18.2.7.4. Recent Developments
- 18.2.7.5. Financials (Based on Availability)
- 18.2.8 YouTube
- 18.2.8.1. Overview
- 18.2.8.2. Products
- 18.2.8.3. SWOT Analysis
- 18.2.8.4. Recent Developments
- 18.2.8.5. Financials (Based on Availability)
- 18.2.9 Roposo
- 18.2.9.1. Overview
- 18.2.9.2. Products
- 18.2.9.3. SWOT Analysis
- 18.2.9.4. Recent Developments
- 18.2.9.5. Financials (Based on Availability)
- 18.2.10 Verint
- 18.2.10.1. Overview
- 18.2.10.2. Products
- 18.2.10.3. SWOT Analysis
- 18.2.10.4. Recent Developments
- 18.2.10.5. Financials (Based on Availability)
- 18.2.1 Amazon
List of Figures
- Figure 1: Global Social Commerce Market Revenue Breakdown (Million, %) by Region 2024 & 2032
- Figure 2: North America Social Commerce Market Revenue (Million), by Country 2024 & 2032
- Figure 3: North America Social Commerce Market Revenue Share (%), by Country 2024 & 2032
- Figure 4: Europe Social Commerce Market Revenue (Million), by Country 2024 & 2032
- Figure 5: Europe Social Commerce Market Revenue Share (%), by Country 2024 & 2032
- Figure 6: Asia Pacific Social Commerce Market Revenue (Million), by Country 2024 & 2032
- Figure 7: Asia Pacific Social Commerce Market Revenue Share (%), by Country 2024 & 2032
- Figure 8: South America Social Commerce Market Revenue (Million), by Country 2024 & 2032
- Figure 9: South America Social Commerce Market Revenue Share (%), by Country 2024 & 2032
- Figure 10: Middle East Social Commerce Market Revenue (Million), by Country 2024 & 2032
- Figure 11: Middle East Social Commerce Market Revenue Share (%), by Country 2024 & 2032
- Figure 12: United Arab Emirates Social Commerce Market Revenue (Million), by Country 2024 & 2032
- Figure 13: United Arab Emirates Social Commerce Market Revenue Share (%), by Country 2024 & 2032
- Figure 14: North America Social Commerce Market Revenue (Million), by Business Model 2024 & 2032
- Figure 15: North America Social Commerce Market Revenue Share (%), by Business Model 2024 & 2032
- Figure 16: North America Social Commerce Market Revenue (Million), by Product Type 2024 & 2032
- Figure 17: North America Social Commerce Market Revenue Share (%), by Product Type 2024 & 2032
- Figure 18: North America Social Commerce Market Revenue (Million), by Sales Channel 2024 & 2032
- Figure 19: North America Social Commerce Market Revenue Share (%), by Sales Channel 2024 & 2032
- Figure 20: North America Social Commerce Market Revenue (Million), by Country 2024 & 2032
- Figure 21: North America Social Commerce Market Revenue Share (%), by Country 2024 & 2032
- Figure 22: Europe Social Commerce Market Revenue (Million), by Business Model 2024 & 2032
- Figure 23: Europe Social Commerce Market Revenue Share (%), by Business Model 2024 & 2032
- Figure 24: Europe Social Commerce Market Revenue (Million), by Product Type 2024 & 2032
- Figure 25: Europe Social Commerce Market Revenue Share (%), by Product Type 2024 & 2032
- Figure 26: Europe Social Commerce Market Revenue (Million), by Sales Channel 2024 & 2032
- Figure 27: Europe Social Commerce Market Revenue Share (%), by Sales Channel 2024 & 2032
- Figure 28: Europe Social Commerce Market Revenue (Million), by Country 2024 & 2032
- Figure 29: Europe Social Commerce Market Revenue Share (%), by Country 2024 & 2032
- Figure 30: Asia Pacific Social Commerce Market Revenue (Million), by Business Model 2024 & 2032
- Figure 31: Asia Pacific Social Commerce Market Revenue Share (%), by Business Model 2024 & 2032
- Figure 32: Asia Pacific Social Commerce Market Revenue (Million), by Product Type 2024 & 2032
- Figure 33: Asia Pacific Social Commerce Market Revenue Share (%), by Product Type 2024 & 2032
- Figure 34: Asia Pacific Social Commerce Market Revenue (Million), by Sales Channel 2024 & 2032
- Figure 35: Asia Pacific Social Commerce Market Revenue Share (%), by Sales Channel 2024 & 2032
- Figure 36: Asia Pacific Social Commerce Market Revenue (Million), by Country 2024 & 2032
- Figure 37: Asia Pacific Social Commerce Market Revenue Share (%), by Country 2024 & 2032
- Figure 38: South America Social Commerce Market Revenue (Million), by Business Model 2024 & 2032
- Figure 39: South America Social Commerce Market Revenue Share (%), by Business Model 2024 & 2032
- Figure 40: South America Social Commerce Market Revenue (Million), by Product Type 2024 & 2032
- Figure 41: South America Social Commerce Market Revenue Share (%), by Product Type 2024 & 2032
- Figure 42: South America Social Commerce Market Revenue (Million), by Sales Channel 2024 & 2032
- Figure 43: South America Social Commerce Market Revenue Share (%), by Sales Channel 2024 & 2032
- Figure 44: South America Social Commerce Market Revenue (Million), by Country 2024 & 2032
- Figure 45: South America Social Commerce Market Revenue Share (%), by Country 2024 & 2032
- Figure 46: Middle East Social Commerce Market Revenue (Million), by Business Model 2024 & 2032
- Figure 47: Middle East Social Commerce Market Revenue Share (%), by Business Model 2024 & 2032
- Figure 48: Middle East Social Commerce Market Revenue (Million), by Product Type 2024 & 2032
- Figure 49: Middle East Social Commerce Market Revenue Share (%), by Product Type 2024 & 2032
- Figure 50: Middle East Social Commerce Market Revenue (Million), by Sales Channel 2024 & 2032
- Figure 51: Middle East Social Commerce Market Revenue Share (%), by Sales Channel 2024 & 2032
- Figure 52: Middle East Social Commerce Market Revenue (Million), by Country 2024 & 2032
- Figure 53: Middle East Social Commerce Market Revenue Share (%), by Country 2024 & 2032
- Figure 54: United Arab Emirates Social Commerce Market Revenue (Million), by Business Model 2024 & 2032
- Figure 55: United Arab Emirates Social Commerce Market Revenue Share (%), by Business Model 2024 & 2032
- Figure 56: United Arab Emirates Social Commerce Market Revenue (Million), by Product Type 2024 & 2032
- Figure 57: United Arab Emirates Social Commerce Market Revenue Share (%), by Product Type 2024 & 2032
- Figure 58: United Arab Emirates Social Commerce Market Revenue (Million), by Sales Channel 2024 & 2032
- Figure 59: United Arab Emirates Social Commerce Market Revenue Share (%), by Sales Channel 2024 & 2032
- Figure 60: United Arab Emirates Social Commerce Market Revenue (Million), by Country 2024 & 2032
- Figure 61: United Arab Emirates Social Commerce Market Revenue Share (%), by Country 2024 & 2032
List of Tables
- Table 1: Global Social Commerce Market Revenue Million Forecast, by Region 2019 & 2032
- Table 2: Global Social Commerce Market Revenue Million Forecast, by Business Model 2019 & 2032
- Table 3: Global Social Commerce Market Revenue Million Forecast, by Product Type 2019 & 2032
- Table 4: Global Social Commerce Market Revenue Million Forecast, by Sales Channel 2019 & 2032
- Table 5: Global Social Commerce Market Revenue Million Forecast, by Region 2019 & 2032
- Table 6: Global Social Commerce Market Revenue Million Forecast, by Country 2019 & 2032
- Table 7: United States Social Commerce Market Revenue (Million) Forecast, by Application 2019 & 2032
- Table 8: Canada Social Commerce Market Revenue (Million) Forecast, by Application 2019 & 2032
- Table 9: Mexico Social Commerce Market Revenue (Million) Forecast, by Application 2019 & 2032
- Table 10: Rest of North America Social Commerce Market Revenue (Million) Forecast, by Application 2019 & 2032
- Table 11: Global Social Commerce Market Revenue Million Forecast, by Country 2019 & 2032
- Table 12: United Kingdom Social Commerce Market Revenue (Million) Forecast, by Application 2019 & 2032
- Table 13: Germany Social Commerce Market Revenue (Million) Forecast, by Application 2019 & 2032
- Table 14: France Social Commerce Market Revenue (Million) Forecast, by Application 2019 & 2032
- Table 15: Russia Social Commerce Market Revenue (Million) Forecast, by Application 2019 & 2032
- Table 16: Italy Social Commerce Market Revenue (Million) Forecast, by Application 2019 & 2032
- Table 17: Spain Social Commerce Market Revenue (Million) Forecast, by Application 2019 & 2032
- Table 18: Rest of Europe Social Commerce Market Revenue (Million) Forecast, by Application 2019 & 2032
- Table 19: Global Social Commerce Market Revenue Million Forecast, by Country 2019 & 2032
- Table 20: India Social Commerce Market Revenue (Million) Forecast, by Application 2019 & 2032
- Table 21: China Social Commerce Market Revenue (Million) Forecast, by Application 2019 & 2032
- Table 22: Japan Social Commerce Market Revenue (Million) Forecast, by Application 2019 & 2032
- Table 23: Australia Social Commerce Market Revenue (Million) Forecast, by Application 2019 & 2032
- Table 24: Rest of Asia Pacific Social Commerce Market Revenue (Million) Forecast, by Application 2019 & 2032
- Table 25: Global Social Commerce Market Revenue Million Forecast, by Country 2019 & 2032
- Table 26: Brazil Social Commerce Market Revenue (Million) Forecast, by Application 2019 & 2032
- Table 27: Argentina Social Commerce Market Revenue (Million) Forecast, by Application 2019 & 2032
- Table 28: Rest of South America Social Commerce Market Revenue (Million) Forecast, by Application 2019 & 2032
- Table 29: Global Social Commerce Market Revenue Million Forecast, by Country 2019 & 2032
- Table 30: Social Commerce Market Revenue (Million) Forecast, by Application 2019 & 2032
- Table 31: Global Social Commerce Market Revenue Million Forecast, by Country 2019 & 2032
- Table 32: South Africa Social Commerce Market Revenue (Million) Forecast, by Application 2019 & 2032
- Table 33: Rest of Middle East Social Commerce Market Revenue (Million) Forecast, by Application 2019 & 2032
- Table 34: Global Social Commerce Market Revenue Million Forecast, by Business Model 2019 & 2032
- Table 35: Global Social Commerce Market Revenue Million Forecast, by Product Type 2019 & 2032
- Table 36: Global Social Commerce Market Revenue Million Forecast, by Sales Channel 2019 & 2032
- Table 37: Global Social Commerce Market Revenue Million Forecast, by Country 2019 & 2032
- Table 38: United States Social Commerce Market Revenue (Million) Forecast, by Application 2019 & 2032
- Table 39: Canada Social Commerce Market Revenue (Million) Forecast, by Application 2019 & 2032
- Table 40: Mexico Social Commerce Market Revenue (Million) Forecast, by Application 2019 & 2032
- Table 41: Rest of North America Social Commerce Market Revenue (Million) Forecast, by Application 2019 & 2032
- Table 42: Global Social Commerce Market Revenue Million Forecast, by Business Model 2019 & 2032
- Table 43: Global Social Commerce Market Revenue Million Forecast, by Product Type 2019 & 2032
- Table 44: Global Social Commerce Market Revenue Million Forecast, by Sales Channel 2019 & 2032
- Table 45: Global Social Commerce Market Revenue Million Forecast, by Country 2019 & 2032
- Table 46: United Kingdom Social Commerce Market Revenue (Million) Forecast, by Application 2019 & 2032
- Table 47: Germany Social Commerce Market Revenue (Million) Forecast, by Application 2019 & 2032
- Table 48: France Social Commerce Market Revenue (Million) Forecast, by Application 2019 & 2032
- Table 49: Russia Social Commerce Market Revenue (Million) Forecast, by Application 2019 & 2032
- Table 50: Italy Social Commerce Market Revenue (Million) Forecast, by Application 2019 & 2032
- Table 51: Spain Social Commerce Market Revenue (Million) Forecast, by Application 2019 & 2032
- Table 52: Rest of Europe Social Commerce Market Revenue (Million) Forecast, by Application 2019 & 2032
- Table 53: Global Social Commerce Market Revenue Million Forecast, by Business Model 2019 & 2032
- Table 54: Global Social Commerce Market Revenue Million Forecast, by Product Type 2019 & 2032
- Table 55: Global Social Commerce Market Revenue Million Forecast, by Sales Channel 2019 & 2032
- Table 56: Global Social Commerce Market Revenue Million Forecast, by Country 2019 & 2032
- Table 57: India Social Commerce Market Revenue (Million) Forecast, by Application 2019 & 2032
- Table 58: China Social Commerce Market Revenue (Million) Forecast, by Application 2019 & 2032
- Table 59: Japan Social Commerce Market Revenue (Million) Forecast, by Application 2019 & 2032
- Table 60: Australia Social Commerce Market Revenue (Million) Forecast, by Application 2019 & 2032
- Table 61: Rest of Asia Pacific Social Commerce Market Revenue (Million) Forecast, by Application 2019 & 2032
- Table 62: Global Social Commerce Market Revenue Million Forecast, by Business Model 2019 & 2032
- Table 63: Global Social Commerce Market Revenue Million Forecast, by Product Type 2019 & 2032
- Table 64: Global Social Commerce Market Revenue Million Forecast, by Sales Channel 2019 & 2032
- Table 65: Global Social Commerce Market Revenue Million Forecast, by Country 2019 & 2032
- Table 66: Brazil Social Commerce Market Revenue (Million) Forecast, by Application 2019 & 2032
- Table 67: Argentina Social Commerce Market Revenue (Million) Forecast, by Application 2019 & 2032
- Table 68: Rest of South America Social Commerce Market Revenue (Million) Forecast, by Application 2019 & 2032
- Table 69: Global Social Commerce Market Revenue Million Forecast, by Business Model 2019 & 2032
- Table 70: Global Social Commerce Market Revenue Million Forecast, by Product Type 2019 & 2032
- Table 71: Global Social Commerce Market Revenue Million Forecast, by Sales Channel 2019 & 2032
- Table 72: Global Social Commerce Market Revenue Million Forecast, by Country 2019 & 2032
- Table 73: Global Social Commerce Market Revenue Million Forecast, by Business Model 2019 & 2032
- Table 74: Global Social Commerce Market Revenue Million Forecast, by Product Type 2019 & 2032
- Table 75: Global Social Commerce Market Revenue Million Forecast, by Sales Channel 2019 & 2032
- Table 76: Global Social Commerce Market Revenue Million Forecast, by Country 2019 & 2032
- Table 77: South Africa Social Commerce Market Revenue (Million) Forecast, by Application 2019 & 2032
- Table 78: Rest of Middle East Social Commerce Market Revenue (Million) Forecast, by Application 2019 & 2032
Frequently Asked Questions
1. What is the projected Compound Annual Growth Rate (CAGR) of the Social Commerce Market?
The projected CAGR is approximately 28.53%.
2. Which companies are prominent players in the Social Commerce Market?
Key companies in the market include Amazon, Facebook, Pinterest, Fashnear Technologies Private Limited (Meesho), TikTok, Instagram, Twitter**List Not Exhaustive, YouTube, Roposo, Verint.
3. What are the main segments of the Social Commerce Market?
The market segments include Business Model, Product Type, Sales Channel.
4. Can you provide details about the market size?
The market size is estimated to be USD 1.18 Million as of 2022.
5. What are some drivers contributing to market growth?
Growing Number of Social Media Platforms; Shift in Consumer Preferences Toward Online Purchase.
6. What are the notable trends driving market growth?
Growing demand for business-to-consumer (B2C) social commerce is driving the market growth.
7. Are there any restraints impacting market growth?
Privacy Concerns Over Gathering and Using Personal Data; Intense Competition in the Social Commerce Space.
8. Can you provide examples of recent developments in the market?
November 2023: Amazon announced a partnership with Meta (Facebook’s parent company) to revolutionize social commerce. This collaboration aims to integrate Amazon’s e-commerce platform with Meta’s social media platform, providing shoppers with a seamless purchase experience and opening new opportunities for targeted advertising.
9. What pricing options are available for accessing the report?
Pricing options include single-user, multi-user, and enterprise licenses priced at USD 4750, USD 5250, and USD 8750 respectively.
10. Is the market size provided in terms of value or volume?
The market size is provided in terms of value, measured in Million.
11. Are there any specific market keywords associated with the report?
Yes, the market keyword associated with the report is "Social Commerce Market," which aids in identifying and referencing the specific market segment covered.
12. How do I determine which pricing option suits my needs best?
The pricing options vary based on user requirements and access needs. Individual users may opt for single-user licenses, while businesses requiring broader access may choose multi-user or enterprise licenses for cost-effective access to the report.
13. Are there any additional resources or data provided in the Social Commerce Market report?
While the report offers comprehensive insights, it's advisable to review the specific contents or supplementary materials provided to ascertain if additional resources or data are available.
14. How can I stay updated on further developments or reports in the Social Commerce Market?
To stay informed about further developments, trends, and reports in the Social Commerce Market, consider subscribing to industry newsletters, following relevant companies and organizations, or regularly checking reputable industry news sources and publications.
Methodology
Step 1 - Identification of Relevant Samples Size from Population Database


Step 2 - Approaches for Defining Global Market Size (Value, Volume* & Price*)

Note*: In applicable scenarios
Step 3 - Data Sources
Primary Research
- Web Analytics
- Survey Reports
- Research Institute
- Latest Research Reports
- Opinion Leaders
Secondary Research
- Annual Reports
- White Paper
- Latest Press Release
- Industry Association
- Paid Database
- Investor Presentations

Step 4 - Data Triangulation
Involves using different sources of information in order to increase the validity of a study
These sources are likely to be stakeholders in a program - participants, other researchers, program staff, other community members, and so on.
Then we put all data in single framework & apply various statistical tools to find out the dynamic on the market.
During the analysis stage, feedback from the stakeholder groups would be compared to determine areas of agreement as well as areas of divergence
