

Key Insights
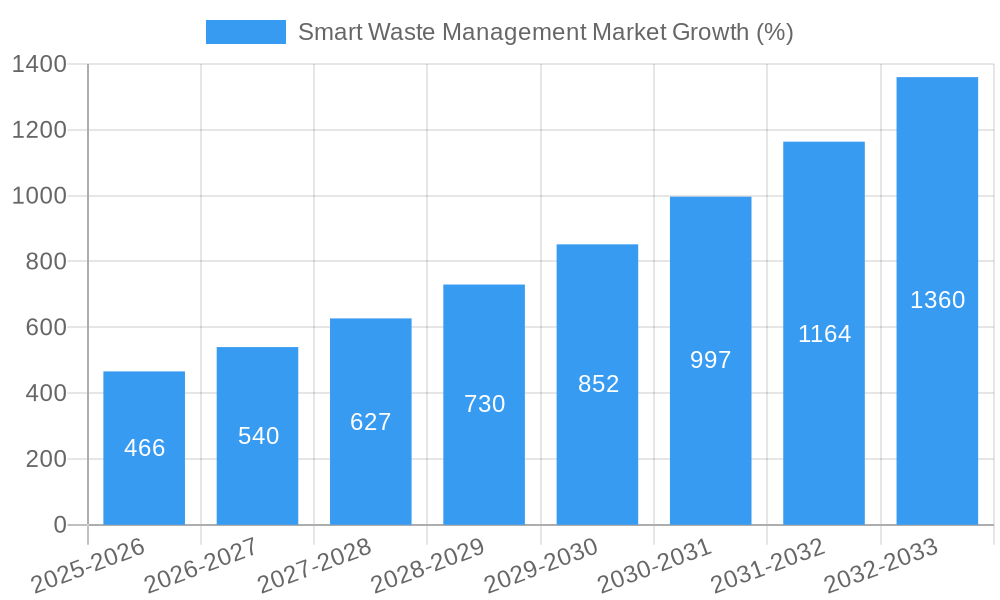
The smart waste management market is experiencing robust growth, projected to reach a market size of $3.08 billion in 2025 and maintain a Compound Annual Growth Rate (CAGR) of 15.08% from 2025 to 2033. This expansion is driven by several key factors. Increasing urbanization leads to escalating waste generation, necessitating efficient and sustainable waste management solutions. Smart waste management systems, leveraging technologies like IoT sensors, fleet management software, and data analytics, offer significant improvements in waste collection efficiency, reducing operational costs and environmental impact. Furthermore, growing environmental concerns and stricter regulations regarding waste disposal are pushing municipalities and private companies to adopt these advanced technologies. The rising adoption of smart bins equipped with fill-level sensors enables optimized routing and reduces fuel consumption, making the solution economically viable. The market segmentation reveals strong demand across various waste types, including industrial and residential waste, with fleet management and remote monitoring solutions being particularly popular.
The competitive landscape is dynamic, with established players like IBM, Veolia, and Waste Management Inc. alongside innovative companies like Enevo and Bigbelly Inc. These companies are actively investing in research and development to improve the functionalities and affordability of smart waste management solutions. Geographically, North America and Europe currently hold significant market share, driven by early adoption and developed infrastructure. However, the Asia-Pacific region is expected to witness substantial growth in the coming years, fueled by rapid urbanization and increasing government initiatives promoting sustainable waste management practices. The continued advancements in sensor technology, AI-powered analytics, and the integration of smart waste management into broader smart city initiatives will further propel market expansion throughout the forecast period. While challenges like high initial investment costs and the need for robust data infrastructure exist, the long-term benefits of improved efficiency, cost savings, and environmental sustainability are driving strong market adoption.

Smart Waste Management Market: A Comprehensive Market Report (2019-2033)
This insightful report provides a detailed analysis of the global Smart Waste Management Market, offering a comprehensive overview of its current state, future trajectory, and key players. Covering the period from 2019 to 2033, with 2025 as the base and estimated year, this report is an invaluable resource for stakeholders seeking to understand and capitalize on the opportunities within this rapidly evolving market. The market is expected to reach xx Million by 2033, growing at a CAGR of xx% during the forecast period (2025-2033).
Smart Waste Management Market Market Composition & Trends
The Smart Waste Management market is characterized by a moderately consolidated landscape, with key players such as IBM Corporation, Veolia Environmental Services, and Waste Management Inc. holding significant market share. However, the market is also witnessing increased participation from smaller, innovative companies, leading to a dynamic competitive environment. Market share distribution is estimated at xx% for the top 5 players in 2025, with a projected decrease to xx% by 2033 due to increased competition and market fragmentation. Innovation is driven by advancements in IoT, AI, and data analytics, enabling smarter waste collection, routing, and resource optimization. Stringent environmental regulations across the globe are further propelling market growth. Substitute products, while limited, include traditional waste management methods, but their inefficiency and environmental impact are increasingly driving the shift towards smart solutions. End-users include municipalities, industrial facilities, and residential communities, with municipalities currently accounting for the largest market share. M&A activity has been moderate, with deal values totaling approximately xx Million in the last five years. Key M&A activities include:
- Acquisition of [Company A] by [Company B] in [Year] for xx Million.
- Partnership between [Company C] and [Company D] in [Year] to develop a new smart waste solution.
Smart Waste Management Market Industry Evolution
The Smart Waste Management market has experienced significant growth over the past few years, driven by increasing urbanization, rising environmental concerns, and the need for efficient waste management solutions. Technological advancements, particularly in sensor technology, data analytics, and automation, have played a crucial role in this evolution. The market witnessed a growth rate of xx% from 2019 to 2024 and is projected to maintain a steady growth trajectory during the forecast period. The adoption of smart waste management solutions is rapidly increasing, particularly in developed countries, with adoption rates exceeding xx% in some regions. Consumer demand is shifting towards more sustainable and efficient waste management practices, leading to increased demand for smart solutions that minimize environmental impact. Furthermore, the rising popularity of smart cities initiatives is fueling the market's expansion. Specific data points include:
- Global smart waste management market size reached xx Million in 2024.
- The adoption rate of smart bins increased by xx% between 2020 and 2024.
- The market is expected to reach xx Million by 2033, exhibiting a CAGR of xx%.
Leading Regions, Countries, or Segments in Smart Waste Management Market
North America and Europe currently dominate the Smart Waste Management market, driven by high levels of technological advancement, strong environmental regulations, and substantial investments in smart city initiatives. Within these regions, urban areas exhibit the highest adoption rates.
- By Waste Type: Industrial waste currently holds a larger market share than residential waste, driven by higher waste volumes and stringent industrial regulations. However, the residential waste segment is expected to experience significant growth due to increasing urbanization and rising awareness of waste management.
- By Solution: Fleet management solutions are currently the most dominant segment, followed by remote monitoring and analytics solutions. The analytics segment is experiencing rapid growth due to the increasing need for data-driven insights to optimize waste management operations.
Key Drivers:
- North America: High technological advancement, robust regulatory framework, and significant investments in smart city projects.
- Europe: Strong environmental regulations, growing awareness of sustainability, and government initiatives promoting smart waste management.
- Asia-Pacific: Rapid urbanization, rising environmental concerns, and increasing adoption of smart city technologies.
Smart Waste Management Market Product Innovations
Recent innovations in smart waste management include the development of smart bins with advanced sensor technologies that monitor fill levels in real-time, optimizing collection routes and minimizing unnecessary trips. AI-powered analytics platforms are providing deeper insights into waste generation patterns, enabling proactive waste management strategies. These innovations offer unique selling propositions such as improved efficiency, reduced operational costs, and enhanced environmental sustainability, leading to better resource management and reduced greenhouse gas emissions.
Propelling Factors for Smart Waste Management Market Growth
Several factors are propelling the growth of the smart waste management market. Technological advancements, such as the Internet of Things (IoT) and artificial intelligence (AI), are creating more efficient and data-driven solutions. Stringent government regulations focused on environmental protection and waste reduction are pushing municipalities and industries to adopt smart waste management strategies. Furthermore, growing environmental awareness among consumers is driving demand for sustainable waste management practices. The economic benefits of reduced operational costs and improved resource efficiency are also contributing significantly to market expansion.
Obstacles in the Smart Waste Management Market Market
Despite its significant potential, the smart waste management market faces several challenges. High initial investment costs for implementing smart waste management systems can be a barrier for smaller municipalities and businesses. Integration challenges between different systems and platforms can hinder efficient data flow and analysis. Supply chain disruptions, particularly in the manufacturing of smart waste management technologies, can impact market growth. Moreover, competitive pressures among various vendors can lead to price wars and reduced profit margins.
Future Opportunities in Smart Waste Management Market
Future opportunities in the smart waste management market include the expansion into developing countries with rapidly growing urban populations. The development and deployment of more advanced sensor technologies, such as those employing AI and machine learning, are poised to drive further innovation. The increasing integration of smart waste management systems with other smart city infrastructure will open new avenues for market expansion. The growing demand for sustainable and circular economy solutions further presents significant opportunities for smart waste management businesses.
Major Players in the Smart Waste Management Market Ecosystem
- IBM Corporation
- Veolia Environmental Services
- Evoeco
- Covanta Holding Corporation
- Bigbelly Inc
- Waste Management Inc
- Enevo
- Pepperl+Fuchs GmbH
- BIN-
- SAP SE
Key Developments in Smart Waste Management Market Industry
- July 2023: Waste Management Inc. (WM) commenced operations at its new USD 35 Million renewable natural gas plant in Texas, showcasing investment in sustainable waste solutions.
- June 2023: The Indian government launched CITIIS 2.0, supporting blended waste management and climate-oriented reforms in 18 cities, signaling a significant push for smart waste management adoption in India.
Strategic Smart Waste Management Market Market Forecast
The Smart Waste Management market is poised for robust growth in the coming years, driven by technological advancements, stringent environmental regulations, and the increasing adoption of smart city initiatives. The market is expected to witness significant expansion in both developed and developing economies, with opportunities arising from the growing need for efficient, sustainable, and data-driven waste management solutions. The rising focus on circular economy principles will further propel market growth.
Smart Waste Management Market Segmentation
-
1. Solution
- 1.1. Fleet Management
- 1.2. Remote Monitoring
- 1.3. Analytics
-
2. Waste Type
- 2.1. Industrial Waste
- 2.2. Residential Waste
Smart Waste Management Market Segmentation By Geography
-
1. North America
- 1.1. United States
- 1.2. Canada
-
2. Europe
- 2.1. Germany
- 2.2. United Kingdom
- 2.3. France
- 2.4. Spain
- 2.5. Italy
-
3. Asia
- 3.1. India
- 3.2. China
- 3.3. Australia
- 3.4. Japan
- 3.5. Australia and New Zealand
- 4. Latin America
- 5. Middle East and Africa

Smart Waste Management Market REPORT HIGHLIGHTS
| Aspects | Details |
|---|---|
| Study Period | 2019-2033 |
| Base Year | 2024 |
| Estimated Year | 2025 |
| Forecast Period | 2025-2033 |
| Historical Period | 2019-2024 |
| Growth Rate | CAGR of 15.08% from 2019-2033 |
| Segmentation |
|
Table of Contents
- 1. Introduction
- 1.1. Research Scope
- 1.2. Market Segmentation
- 1.3. Research Methodology
- 1.4. Definitions and Assumptions
- 2. Executive Summary
- 2.1. Introduction
- 3. Market Dynamics
- 3.1. Introduction
- 3.2. Market Drivers
- 3.2.1. Increasing Volumes of Waste to Boost the Market; Rising Adoption of Smart Cities to Flourish the Market
- 3.3. Market Restrains
- 3.3.1. Cybersecurity Concerns and Data Security Breaches
- 3.4. Market Trends
- 3.4.1. Analytics Sector to Witness Major Growth
- 4. Market Factor Analysis
- 4.1. Porters Five Forces
- 4.2. Supply/Value Chain
- 4.3. PESTEL analysis
- 4.4. Market Entropy
- 4.5. Patent/Trademark Analysis
- 5. Global Smart Waste Management Market Analysis, Insights and Forecast, 2019-2031
- 5.1. Market Analysis, Insights and Forecast - by Solution
- 5.1.1. Fleet Management
- 5.1.2. Remote Monitoring
- 5.1.3. Analytics
- 5.2. Market Analysis, Insights and Forecast - by Waste Type
- 5.2.1. Industrial Waste
- 5.2.2. Residential Waste
- 5.3. Market Analysis, Insights and Forecast - by Region
- 5.3.1. North America
- 5.3.2. Europe
- 5.3.3. Asia
- 5.3.4. Latin America
- 5.3.5. Middle East and Africa
- 5.1. Market Analysis, Insights and Forecast - by Solution
- 6. North America Smart Waste Management Market Analysis, Insights and Forecast, 2019-2031
- 6.1. Market Analysis, Insights and Forecast - by Solution
- 6.1.1. Fleet Management
- 6.1.2. Remote Monitoring
- 6.1.3. Analytics
- 6.2. Market Analysis, Insights and Forecast - by Waste Type
- 6.2.1. Industrial Waste
- 6.2.2. Residential Waste
- 6.1. Market Analysis, Insights and Forecast - by Solution
- 7. Europe Smart Waste Management Market Analysis, Insights and Forecast, 2019-2031
- 7.1. Market Analysis, Insights and Forecast - by Solution
- 7.1.1. Fleet Management
- 7.1.2. Remote Monitoring
- 7.1.3. Analytics
- 7.2. Market Analysis, Insights and Forecast - by Waste Type
- 7.2.1. Industrial Waste
- 7.2.2. Residential Waste
- 7.1. Market Analysis, Insights and Forecast - by Solution
- 8. Asia Smart Waste Management Market Analysis, Insights and Forecast, 2019-2031
- 8.1. Market Analysis, Insights and Forecast - by Solution
- 8.1.1. Fleet Management
- 8.1.2. Remote Monitoring
- 8.1.3. Analytics
- 8.2. Market Analysis, Insights and Forecast - by Waste Type
- 8.2.1. Industrial Waste
- 8.2.2. Residential Waste
- 8.1. Market Analysis, Insights and Forecast - by Solution
- 9. Latin America Smart Waste Management Market Analysis, Insights and Forecast, 2019-2031
- 9.1. Market Analysis, Insights and Forecast - by Solution
- 9.1.1. Fleet Management
- 9.1.2. Remote Monitoring
- 9.1.3. Analytics
- 9.2. Market Analysis, Insights and Forecast - by Waste Type
- 9.2.1. Industrial Waste
- 9.2.2. Residential Waste
- 9.1. Market Analysis, Insights and Forecast - by Solution
- 10. Middle East and Africa Smart Waste Management Market Analysis, Insights and Forecast, 2019-2031
- 10.1. Market Analysis, Insights and Forecast - by Solution
- 10.1.1. Fleet Management
- 10.1.2. Remote Monitoring
- 10.1.3. Analytics
- 10.2. Market Analysis, Insights and Forecast - by Waste Type
- 10.2.1. Industrial Waste
- 10.2.2. Residential Waste
- 10.1. Market Analysis, Insights and Forecast - by Solution
- 11. North America Smart Waste Management Market Analysis, Insights and Forecast, 2019-2031
- 11.1. Market Analysis, Insights and Forecast - By Country/Sub-region
- 11.1.1 United States
- 11.1.2 Canada
- 12. Europe Smart Waste Management Market Analysis, Insights and Forecast, 2019-2031
- 12.1. Market Analysis, Insights and Forecast - By Country/Sub-region
- 12.1.1 Germany
- 12.1.2 United Kingdom
- 12.1.3 France
- 12.1.4 Spain
- 12.1.5 Italy
- 12.1.6 Rest of Europe
- 13. Asia Pacific Smart Waste Management Market Analysis, Insights and Forecast, 2019-2031
- 13.1. Market Analysis, Insights and Forecast - By Country/Sub-region
- 13.1.1 India
- 13.1.2 China
- 13.1.3 Australia
- 13.1.4 Japan
- 13.1.5 Rest of Asia Pacific
- 14. Rest of the World Smart Waste Management Market Analysis, Insights and Forecast, 2019-2031
- 14.1. Market Analysis, Insights and Forecast - By Country/Sub-region
- 14.1.1.
- 15. Competitive Analysis
- 15.1. Global Market Share Analysis 2024
- 15.2. Company Profiles
- 15.2.1 IBM Corporation
- 15.2.1.1. Overview
- 15.2.1.2. Products
- 15.2.1.3. SWOT Analysis
- 15.2.1.4. Recent Developments
- 15.2.1.5. Financials (Based on Availability)
- 15.2.2 Veolia Environmental Services
- 15.2.2.1. Overview
- 15.2.2.2. Products
- 15.2.2.3. SWOT Analysis
- 15.2.2.4. Recent Developments
- 15.2.2.5. Financials (Based on Availability)
- 15.2.3 Evoeco
- 15.2.3.1. Overview
- 15.2.3.2. Products
- 15.2.3.3. SWOT Analysis
- 15.2.3.4. Recent Developments
- 15.2.3.5. Financials (Based on Availability)
- 15.2.4 Covanta Holding Corporation
- 15.2.4.1. Overview
- 15.2.4.2. Products
- 15.2.4.3. SWOT Analysis
- 15.2.4.4. Recent Developments
- 15.2.4.5. Financials (Based on Availability)
- 15.2.5 Bigbelly Inc
- 15.2.5.1. Overview
- 15.2.5.2. Products
- 15.2.5.3. SWOT Analysis
- 15.2.5.4. Recent Developments
- 15.2.5.5. Financials (Based on Availability)
- 15.2.6 Waste Management Inc
- 15.2.6.1. Overview
- 15.2.6.2. Products
- 15.2.6.3. SWOT Analysis
- 15.2.6.4. Recent Developments
- 15.2.6.5. Financials (Based on Availability)
- 15.2.7 Enevo
- 15.2.7.1. Overview
- 15.2.7.2. Products
- 15.2.7.3. SWOT Analysis
- 15.2.7.4. Recent Developments
- 15.2.7.5. Financials (Based on Availability)
- 15.2.8 Pepperl+Fuchs GmbH
- 15.2.8.1. Overview
- 15.2.8.2. Products
- 15.2.8.3. SWOT Analysis
- 15.2.8.4. Recent Developments
- 15.2.8.5. Financials (Based on Availability)
- 15.2.9 BIN-
- 15.2.9.1. Overview
- 15.2.9.2. Products
- 15.2.9.3. SWOT Analysis
- 15.2.9.4. Recent Developments
- 15.2.9.5. Financials (Based on Availability)
- 15.2.10 SAP SE
- 15.2.10.1. Overview
- 15.2.10.2. Products
- 15.2.10.3. SWOT Analysis
- 15.2.10.4. Recent Developments
- 15.2.10.5. Financials (Based on Availability)
- 15.2.1 IBM Corporation
List of Figures
- Figure 1: Global Smart Waste Management Market Revenue Breakdown (Million, %) by Region 2024 & 2032
- Figure 2: North America Smart Waste Management Market Revenue (Million), by Country 2024 & 2032
- Figure 3: North America Smart Waste Management Market Revenue Share (%), by Country 2024 & 2032
- Figure 4: Europe Smart Waste Management Market Revenue (Million), by Country 2024 & 2032
- Figure 5: Europe Smart Waste Management Market Revenue Share (%), by Country 2024 & 2032
- Figure 6: Asia Pacific Smart Waste Management Market Revenue (Million), by Country 2024 & 2032
- Figure 7: Asia Pacific Smart Waste Management Market Revenue Share (%), by Country 2024 & 2032
- Figure 8: Rest of the World Smart Waste Management Market Revenue (Million), by Country 2024 & 2032
- Figure 9: Rest of the World Smart Waste Management Market Revenue Share (%), by Country 2024 & 2032
- Figure 10: North America Smart Waste Management Market Revenue (Million), by Solution 2024 & 2032
- Figure 11: North America Smart Waste Management Market Revenue Share (%), by Solution 2024 & 2032
- Figure 12: North America Smart Waste Management Market Revenue (Million), by Waste Type 2024 & 2032
- Figure 13: North America Smart Waste Management Market Revenue Share (%), by Waste Type 2024 & 2032
- Figure 14: North America Smart Waste Management Market Revenue (Million), by Country 2024 & 2032
- Figure 15: North America Smart Waste Management Market Revenue Share (%), by Country 2024 & 2032
- Figure 16: Europe Smart Waste Management Market Revenue (Million), by Solution 2024 & 2032
- Figure 17: Europe Smart Waste Management Market Revenue Share (%), by Solution 2024 & 2032
- Figure 18: Europe Smart Waste Management Market Revenue (Million), by Waste Type 2024 & 2032
- Figure 19: Europe Smart Waste Management Market Revenue Share (%), by Waste Type 2024 & 2032
- Figure 20: Europe Smart Waste Management Market Revenue (Million), by Country 2024 & 2032
- Figure 21: Europe Smart Waste Management Market Revenue Share (%), by Country 2024 & 2032
- Figure 22: Asia Smart Waste Management Market Revenue (Million), by Solution 2024 & 2032
- Figure 23: Asia Smart Waste Management Market Revenue Share (%), by Solution 2024 & 2032
- Figure 24: Asia Smart Waste Management Market Revenue (Million), by Waste Type 2024 & 2032
- Figure 25: Asia Smart Waste Management Market Revenue Share (%), by Waste Type 2024 & 2032
- Figure 26: Asia Smart Waste Management Market Revenue (Million), by Country 2024 & 2032
- Figure 27: Asia Smart Waste Management Market Revenue Share (%), by Country 2024 & 2032
- Figure 28: Latin America Smart Waste Management Market Revenue (Million), by Solution 2024 & 2032
- Figure 29: Latin America Smart Waste Management Market Revenue Share (%), by Solution 2024 & 2032
- Figure 30: Latin America Smart Waste Management Market Revenue (Million), by Waste Type 2024 & 2032
- Figure 31: Latin America Smart Waste Management Market Revenue Share (%), by Waste Type 2024 & 2032
- Figure 32: Latin America Smart Waste Management Market Revenue (Million), by Country 2024 & 2032
- Figure 33: Latin America Smart Waste Management Market Revenue Share (%), by Country 2024 & 2032
- Figure 34: Middle East and Africa Smart Waste Management Market Revenue (Million), by Solution 2024 & 2032
- Figure 35: Middle East and Africa Smart Waste Management Market Revenue Share (%), by Solution 2024 & 2032
- Figure 36: Middle East and Africa Smart Waste Management Market Revenue (Million), by Waste Type 2024 & 2032
- Figure 37: Middle East and Africa Smart Waste Management Market Revenue Share (%), by Waste Type 2024 & 2032
- Figure 38: Middle East and Africa Smart Waste Management Market Revenue (Million), by Country 2024 & 2032
- Figure 39: Middle East and Africa Smart Waste Management Market Revenue Share (%), by Country 2024 & 2032
List of Tables
- Table 1: Global Smart Waste Management Market Revenue Million Forecast, by Region 2019 & 2032
- Table 2: Global Smart Waste Management Market Revenue Million Forecast, by Solution 2019 & 2032
- Table 3: Global Smart Waste Management Market Revenue Million Forecast, by Waste Type 2019 & 2032
- Table 4: Global Smart Waste Management Market Revenue Million Forecast, by Region 2019 & 2032
- Table 5: Global Smart Waste Management Market Revenue Million Forecast, by Country 2019 & 2032
- Table 6: United States Smart Waste Management Market Revenue (Million) Forecast, by Application 2019 & 2032
- Table 7: Canada Smart Waste Management Market Revenue (Million) Forecast, by Application 2019 & 2032
- Table 8: Global Smart Waste Management Market Revenue Million Forecast, by Country 2019 & 2032
- Table 9: Germany Smart Waste Management Market Revenue (Million) Forecast, by Application 2019 & 2032
- Table 10: United Kingdom Smart Waste Management Market Revenue (Million) Forecast, by Application 2019 & 2032
- Table 11: France Smart Waste Management Market Revenue (Million) Forecast, by Application 2019 & 2032
- Table 12: Spain Smart Waste Management Market Revenue (Million) Forecast, by Application 2019 & 2032
- Table 13: Italy Smart Waste Management Market Revenue (Million) Forecast, by Application 2019 & 2032
- Table 14: Rest of Europe Smart Waste Management Market Revenue (Million) Forecast, by Application 2019 & 2032
- Table 15: Global Smart Waste Management Market Revenue Million Forecast, by Country 2019 & 2032
- Table 16: India Smart Waste Management Market Revenue (Million) Forecast, by Application 2019 & 2032
- Table 17: China Smart Waste Management Market Revenue (Million) Forecast, by Application 2019 & 2032
- Table 18: Australia Smart Waste Management Market Revenue (Million) Forecast, by Application 2019 & 2032
- Table 19: Japan Smart Waste Management Market Revenue (Million) Forecast, by Application 2019 & 2032
- Table 20: Rest of Asia Pacific Smart Waste Management Market Revenue (Million) Forecast, by Application 2019 & 2032
- Table 21: Global Smart Waste Management Market Revenue Million Forecast, by Country 2019 & 2032
- Table 22: Smart Waste Management Market Revenue (Million) Forecast, by Application 2019 & 2032
- Table 23: Global Smart Waste Management Market Revenue Million Forecast, by Solution 2019 & 2032
- Table 24: Global Smart Waste Management Market Revenue Million Forecast, by Waste Type 2019 & 2032
- Table 25: Global Smart Waste Management Market Revenue Million Forecast, by Country 2019 & 2032
- Table 26: United States Smart Waste Management Market Revenue (Million) Forecast, by Application 2019 & 2032
- Table 27: Canada Smart Waste Management Market Revenue (Million) Forecast, by Application 2019 & 2032
- Table 28: Global Smart Waste Management Market Revenue Million Forecast, by Solution 2019 & 2032
- Table 29: Global Smart Waste Management Market Revenue Million Forecast, by Waste Type 2019 & 2032
- Table 30: Global Smart Waste Management Market Revenue Million Forecast, by Country 2019 & 2032
- Table 31: Germany Smart Waste Management Market Revenue (Million) Forecast, by Application 2019 & 2032
- Table 32: United Kingdom Smart Waste Management Market Revenue (Million) Forecast, by Application 2019 & 2032
- Table 33: France Smart Waste Management Market Revenue (Million) Forecast, by Application 2019 & 2032
- Table 34: Spain Smart Waste Management Market Revenue (Million) Forecast, by Application 2019 & 2032
- Table 35: Italy Smart Waste Management Market Revenue (Million) Forecast, by Application 2019 & 2032
- Table 36: Global Smart Waste Management Market Revenue Million Forecast, by Solution 2019 & 2032
- Table 37: Global Smart Waste Management Market Revenue Million Forecast, by Waste Type 2019 & 2032
- Table 38: Global Smart Waste Management Market Revenue Million Forecast, by Country 2019 & 2032
- Table 39: India Smart Waste Management Market Revenue (Million) Forecast, by Application 2019 & 2032
- Table 40: China Smart Waste Management Market Revenue (Million) Forecast, by Application 2019 & 2032
- Table 41: Australia Smart Waste Management Market Revenue (Million) Forecast, by Application 2019 & 2032
- Table 42: Japan Smart Waste Management Market Revenue (Million) Forecast, by Application 2019 & 2032
- Table 43: Australia and New Zealand Smart Waste Management Market Revenue (Million) Forecast, by Application 2019 & 2032
- Table 44: Global Smart Waste Management Market Revenue Million Forecast, by Solution 2019 & 2032
- Table 45: Global Smart Waste Management Market Revenue Million Forecast, by Waste Type 2019 & 2032
- Table 46: Global Smart Waste Management Market Revenue Million Forecast, by Country 2019 & 2032
- Table 47: Global Smart Waste Management Market Revenue Million Forecast, by Solution 2019 & 2032
- Table 48: Global Smart Waste Management Market Revenue Million Forecast, by Waste Type 2019 & 2032
- Table 49: Global Smart Waste Management Market Revenue Million Forecast, by Country 2019 & 2032
Frequently Asked Questions
1. What is the projected Compound Annual Growth Rate (CAGR) of the Smart Waste Management Market?
The projected CAGR is approximately 15.08%.
2. Which companies are prominent players in the Smart Waste Management Market?
Key companies in the market include IBM Corporation, Veolia Environmental Services, Evoeco, Covanta Holding Corporation, Bigbelly Inc, Waste Management Inc, Enevo, Pepperl+Fuchs GmbH, BIN-, SAP SE.
3. What are the main segments of the Smart Waste Management Market?
The market segments include Solution, Waste Type.
4. Can you provide details about the market size?
The market size is estimated to be USD 3.08 Million as of 2022.
5. What are some drivers contributing to market growth?
Increasing Volumes of Waste to Boost the Market; Rising Adoption of Smart Cities to Flourish the Market.
6. What are the notable trends driving market growth?
Analytics Sector to Witness Major Growth.
7. Are there any restraints impacting market growth?
Cybersecurity Concerns and Data Security Breaches.
8. Can you provide examples of recent developments in the market?
July 2023 - WM began operations at its new USD 35 million, 14,500 square foot renewable natural gas plant located at the Texas-based company’s Eco Vista landfill, the company said in a news release. Construction on the new facility began two years ago, and the company plans to employ 125 construction workers and four workers to manage the facility, which will have a capacity of 14,500 square feet. The company said the new facility is expected to be fully operational by the end of May.
9. What pricing options are available for accessing the report?
Pricing options include single-user, multi-user, and enterprise licenses priced at USD 4750, USD 5250, and USD 8750 respectively.
10. Is the market size provided in terms of value or volume?
The market size is provided in terms of value, measured in Million.
11. Are there any specific market keywords associated with the report?
Yes, the market keyword associated with the report is "Smart Waste Management Market," which aids in identifying and referencing the specific market segment covered.
12. How do I determine which pricing option suits my needs best?
The pricing options vary based on user requirements and access needs. Individual users may opt for single-user licenses, while businesses requiring broader access may choose multi-user or enterprise licenses for cost-effective access to the report.
13. Are there any additional resources or data provided in the Smart Waste Management Market report?
While the report offers comprehensive insights, it's advisable to review the specific contents or supplementary materials provided to ascertain if additional resources or data are available.
14. How can I stay updated on further developments or reports in the Smart Waste Management Market?
To stay informed about further developments, trends, and reports in the Smart Waste Management Market, consider subscribing to industry newsletters, following relevant companies and organizations, or regularly checking reputable industry news sources and publications.
Methodology
Step 1 - Identification of Relevant Samples Size from Population Database


Step 2 - Approaches for Defining Global Market Size (Value, Volume* & Price*)

Note*: In applicable scenarios
Step 3 - Data Sources
Primary Research
- Web Analytics
- Survey Reports
- Research Institute
- Latest Research Reports
- Opinion Leaders
Secondary Research
- Annual Reports
- White Paper
- Latest Press Release
- Industry Association
- Paid Database
- Investor Presentations

Step 4 - Data Triangulation
Involves using different sources of information in order to increase the validity of a study
These sources are likely to be stakeholders in a program - participants, other researchers, program staff, other community members, and so on.
Then we put all data in single framework & apply various statistical tools to find out the dynamic on the market.
During the analysis stage, feedback from the stakeholder groups would be compared to determine areas of agreement as well as areas of divergence
