

Key Insights
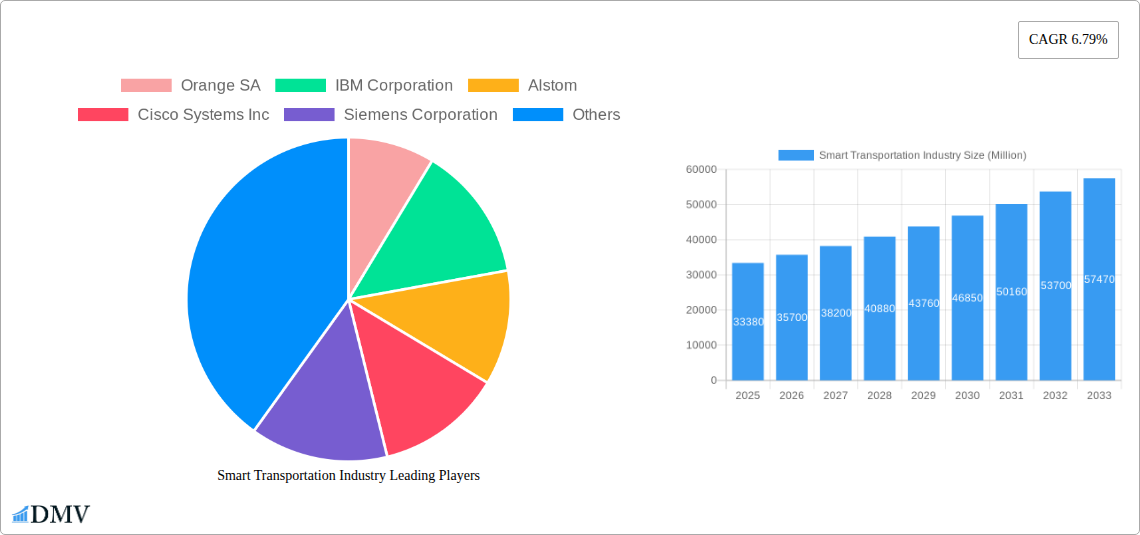
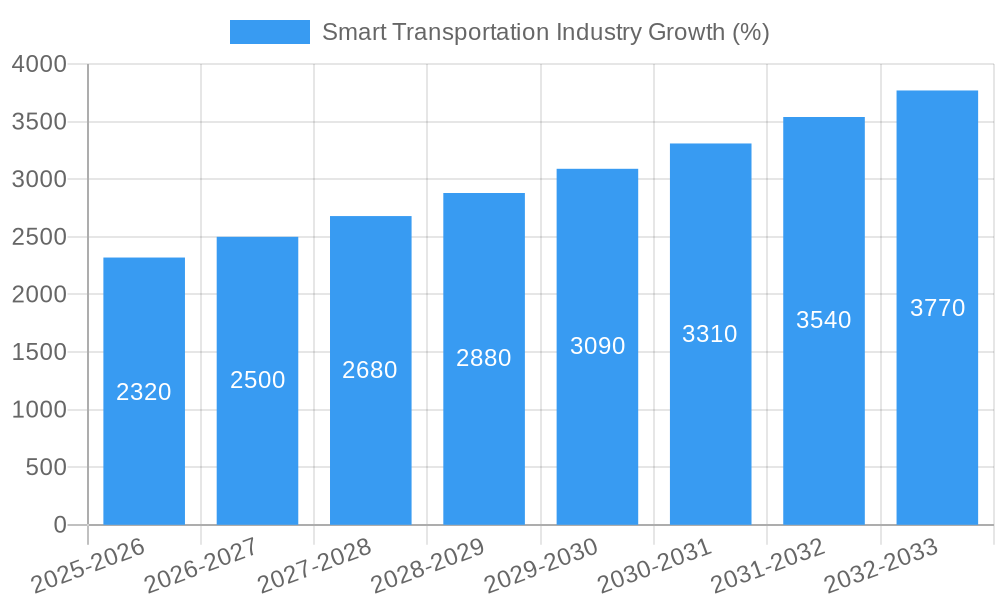
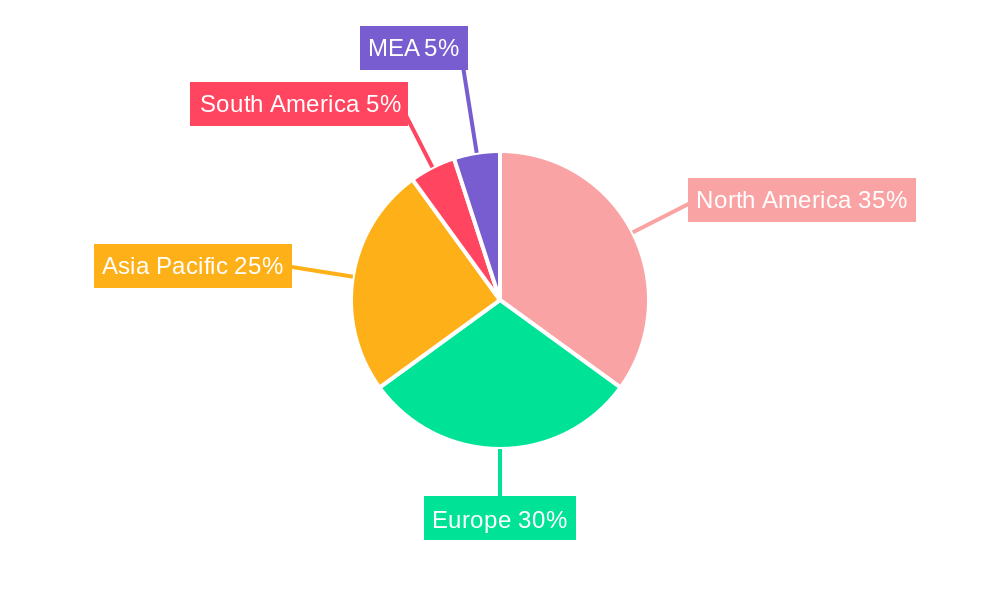
The global smart transportation market, valued at $33.38 billion in 2025, is projected to experience robust growth, driven by increasing urbanization, rising traffic congestion, and the urgent need for enhanced road safety and efficiency. A Compound Annual Growth Rate (CAGR) of 6.79% from 2025 to 2033 indicates a significant market expansion, reaching an estimated value exceeding $60 billion by 2033. Key growth drivers include the widespread adoption of Advanced Driver-Assistance Systems (ADAS), the burgeoning Internet of Things (IoT) in transportation, and government initiatives promoting sustainable and intelligent transportation solutions. The integration of technologies like Artificial Intelligence (AI), Machine Learning (ML), and big data analytics is revolutionizing traffic management, optimizing public transport, and improving overall transportation efficiency. Specific segments like Advanced Traveler Information Systems (ATIS) and Advanced Transportation Management Systems (ATMS) are experiencing particularly high demand, fueled by the need for real-time traffic information and optimized traffic flow management. However, challenges remain, including high initial investment costs for infrastructure upgrades, concerns about data privacy and security, and the need for robust cybersecurity measures to protect interconnected transportation systems. The market's geographical distribution reveals strong growth potential across North America, Europe, and the Asia-Pacific region, with significant investment in smart city initiatives and the development of intelligent transportation networks.
The competitive landscape is characterized by a mix of established technology companies and specialized transportation solution providers. Companies like IBM, Siemens, and Cisco are leveraging their expertise in data analytics and networking to offer integrated smart transportation solutions. Meanwhile, automotive manufacturers and telematics providers are actively contributing to the development and deployment of connected vehicle technologies. The market is also witnessing the emergence of innovative startups focusing on specific niche areas such as autonomous driving, smart parking solutions, and predictive maintenance. Future growth will depend on the continued development of innovative technologies, the establishment of robust regulatory frameworks, and the successful integration of smart transportation systems into existing infrastructure. Addressing data privacy and security concerns will be crucial for fostering wider adoption and public trust in these increasingly sophisticated systems.
Smart Transportation Industry Market Report: 2019-2033
This comprehensive report provides an in-depth analysis of the global smart transportation industry, projecting a market value exceeding $XX Million by 2033. The study covers the period from 2019 to 2033, with a focus on the forecast period of 2025-2033 and a base year of 2025. It offers invaluable insights for stakeholders, investors, and industry professionals seeking to navigate this rapidly evolving landscape.
Smart Transportation Industry Market Composition & Trends
This section meticulously analyzes the current state of the smart transportation market, evaluating its structure, dynamics, and future trajectory. The market is characterized by a moderately concentrated landscape, with key players like IBM Corporation, Orange SA, Siemens Corporation, and Cisco Systems Inc. holding significant market share. However, the entry of innovative startups and the ongoing consolidation through mergers and acquisitions (M&A) are reshaping the competitive dynamics. The total M&A deal value in the period 2019-2024 reached approximately $XX Million.
Market Concentration & Innovation:
- High concentration in ATMS and APTS segments driven by established players.
- Significant innovation in Cooperative Vehicle Systems (CVS) and ATIS.
- Start-ups driving innovation in niche applications like Parking Management and Freight.
Regulatory Landscape & Substitute Products:
- Stringent regulations promoting safety and data privacy are impacting market growth.
- Government incentives for electric vehicle adoption are fueling the demand for related technologies.
- Limited substitute products exist, though traditional transportation methods remain a competitor.
End-User Profiles & M&A Activities:
- Government agencies are major clients for ATMS and APTS.
- Private companies dominate the Automotive Telematics and Freight segments.
- M&A activity is focused on expanding technological capabilities and geographic reach. Deal values have increased by approximately XX% from 2019 to 2024.
Smart Transportation Industry Industry Evolution
The smart transportation industry has witnessed remarkable growth over the past few years, driven by several factors. From 2019 to 2024, the market grew at a CAGR of XX%, reaching a value of $XX Million in 2024. This expansion is fueled by increasing urbanization, growing concerns about traffic congestion and environmental sustainability, and significant advancements in technologies like AI, IoT, and 5G. The adoption rate of smart transportation solutions, particularly in developed economies, has seen a substantial rise, with over XX% of major cities implementing ATMS solutions. Furthermore, shifting consumer preferences towards convenient, efficient, and eco-friendly travel options are pushing the adoption of these technologies further. The forecast period (2025-2033) anticipates continued robust growth, with a projected CAGR of XX%, driven by the increasing deployment of connected and autonomous vehicles, the expansion of smart city initiatives, and the growing integration of various smart transportation systems. This will lead to a market valued at over $XX Million by 2033.
Leading Regions, Countries, or Segments in Smart Transportation Industry
North America and Europe currently dominate the smart transportation market, driven by high technological maturity, substantial investments, and supportive government regulations. However, Asia-Pacific is emerging as a rapidly expanding market, particularly in China and India, fuelled by significant infrastructure development and increasing government initiatives.
Dominant Segments (By Product Type):
- Advanced Transportation Management Systems (ATMS): High market share due to significant investment in traffic management and infrastructure optimization.
- Advanced Public Transportation Systems (APTS): Growing adoption driven by the need to improve efficiency and passenger experience in public transportation.
Dominant Segments (By Application):
- Traffic Management: Largest segment due to escalating congestion issues in urban areas.
- Public Transport: Strong growth fueled by initiatives to modernize and optimize public transport networks.
Key Drivers:
- Government funding and policies promoting smart city initiatives.
- Significant investments by both public and private sectors in technological advancements.
- Growing demand for improved safety, efficiency, and sustainability in transportation.
Smart Transportation Industry Product Innovations
Recent innovations include the integration of AI-powered predictive analytics for real-time traffic optimization, the development of advanced sensor technologies for enhanced road safety, and the implementation of blockchain technology for secure and transparent data management. These advancements are leading to more efficient, safer, and sustainable transportation systems. Unique selling propositions include improved traffic flow, reduced congestion, enhanced passenger experiences, and minimized environmental impact.
Propelling Factors for Smart Transportation Industry Growth
Technological advancements such as AI, IoT, and 5G are revolutionizing transportation, creating opportunities for efficient traffic management, predictive maintenance, and real-time data analysis. Government initiatives focused on sustainable transportation and smart city development provide further impetus. Economic factors, like increasing disposable incomes and urbanization, are driving demand for better transportation solutions. Regulations promoting safety and environmental sustainability create a regulatory framework that encourages innovation and adoption. For instance, the increasing adoption of electric buses, as exemplified by Hitachi ZeroCarbon Ltd.'s partnership with FirstGroup plc, reflects the growing push for environmentally friendly transportation.
Obstacles in the Smart Transportation Industry Market
High initial investment costs, data security and privacy concerns, and the complexity of integrating various systems pose significant challenges. Supply chain disruptions can lead to delays and increased costs, impacting project timelines. Furthermore, intense competition from established players and the emergence of new competitors creates pressure on profit margins.
Future Opportunities in Smart Transportation Industry
The emergence of autonomous vehicles and the increasing adoption of MaaS (Mobility as a Service) solutions will create vast new market opportunities. Advancements in AI and big data analytics will further enhance the capabilities of smart transportation systems. Expansion into developing economies presents significant growth potential.
Major Players in the Smart Transportation Industry Ecosystem
- Orange SA
- IBM Corporation
- Alstom
- Cisco Systems Inc
- Siemens Corporation
- AVEVA Group PLC
- Huawei Technologies Co Ltd
- Oracle Corporation
- Hitachi Ltd
- Advantech Co Ltd
- SAP SE
Key Developments in Smart Transportation Industry Industry
- November 2023: Hitachi ZeroCarbon Ltd. partners with FirstGroup plc to electrify UK bus fleets, improving air quality and reducing congestion.
- August 2023: NEC India collaborates with Mowasalat to implement smart transportation solutions for the FIFA World Cup in Qatar, enhancing the passenger experience for millions.
Strategic Smart Transportation Industry Market Forecast
The smart transportation market is poised for continued strong growth, driven by technological advancements, supportive government policies, and increasing consumer demand for efficient and sustainable transportation solutions. The projected market expansion will be fueled by the adoption of autonomous vehicles, MaaS solutions, and the integration of various smart city technologies, creating significant opportunities for both established players and new entrants. The market is expected to surpass $XX Million by 2033.
Smart Transportation Industry Segmentation
-
1. Application
- 1.1. Traffic Management
- 1.2. Road Safety and Security
- 1.3. Parking Management
- 1.4. Public Transport
- 1.5. Automotive Telematics
- 1.6. Freight
- 1.7. Other Applications
-
2. Product Type
- 2.1. Advanced Traveler Information Systems (ATIS)
- 2.2. Advanced Transportation Management Systems (ATMS)
- 2.3. Advanced Transportation Pricing Systems (ATPS)
- 2.4. Advanced Public Transportation Systems (APTS)
- 2.5. Cooperative Vehicle Systems
Smart Transportation Industry Segmentation By Geography
-
1. North America
- 1.1. United States
- 1.2. Canada
-
2. Europe
- 2.1. United Kingdom
- 2.2. Germany
- 2.3. France
-
3. Asia
- 3.1. China
- 3.2. Japan
- 4. Australia and New Zealand
-
5. Latin America
- 5.1. Mexico
- 5.2. Brazil
-
6. Middle East and Africa
- 6.1. United Arab Emirates
- 6.2. South Africa
- 6.3. Saudi Arabia
Smart Transportation Industry REPORT HIGHLIGHTS
| Aspects | Details |
|---|---|
| Study Period | 2019-2033 |
| Base Year | 2024 |
| Estimated Year | 2025 |
| Forecast Period | 2025-2033 |
| Historical Period | 2019-2024 |
| Growth Rate | CAGR of 6.79% from 2019-2033 |
| Segmentation |
|
Table of Contents
- 1. Introduction
- 1.1. Research Scope
- 1.2. Market Segmentation
- 1.3. Research Methodology
- 1.4. Definitions and Assumptions
- 2. Executive Summary
- 2.1. Introduction
- 3. Market Dynamics
- 3.1. Introduction
- 3.2. Market Drivers
- 3.2.1. Rise of Urbanization and Increasing Mega Cities and Increasing Population; Government Initiatives to Enhance the Transportation Infrastructure
- 3.3. Market Restrains
- 3.3.1. High Capital Required for Deployment
- 3.4. Market Trends
- 3.4.1 Rise of Urbanization
- 3.4.2 and Population would Drive the Market
- 4. Market Factor Analysis
- 4.1. Porters Five Forces
- 4.2. Supply/Value Chain
- 4.3. PESTEL analysis
- 4.4. Market Entropy
- 4.5. Patent/Trademark Analysis
- 5. Global Smart Transportation Industry Analysis, Insights and Forecast, 2019-2031
- 5.1. Market Analysis, Insights and Forecast - by Application
- 5.1.1. Traffic Management
- 5.1.2. Road Safety and Security
- 5.1.3. Parking Management
- 5.1.4. Public Transport
- 5.1.5. Automotive Telematics
- 5.1.6. Freight
- 5.1.7. Other Applications
- 5.2. Market Analysis, Insights and Forecast - by Product Type
- 5.2.1. Advanced Traveler Information Systems (ATIS)
- 5.2.2. Advanced Transportation Management Systems (ATMS)
- 5.2.3. Advanced Transportation Pricing Systems (ATPS)
- 5.2.4. Advanced Public Transportation Systems (APTS)
- 5.2.5. Cooperative Vehicle Systems
- 5.3. Market Analysis, Insights and Forecast - by Region
- 5.3.1. North America
- 5.3.2. Europe
- 5.3.3. Asia
- 5.3.4. Australia and New Zealand
- 5.3.5. Latin America
- 5.3.6. Middle East and Africa
- 5.1. Market Analysis, Insights and Forecast - by Application
- 6. North America Smart Transportation Industry Analysis, Insights and Forecast, 2019-2031
- 6.1. Market Analysis, Insights and Forecast - by Application
- 6.1.1. Traffic Management
- 6.1.2. Road Safety and Security
- 6.1.3. Parking Management
- 6.1.4. Public Transport
- 6.1.5. Automotive Telematics
- 6.1.6. Freight
- 6.1.7. Other Applications
- 6.2. Market Analysis, Insights and Forecast - by Product Type
- 6.2.1. Advanced Traveler Information Systems (ATIS)
- 6.2.2. Advanced Transportation Management Systems (ATMS)
- 6.2.3. Advanced Transportation Pricing Systems (ATPS)
- 6.2.4. Advanced Public Transportation Systems (APTS)
- 6.2.5. Cooperative Vehicle Systems
- 6.1. Market Analysis, Insights and Forecast - by Application
- 7. Europe Smart Transportation Industry Analysis, Insights and Forecast, 2019-2031
- 7.1. Market Analysis, Insights and Forecast - by Application
- 7.1.1. Traffic Management
- 7.1.2. Road Safety and Security
- 7.1.3. Parking Management
- 7.1.4. Public Transport
- 7.1.5. Automotive Telematics
- 7.1.6. Freight
- 7.1.7. Other Applications
- 7.2. Market Analysis, Insights and Forecast - by Product Type
- 7.2.1. Advanced Traveler Information Systems (ATIS)
- 7.2.2. Advanced Transportation Management Systems (ATMS)
- 7.2.3. Advanced Transportation Pricing Systems (ATPS)
- 7.2.4. Advanced Public Transportation Systems (APTS)
- 7.2.5. Cooperative Vehicle Systems
- 7.1. Market Analysis, Insights and Forecast - by Application
- 8. Asia Smart Transportation Industry Analysis, Insights and Forecast, 2019-2031
- 8.1. Market Analysis, Insights and Forecast - by Application
- 8.1.1. Traffic Management
- 8.1.2. Road Safety and Security
- 8.1.3. Parking Management
- 8.1.4. Public Transport
- 8.1.5. Automotive Telematics
- 8.1.6. Freight
- 8.1.7. Other Applications
- 8.2. Market Analysis, Insights and Forecast - by Product Type
- 8.2.1. Advanced Traveler Information Systems (ATIS)
- 8.2.2. Advanced Transportation Management Systems (ATMS)
- 8.2.3. Advanced Transportation Pricing Systems (ATPS)
- 8.2.4. Advanced Public Transportation Systems (APTS)
- 8.2.5. Cooperative Vehicle Systems
- 8.1. Market Analysis, Insights and Forecast - by Application
- 9. Australia and New Zealand Smart Transportation Industry Analysis, Insights and Forecast, 2019-2031
- 9.1. Market Analysis, Insights and Forecast - by Application
- 9.1.1. Traffic Management
- 9.1.2. Road Safety and Security
- 9.1.3. Parking Management
- 9.1.4. Public Transport
- 9.1.5. Automotive Telematics
- 9.1.6. Freight
- 9.1.7. Other Applications
- 9.2. Market Analysis, Insights and Forecast - by Product Type
- 9.2.1. Advanced Traveler Information Systems (ATIS)
- 9.2.2. Advanced Transportation Management Systems (ATMS)
- 9.2.3. Advanced Transportation Pricing Systems (ATPS)
- 9.2.4. Advanced Public Transportation Systems (APTS)
- 9.2.5. Cooperative Vehicle Systems
- 9.1. Market Analysis, Insights and Forecast - by Application
- 10. Latin America Smart Transportation Industry Analysis, Insights and Forecast, 2019-2031
- 10.1. Market Analysis, Insights and Forecast - by Application
- 10.1.1. Traffic Management
- 10.1.2. Road Safety and Security
- 10.1.3. Parking Management
- 10.1.4. Public Transport
- 10.1.5. Automotive Telematics
- 10.1.6. Freight
- 10.1.7. Other Applications
- 10.2. Market Analysis, Insights and Forecast - by Product Type
- 10.2.1. Advanced Traveler Information Systems (ATIS)
- 10.2.2. Advanced Transportation Management Systems (ATMS)
- 10.2.3. Advanced Transportation Pricing Systems (ATPS)
- 10.2.4. Advanced Public Transportation Systems (APTS)
- 10.2.5. Cooperative Vehicle Systems
- 10.1. Market Analysis, Insights and Forecast - by Application
- 11. Middle East and Africa Smart Transportation Industry Analysis, Insights and Forecast, 2019-2031
- 11.1. Market Analysis, Insights and Forecast - by Application
- 11.1.1. Traffic Management
- 11.1.2. Road Safety and Security
- 11.1.3. Parking Management
- 11.1.4. Public Transport
- 11.1.5. Automotive Telematics
- 11.1.6. Freight
- 11.1.7. Other Applications
- 11.2. Market Analysis, Insights and Forecast - by Product Type
- 11.2.1. Advanced Traveler Information Systems (ATIS)
- 11.2.2. Advanced Transportation Management Systems (ATMS)
- 11.2.3. Advanced Transportation Pricing Systems (ATPS)
- 11.2.4. Advanced Public Transportation Systems (APTS)
- 11.2.5. Cooperative Vehicle Systems
- 11.1. Market Analysis, Insights and Forecast - by Application
- 12. North America Smart Transportation Industry Analysis, Insights and Forecast, 2019-2031
- 12.1. Market Analysis, Insights and Forecast - By Country/Sub-region
- 12.1.1 United States
- 12.1.2 Canada
- 12.1.3 Mexico
- 13. Europe Smart Transportation Industry Analysis, Insights and Forecast, 2019-2031
- 13.1. Market Analysis, Insights and Forecast - By Country/Sub-region
- 13.1.1 Germany
- 13.1.2 United Kingdom
- 13.1.3 France
- 13.1.4 Spain
- 13.1.5 Italy
- 13.1.6 Spain
- 13.1.7 Belgium
- 13.1.8 Netherland
- 13.1.9 Nordics
- 13.1.10 Rest of Europe
- 14. Asia Pacific Smart Transportation Industry Analysis, Insights and Forecast, 2019-2031
- 14.1. Market Analysis, Insights and Forecast - By Country/Sub-region
- 14.1.1 China
- 14.1.2 Japan
- 14.1.3 India
- 14.1.4 South Korea
- 14.1.5 Southeast Asia
- 14.1.6 Australia
- 14.1.7 Indonesia
- 14.1.8 Phillipes
- 14.1.9 Singapore
- 14.1.10 Thailandc
- 14.1.11 Rest of Asia Pacific
- 15. South America Smart Transportation Industry Analysis, Insights and Forecast, 2019-2031
- 15.1. Market Analysis, Insights and Forecast - By Country/Sub-region
- 15.1.1 Brazil
- 15.1.2 Argentina
- 15.1.3 Peru
- 15.1.4 Chile
- 15.1.5 Colombia
- 15.1.6 Ecuador
- 15.1.7 Venezuela
- 15.1.8 Rest of South America
- 16. North America Smart Transportation Industry Analysis, Insights and Forecast, 2019-2031
- 16.1. Market Analysis, Insights and Forecast - By Country/Sub-region
- 16.1.1 United States
- 16.1.2 Canada
- 16.1.3 Mexico
- 17. MEA Smart Transportation Industry Analysis, Insights and Forecast, 2019-2031
- 17.1. Market Analysis, Insights and Forecast - By Country/Sub-region
- 17.1.1 United Arab Emirates
- 17.1.2 Saudi Arabia
- 17.1.3 South Africa
- 17.1.4 Rest of Middle East and Africa
- 18. Competitive Analysis
- 18.1. Global Market Share Analysis 2024
- 18.2. Company Profiles
- 18.2.1 Orange SA
- 18.2.1.1. Overview
- 18.2.1.2. Products
- 18.2.1.3. SWOT Analysis
- 18.2.1.4. Recent Developments
- 18.2.1.5. Financials (Based on Availability)
- 18.2.2 IBM Corporation
- 18.2.2.1. Overview
- 18.2.2.2. Products
- 18.2.2.3. SWOT Analysis
- 18.2.2.4. Recent Developments
- 18.2.2.5. Financials (Based on Availability)
- 18.2.3 Alstom
- 18.2.3.1. Overview
- 18.2.3.2. Products
- 18.2.3.3. SWOT Analysis
- 18.2.3.4. Recent Developments
- 18.2.3.5. Financials (Based on Availability)
- 18.2.4 Cisco Systems Inc
- 18.2.4.1. Overview
- 18.2.4.2. Products
- 18.2.4.3. SWOT Analysis
- 18.2.4.4. Recent Developments
- 18.2.4.5. Financials (Based on Availability)
- 18.2.5 Siemens Corporation
- 18.2.5.1. Overview
- 18.2.5.2. Products
- 18.2.5.3. SWOT Analysis
- 18.2.5.4. Recent Developments
- 18.2.5.5. Financials (Based on Availability)
- 18.2.6 AVEVA Group PLC
- 18.2.6.1. Overview
- 18.2.6.2. Products
- 18.2.6.3. SWOT Analysis
- 18.2.6.4. Recent Developments
- 18.2.6.5. Financials (Based on Availability)
- 18.2.7 Huawei Technologies Co Ltd
- 18.2.7.1. Overview
- 18.2.7.2. Products
- 18.2.7.3. SWOT Analysis
- 18.2.7.4. Recent Developments
- 18.2.7.5. Financials (Based on Availability)
- 18.2.8 Oracle Corporation
- 18.2.8.1. Overview
- 18.2.8.2. Products
- 18.2.8.3. SWOT Analysis
- 18.2.8.4. Recent Developments
- 18.2.8.5. Financials (Based on Availability)
- 18.2.9 Hitachi Lt
- 18.2.9.1. Overview
- 18.2.9.2. Products
- 18.2.9.3. SWOT Analysis
- 18.2.9.4. Recent Developments
- 18.2.9.5. Financials (Based on Availability)
- 18.2.10 Advantech Co Ltd
- 18.2.10.1. Overview
- 18.2.10.2. Products
- 18.2.10.3. SWOT Analysis
- 18.2.10.4. Recent Developments
- 18.2.10.5. Financials (Based on Availability)
- 18.2.11 SAP SE
- 18.2.11.1. Overview
- 18.2.11.2. Products
- 18.2.11.3. SWOT Analysis
- 18.2.11.4. Recent Developments
- 18.2.11.5. Financials (Based on Availability)
- 18.2.1 Orange SA
List of Figures
- Figure 1: Global Smart Transportation Industry Revenue Breakdown (Million, %) by Region 2024 & 2032
- Figure 2: North America Smart Transportation Industry Revenue (Million), by Country 2024 & 2032
- Figure 3: North America Smart Transportation Industry Revenue Share (%), by Country 2024 & 2032
- Figure 4: Europe Smart Transportation Industry Revenue (Million), by Country 2024 & 2032
- Figure 5: Europe Smart Transportation Industry Revenue Share (%), by Country 2024 & 2032
- Figure 6: Asia Pacific Smart Transportation Industry Revenue (Million), by Country 2024 & 2032
- Figure 7: Asia Pacific Smart Transportation Industry Revenue Share (%), by Country 2024 & 2032
- Figure 8: South America Smart Transportation Industry Revenue (Million), by Country 2024 & 2032
- Figure 9: South America Smart Transportation Industry Revenue Share (%), by Country 2024 & 2032
- Figure 10: North America Smart Transportation Industry Revenue (Million), by Country 2024 & 2032
- Figure 11: North America Smart Transportation Industry Revenue Share (%), by Country 2024 & 2032
- Figure 12: MEA Smart Transportation Industry Revenue (Million), by Country 2024 & 2032
- Figure 13: MEA Smart Transportation Industry Revenue Share (%), by Country 2024 & 2032
- Figure 14: North America Smart Transportation Industry Revenue (Million), by Application 2024 & 2032
- Figure 15: North America Smart Transportation Industry Revenue Share (%), by Application 2024 & 2032
- Figure 16: North America Smart Transportation Industry Revenue (Million), by Product Type 2024 & 2032
- Figure 17: North America Smart Transportation Industry Revenue Share (%), by Product Type 2024 & 2032
- Figure 18: North America Smart Transportation Industry Revenue (Million), by Country 2024 & 2032
- Figure 19: North America Smart Transportation Industry Revenue Share (%), by Country 2024 & 2032
- Figure 20: Europe Smart Transportation Industry Revenue (Million), by Application 2024 & 2032
- Figure 21: Europe Smart Transportation Industry Revenue Share (%), by Application 2024 & 2032
- Figure 22: Europe Smart Transportation Industry Revenue (Million), by Product Type 2024 & 2032
- Figure 23: Europe Smart Transportation Industry Revenue Share (%), by Product Type 2024 & 2032
- Figure 24: Europe Smart Transportation Industry Revenue (Million), by Country 2024 & 2032
- Figure 25: Europe Smart Transportation Industry Revenue Share (%), by Country 2024 & 2032
- Figure 26: Asia Smart Transportation Industry Revenue (Million), by Application 2024 & 2032
- Figure 27: Asia Smart Transportation Industry Revenue Share (%), by Application 2024 & 2032
- Figure 28: Asia Smart Transportation Industry Revenue (Million), by Product Type 2024 & 2032
- Figure 29: Asia Smart Transportation Industry Revenue Share (%), by Product Type 2024 & 2032
- Figure 30: Asia Smart Transportation Industry Revenue (Million), by Country 2024 & 2032
- Figure 31: Asia Smart Transportation Industry Revenue Share (%), by Country 2024 & 2032
- Figure 32: Australia and New Zealand Smart Transportation Industry Revenue (Million), by Application 2024 & 2032
- Figure 33: Australia and New Zealand Smart Transportation Industry Revenue Share (%), by Application 2024 & 2032
- Figure 34: Australia and New Zealand Smart Transportation Industry Revenue (Million), by Product Type 2024 & 2032
- Figure 35: Australia and New Zealand Smart Transportation Industry Revenue Share (%), by Product Type 2024 & 2032
- Figure 36: Australia and New Zealand Smart Transportation Industry Revenue (Million), by Country 2024 & 2032
- Figure 37: Australia and New Zealand Smart Transportation Industry Revenue Share (%), by Country 2024 & 2032
- Figure 38: Latin America Smart Transportation Industry Revenue (Million), by Application 2024 & 2032
- Figure 39: Latin America Smart Transportation Industry Revenue Share (%), by Application 2024 & 2032
- Figure 40: Latin America Smart Transportation Industry Revenue (Million), by Product Type 2024 & 2032
- Figure 41: Latin America Smart Transportation Industry Revenue Share (%), by Product Type 2024 & 2032
- Figure 42: Latin America Smart Transportation Industry Revenue (Million), by Country 2024 & 2032
- Figure 43: Latin America Smart Transportation Industry Revenue Share (%), by Country 2024 & 2032
- Figure 44: Middle East and Africa Smart Transportation Industry Revenue (Million), by Application 2024 & 2032
- Figure 45: Middle East and Africa Smart Transportation Industry Revenue Share (%), by Application 2024 & 2032
- Figure 46: Middle East and Africa Smart Transportation Industry Revenue (Million), by Product Type 2024 & 2032
- Figure 47: Middle East and Africa Smart Transportation Industry Revenue Share (%), by Product Type 2024 & 2032
- Figure 48: Middle East and Africa Smart Transportation Industry Revenue (Million), by Country 2024 & 2032
- Figure 49: Middle East and Africa Smart Transportation Industry Revenue Share (%), by Country 2024 & 2032
List of Tables
- Table 1: Global Smart Transportation Industry Revenue Million Forecast, by Region 2019 & 2032
- Table 2: Global Smart Transportation Industry Revenue Million Forecast, by Application 2019 & 2032
- Table 3: Global Smart Transportation Industry Revenue Million Forecast, by Product Type 2019 & 2032
- Table 4: Global Smart Transportation Industry Revenue Million Forecast, by Region 2019 & 2032
- Table 5: Global Smart Transportation Industry Revenue Million Forecast, by Country 2019 & 2032
- Table 6: United States Smart Transportation Industry Revenue (Million) Forecast, by Application 2019 & 2032
- Table 7: Canada Smart Transportation Industry Revenue (Million) Forecast, by Application 2019 & 2032
- Table 8: Mexico Smart Transportation Industry Revenue (Million) Forecast, by Application 2019 & 2032
- Table 9: Global Smart Transportation Industry Revenue Million Forecast, by Country 2019 & 2032
- Table 10: Germany Smart Transportation Industry Revenue (Million) Forecast, by Application 2019 & 2032
- Table 11: United Kingdom Smart Transportation Industry Revenue (Million) Forecast, by Application 2019 & 2032
- Table 12: France Smart Transportation Industry Revenue (Million) Forecast, by Application 2019 & 2032
- Table 13: Spain Smart Transportation Industry Revenue (Million) Forecast, by Application 2019 & 2032
- Table 14: Italy Smart Transportation Industry Revenue (Million) Forecast, by Application 2019 & 2032
- Table 15: Spain Smart Transportation Industry Revenue (Million) Forecast, by Application 2019 & 2032
- Table 16: Belgium Smart Transportation Industry Revenue (Million) Forecast, by Application 2019 & 2032
- Table 17: Netherland Smart Transportation Industry Revenue (Million) Forecast, by Application 2019 & 2032
- Table 18: Nordics Smart Transportation Industry Revenue (Million) Forecast, by Application 2019 & 2032
- Table 19: Rest of Europe Smart Transportation Industry Revenue (Million) Forecast, by Application 2019 & 2032
- Table 20: Global Smart Transportation Industry Revenue Million Forecast, by Country 2019 & 2032
- Table 21: China Smart Transportation Industry Revenue (Million) Forecast, by Application 2019 & 2032
- Table 22: Japan Smart Transportation Industry Revenue (Million) Forecast, by Application 2019 & 2032
- Table 23: India Smart Transportation Industry Revenue (Million) Forecast, by Application 2019 & 2032
- Table 24: South Korea Smart Transportation Industry Revenue (Million) Forecast, by Application 2019 & 2032
- Table 25: Southeast Asia Smart Transportation Industry Revenue (Million) Forecast, by Application 2019 & 2032
- Table 26: Australia Smart Transportation Industry Revenue (Million) Forecast, by Application 2019 & 2032
- Table 27: Indonesia Smart Transportation Industry Revenue (Million) Forecast, by Application 2019 & 2032
- Table 28: Phillipes Smart Transportation Industry Revenue (Million) Forecast, by Application 2019 & 2032
- Table 29: Singapore Smart Transportation Industry Revenue (Million) Forecast, by Application 2019 & 2032
- Table 30: Thailandc Smart Transportation Industry Revenue (Million) Forecast, by Application 2019 & 2032
- Table 31: Rest of Asia Pacific Smart Transportation Industry Revenue (Million) Forecast, by Application 2019 & 2032
- Table 32: Global Smart Transportation Industry Revenue Million Forecast, by Country 2019 & 2032
- Table 33: Brazil Smart Transportation Industry Revenue (Million) Forecast, by Application 2019 & 2032
- Table 34: Argentina Smart Transportation Industry Revenue (Million) Forecast, by Application 2019 & 2032
- Table 35: Peru Smart Transportation Industry Revenue (Million) Forecast, by Application 2019 & 2032
- Table 36: Chile Smart Transportation Industry Revenue (Million) Forecast, by Application 2019 & 2032
- Table 37: Colombia Smart Transportation Industry Revenue (Million) Forecast, by Application 2019 & 2032
- Table 38: Ecuador Smart Transportation Industry Revenue (Million) Forecast, by Application 2019 & 2032
- Table 39: Venezuela Smart Transportation Industry Revenue (Million) Forecast, by Application 2019 & 2032
- Table 40: Rest of South America Smart Transportation Industry Revenue (Million) Forecast, by Application 2019 & 2032
- Table 41: Global Smart Transportation Industry Revenue Million Forecast, by Country 2019 & 2032
- Table 42: United States Smart Transportation Industry Revenue (Million) Forecast, by Application 2019 & 2032
- Table 43: Canada Smart Transportation Industry Revenue (Million) Forecast, by Application 2019 & 2032
- Table 44: Mexico Smart Transportation Industry Revenue (Million) Forecast, by Application 2019 & 2032
- Table 45: Global Smart Transportation Industry Revenue Million Forecast, by Country 2019 & 2032
- Table 46: United Arab Emirates Smart Transportation Industry Revenue (Million) Forecast, by Application 2019 & 2032
- Table 47: Saudi Arabia Smart Transportation Industry Revenue (Million) Forecast, by Application 2019 & 2032
- Table 48: South Africa Smart Transportation Industry Revenue (Million) Forecast, by Application 2019 & 2032
- Table 49: Rest of Middle East and Africa Smart Transportation Industry Revenue (Million) Forecast, by Application 2019 & 2032
- Table 50: Global Smart Transportation Industry Revenue Million Forecast, by Application 2019 & 2032
- Table 51: Global Smart Transportation Industry Revenue Million Forecast, by Product Type 2019 & 2032
- Table 52: Global Smart Transportation Industry Revenue Million Forecast, by Country 2019 & 2032
- Table 53: United States Smart Transportation Industry Revenue (Million) Forecast, by Application 2019 & 2032
- Table 54: Canada Smart Transportation Industry Revenue (Million) Forecast, by Application 2019 & 2032
- Table 55: Global Smart Transportation Industry Revenue Million Forecast, by Application 2019 & 2032
- Table 56: Global Smart Transportation Industry Revenue Million Forecast, by Product Type 2019 & 2032
- Table 57: Global Smart Transportation Industry Revenue Million Forecast, by Country 2019 & 2032
- Table 58: United Kingdom Smart Transportation Industry Revenue (Million) Forecast, by Application 2019 & 2032
- Table 59: Germany Smart Transportation Industry Revenue (Million) Forecast, by Application 2019 & 2032
- Table 60: France Smart Transportation Industry Revenue (Million) Forecast, by Application 2019 & 2032
- Table 61: Global Smart Transportation Industry Revenue Million Forecast, by Application 2019 & 2032
- Table 62: Global Smart Transportation Industry Revenue Million Forecast, by Product Type 2019 & 2032
- Table 63: Global Smart Transportation Industry Revenue Million Forecast, by Country 2019 & 2032
- Table 64: China Smart Transportation Industry Revenue (Million) Forecast, by Application 2019 & 2032
- Table 65: Japan Smart Transportation Industry Revenue (Million) Forecast, by Application 2019 & 2032
- Table 66: Global Smart Transportation Industry Revenue Million Forecast, by Application 2019 & 2032
- Table 67: Global Smart Transportation Industry Revenue Million Forecast, by Product Type 2019 & 2032
- Table 68: Global Smart Transportation Industry Revenue Million Forecast, by Country 2019 & 2032
- Table 69: Global Smart Transportation Industry Revenue Million Forecast, by Application 2019 & 2032
- Table 70: Global Smart Transportation Industry Revenue Million Forecast, by Product Type 2019 & 2032
- Table 71: Global Smart Transportation Industry Revenue Million Forecast, by Country 2019 & 2032
- Table 72: Mexico Smart Transportation Industry Revenue (Million) Forecast, by Application 2019 & 2032
- Table 73: Brazil Smart Transportation Industry Revenue (Million) Forecast, by Application 2019 & 2032
- Table 74: Global Smart Transportation Industry Revenue Million Forecast, by Application 2019 & 2032
- Table 75: Global Smart Transportation Industry Revenue Million Forecast, by Product Type 2019 & 2032
- Table 76: Global Smart Transportation Industry Revenue Million Forecast, by Country 2019 & 2032
- Table 77: United Arab Emirates Smart Transportation Industry Revenue (Million) Forecast, by Application 2019 & 2032
- Table 78: South Africa Smart Transportation Industry Revenue (Million) Forecast, by Application 2019 & 2032
- Table 79: Saudi Arabia Smart Transportation Industry Revenue (Million) Forecast, by Application 2019 & 2032
Frequently Asked Questions
1. What is the projected Compound Annual Growth Rate (CAGR) of the Smart Transportation Industry?
The projected CAGR is approximately 6.79%.
2. Which companies are prominent players in the Smart Transportation Industry?
Key companies in the market include Orange SA, IBM Corporation, Alstom, Cisco Systems Inc, Siemens Corporation, AVEVA Group PLC, Huawei Technologies Co Ltd, Oracle Corporation, Hitachi Lt, Advantech Co Ltd, SAP SE.
3. What are the main segments of the Smart Transportation Industry?
The market segments include Application, Product Type.
4. Can you provide details about the market size?
The market size is estimated to be USD 33.38 Million as of 2022.
5. What are some drivers contributing to market growth?
Rise of Urbanization and Increasing Mega Cities and Increasing Population; Government Initiatives to Enhance the Transportation Infrastructure.
6. What are the notable trends driving market growth?
Rise of Urbanization. and Population would Drive the Market.
7. Are there any restraints impacting market growth?
High Capital Required for Deployment.
8. Can you provide examples of recent developments in the market?
November 2023 – Hitachi ZeroCarbon Ltd. has partnered with FirstGroup plc to lead the UK's shift to electric buses. The collaboration, which is part of FirstGroup's bus fleet and infrastructure decarbonisation programme, will provide batteries for First Bus's expanding electric bus fleet, helping to make a positive impact on air quality, tackle congestion and improve customer experience.
9. What pricing options are available for accessing the report?
Pricing options include single-user, multi-user, and enterprise licenses priced at USD 4750, USD 5250, and USD 8750 respectively.
10. Is the market size provided in terms of value or volume?
The market size is provided in terms of value, measured in Million.
11. Are there any specific market keywords associated with the report?
Yes, the market keyword associated with the report is "Smart Transportation Industry," which aids in identifying and referencing the specific market segment covered.
12. How do I determine which pricing option suits my needs best?
The pricing options vary based on user requirements and access needs. Individual users may opt for single-user licenses, while businesses requiring broader access may choose multi-user or enterprise licenses for cost-effective access to the report.
13. Are there any additional resources or data provided in the Smart Transportation Industry report?
While the report offers comprehensive insights, it's advisable to review the specific contents or supplementary materials provided to ascertain if additional resources or data are available.
14. How can I stay updated on further developments or reports in the Smart Transportation Industry?
To stay informed about further developments, trends, and reports in the Smart Transportation Industry, consider subscribing to industry newsletters, following relevant companies and organizations, or regularly checking reputable industry news sources and publications.
Methodology
Step 1 - Identification of Relevant Samples Size from Population Database


Step 2 - Approaches for Defining Global Market Size (Value, Volume* & Price*)

Note*: In applicable scenarios
Step 3 - Data Sources
Primary Research
- Web Analytics
- Survey Reports
- Research Institute
- Latest Research Reports
- Opinion Leaders
Secondary Research
- Annual Reports
- White Paper
- Latest Press Release
- Industry Association
- Paid Database
- Investor Presentations

Step 4 - Data Triangulation
Involves using different sources of information in order to increase the validity of a study
These sources are likely to be stakeholders in a program - participants, other researchers, program staff, other community members, and so on.
Then we put all data in single framework & apply various statistical tools to find out the dynamic on the market.
During the analysis stage, feedback from the stakeholder groups would be compared to determine areas of agreement as well as areas of divergence
