

Key Insights
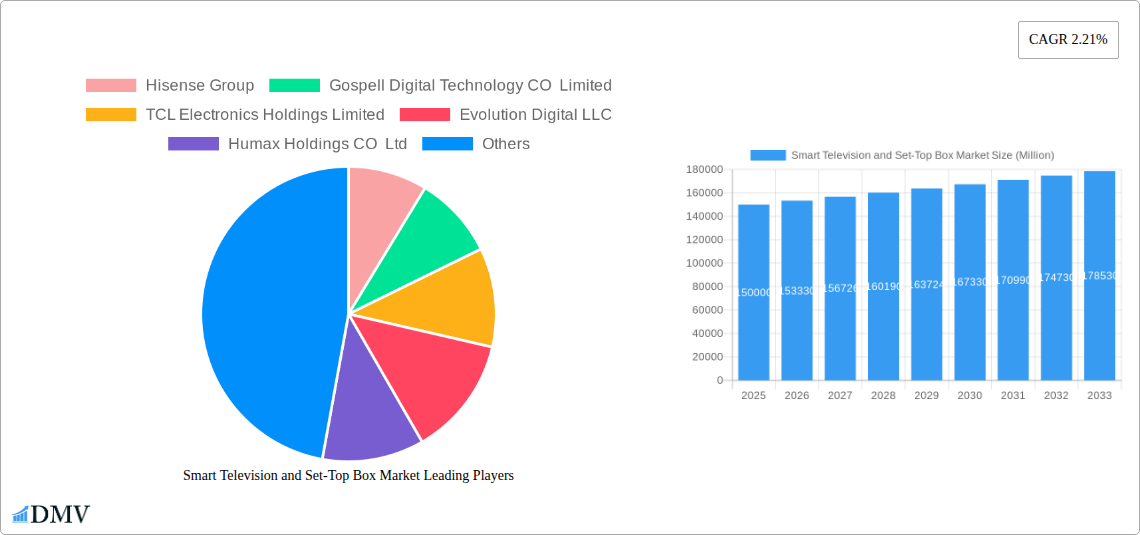
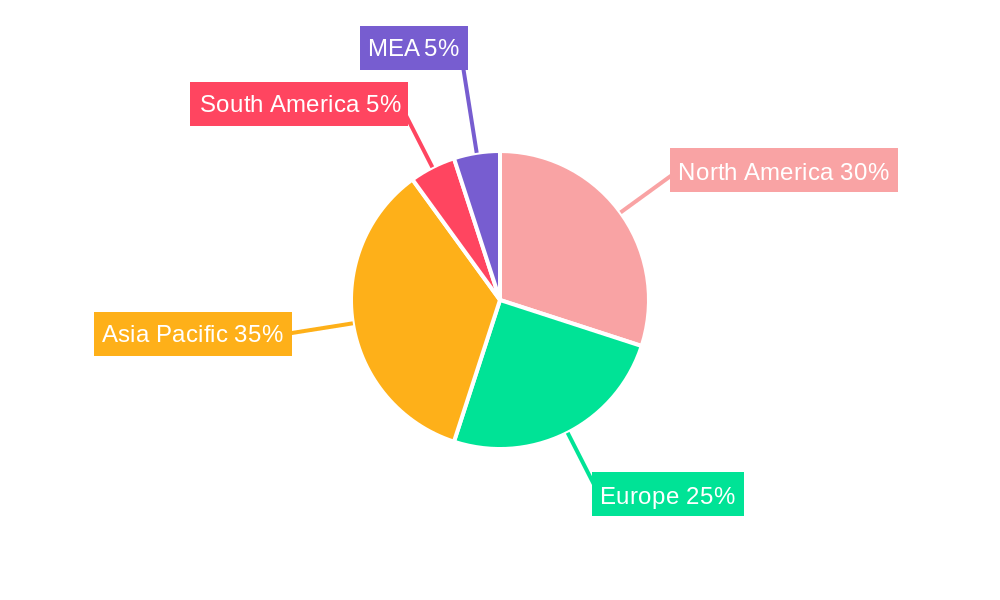
The global Smart Television and Set-Top Box market, exhibiting a CAGR of 2.21%, presents a compelling growth story driven by several key factors. The increasing demand for high-resolution displays (4K and 8K) is a significant driver, fueled by advancements in streaming services offering ultra-high-definition content. Consumers are increasingly adopting smart TVs for their integrated streaming capabilities, eliminating the need for separate streaming devices and simplifying the home entertainment experience. The proliferation of affordable, high-speed internet access in various regions further bolsters this trend. Technological advancements in display technologies like OLED and QLED, offering superior picture quality and enhanced viewing experiences, are contributing to premium segment growth. However, market restraints include the relatively high initial cost of premium smart TVs, particularly 8K models, potentially limiting penetration in price-sensitive markets. Furthermore, the complexity of integrating various streaming services and navigating smart TV interfaces can pose a challenge for some consumers. The market is segmented by resolution (HD/FHD, 4K, 8K), display size (32" and below, 39"-47", 48"-54", 55"-64", 65" and above), and technology (LCD, OLED, QLED). Major players like Samsung, LG, TCL, Hisense, and Xiaomi are actively competing in this dynamic market, constantly innovating to meet evolving consumer demands. Regional variations exist, with North America and Asia Pacific leading in market share, driven by high consumer electronics adoption rates and robust digital infrastructure.
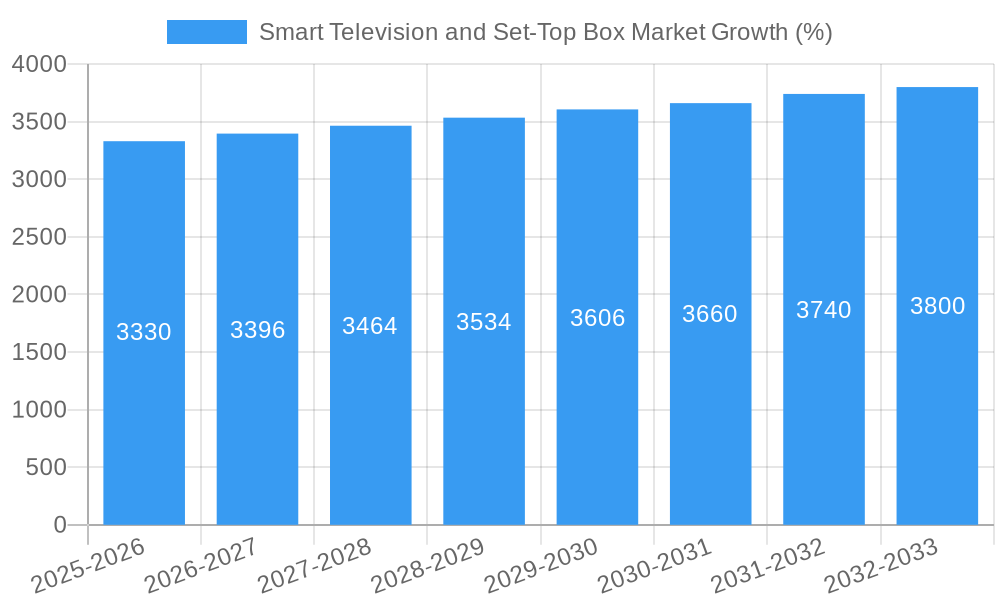
The forecast period (2025-2033) suggests continued growth, albeit at a moderate pace. We anticipate that the increasing adoption of smart home technologies and the convergence of smart TVs with other home automation systems will contribute to market expansion. The ongoing development of innovative features like improved voice assistants, enhanced gaming capabilities, and AI-powered personalization will continue to drive consumer interest. However, the market will likely experience fluctuations influenced by economic factors, technological disruptions, and the competitive landscape. The strategic focus of major players will revolve around introducing innovative features, optimizing manufacturing costs, and expanding market penetration in emerging economies. The long-term prospects remain positive, given the widespread adoption of streaming services and the continuous improvement in display technologies. The market will see a shift towards larger screen sizes and higher resolutions, with 4K and 8K models gaining prominence.
Smart Television and Set-Top Box Market: A Comprehensive Report (2019-2033)
This insightful report provides a detailed analysis of the Smart Television and Set-Top Box market, encompassing historical data (2019-2024), current estimates (2025), and future forecasts (2025-2033). It offers a comprehensive understanding of market dynamics, technological advancements, and key players, equipping stakeholders with actionable intelligence for strategic decision-making. The report covers a wide range of aspects, including market segmentation by resolution (HD/FHD, 4K, 8K), display size (32 and below, 39-, 48-, 55-, 65 and above), and technology (LCD, OLED, QLED). Leading companies like Samsung Electronics CO Ltd, LG Electronics Inc, TCL Electronics Holdings Limited, Hisense Group, and ZTE Corporation are analyzed, providing valuable insights into their strategies and market positions. The report also examines crucial industry developments, highlighting both opportunities and challenges.
Smart Television and Set-Top Box Market Market Composition & Trends
This section delves into the competitive landscape of the Smart Television and Set-Top Box market. We analyze market concentration, identifying the top players and their respective market share distribution. For instance, in 2025, Samsung is estimated to hold xx% market share, followed by LG with xx%, and TCL with xx%. The report examines the forces driving innovation, including technological advancements in display technology (OLED, QLED, Mini-LED), improved processing power, and the integration of smart features. The regulatory landscape's influence on market growth is also discussed, along with the impact of substitute products (such as streaming sticks) and evolving end-user preferences. Furthermore, the report includes a review of significant M&A activities within the industry, providing details on deal values (e.g., a recent acquisition valued at xx Million) and their implications for market consolidation.
- Market Share Distribution (2025): Samsung (xx%), LG (xx%), TCL (xx%), Hisense (xx%), Others (xx%)
- Key Innovation Catalysts: Advancements in display technology, improved processing power, integration of smart features, and 5G connectivity.
- M&A Activity (2019-2024): xx Million in total deal value across yy transactions.
Smart Television and Set-Top Box Market Industry Evolution
This section provides a detailed analysis of the Smart Television and Set-Top Box market's evolutionary trajectory. We examine the historical growth trends from 2019 to 2024, observing a Compound Annual Growth Rate (CAGR) of xx%. The market is projected to continue its growth momentum during the forecast period (2025-2033), with a predicted CAGR of yy%. This growth is fueled by several factors, including rising disposable incomes in emerging economies, increasing adoption of streaming services, and the continuous improvement of display technologies like 4K and 8K. The transition from traditional TVs to smart TVs is also a major driver, with a significant increase in penetration rates observed in recent years. Technological advancements, such as the introduction of 8K resolution displays, HDR technologies, and the integration of AI and voice assistants, have significantly influenced consumer preferences and shaped the market's growth path. Shifting consumer demands towards larger screen sizes, enhanced picture quality, and more interactive features are further driving market evolution. For example, the adoption rate of 4K TVs increased by xx% between 2020 and 2024, illustrating the rapid technological shift in consumer preferences.
Leading Regions, Countries, or Segments in Smart Television and Set-Top Box Market
The Smart Television and Set-Top Box market exhibits regional variations in growth patterns and segment dominance. This section identifies the leading regions, countries, and segments.
Dominant Segment: The 4K resolution segment is currently the dominant segment, benefiting from cost reductions and increased affordability.
- Key Drivers for 4K Segment Dominance:
- Decreasing production costs of 4K panels.
- Increased availability of 4K content from streaming platforms.
- Growing consumer preference for higher resolution displays.
Dominant Region/Country: North America and Asia Pacific are currently the leading regions, with Asia Pacific showing the most significant growth potential.
- Key Drivers for Regional Growth:
- High consumer electronics penetration in North America.
- Rapid economic growth and increasing urbanization in Asia Pacific.
- Government initiatives promoting digitalization in several Asian countries.
Dominant Display Size: The 55-inch and 65-inch and above display sizes hold significant market share, reflecting consumer preference for larger screen sizes for an enhanced viewing experience. This trend is further amplified by the declining price of larger displays.
- Key Drivers for Large Display Size Dominance:
- Decreased cost of manufacturing larger panels.
- Improved affordability of larger screen sizes.
- Enhanced viewing experience provided by larger displays.
Dominant Technology: LCD technology continues to hold a majority market share due to its cost-effectiveness, but OLED and QLED are experiencing rapid growth driven by enhanced picture quality and improved viewing experience.
- Key Drivers for Technology Shifts:
- Advancements in OLED and QLED technologies leading to improved image quality.
- Increasing consumer awareness of benefits of premium display technologies.
Smart Television and Set-Top Box Market Product Innovations
Recent innovations focus on enhancing picture quality, improving user experience through smart features, and increasing energy efficiency. The introduction of 8K resolution displays, Mini-LED backlighting for superior contrast, and advanced HDR technologies mark significant advancements. The integration of AI-powered features, voice assistants, and improved user interfaces are further enhancing user experience. Furthermore, the integration of 5G connectivity opens up new possibilities for seamless streaming and interactive content delivery. Unique selling propositions increasingly revolve around advanced picture quality, seamless smart functionality, and eco-friendly design.
Propelling Factors for Smart Television and Set-Top Box Market Growth
Several factors fuel the growth of the Smart Television and Set-Top Box market. Technological advancements, such as the development of 8K displays, HDR technologies, and the integration of AI and voice assistants, significantly enhance the user experience. The rising penetration of high-speed internet and the increasing affordability of smart TVs are driving adoption rates, particularly in emerging markets. Government initiatives promoting digitalization further support market growth. Furthermore, the increasing popularity of streaming services necessitates the use of smart TVs and set-top boxes, accelerating the overall market expansion.
Obstacles in the Smart Television and Set-Top Box Market Market
Despite the positive growth outlook, certain challenges hinder market expansion. Supply chain disruptions caused by global events can impact production and availability. Intense competition from established and emerging players creates pressure on pricing and profit margins. Stricter regulatory compliance requirements, particularly regarding energy efficiency, can increase production costs. The cyclical nature of consumer electronics sales also presents an obstacle, leading to fluctuations in demand.
Future Opportunities in Smart Television and Set-Top Box Market
Future opportunities lie in the expansion into untapped markets, particularly in developing economies with rising disposable incomes. The development of new technologies, such as micro-LED and advanced HDR formats, presents significant growth potential. The rising demand for larger screen sizes and premium features will drive higher average selling prices. Furthermore, the integration of innovative smart home functionalities will enhance the user experience, opening up new opportunities for integration with other smart devices.
Major Players in the Smart Television and Set-Top Box Market Ecosystem
- Hisense Group
- Gospell Digital Technology CO Limited
- TCL Electronics Holdings Limited
- Evolution Digital LLC
- Humax Holdings CO Ltd
- LG Electronics Inc
- Shenzhen Skyworth Digital Technology CO Ltd
- Shenzhen Coship Electronics CO Ltd
- Intek Digital Inc
- Arris International PLC (commscope Holding Company Inc)
- Sagemcom SAS
- ZTE Corporation
- Xiaomi Corporation
- Kaonmedia CO Ltd
- Technicolor SA
- Samsung Electronics CO Ltd
Key Developments in Smart Television and Set-Top Box Market Industry
- September 2021: Technicolor deployed next-generation Android TV set-top boxes for TIM, providing access to premium OTT services.
- February 2022: ZTE Corporation announced the launch of its new-generation 5G media gateway set-top box.
- August 2022: Samsung launched its Samsung OLED TV in Australia, featuring over 8 million self-lit pixels and Quantum Dot Technology.
Strategic Smart Television and Set-Top Box Market Market Forecast
The Smart Television and Set-Top Box market is poised for sustained growth driven by technological advancements, increasing consumer demand, and expanding market penetration in developing economies. The continued innovation in display technologies, the integration of smart features, and the rising adoption of streaming services will collectively fuel market expansion. The strategic focus on enhancing user experience, improving energy efficiency, and incorporating innovative features will be critical for success in this dynamic market. This presents significant opportunities for market players to capitalize on the increasing demand for sophisticated and high-quality smart televisions and set-top boxes.
Smart Television and Set-Top Box Market Segmentation
-
1. Technology
- 1.1. Satellite/DTH
- 1.2. IPTV
- 1.3. Cable
- 1.4. Other Types (DTT)
-
2. Resolution
- 2.1. SD
- 2.2. HD
- 2.3. Ultra-HD And Higher
-
3. Resolution
- 3.1. HD/FHD
- 3.2. 4K
- 3.3. 8K
-
4. Display Size (in Inches)
- 4.1. 32 And Below
- 4.2. 39-43
- 4.3. 48-50
- 4.4. 55-60
- 4.5. 65 And Above
-
5. Technology
- 5.1. LCD
- 5.2. OLED
- 5.3. QLED
Smart Television and Set-Top Box Market Segmentation By Geography
- 1. North America
- 2. Europe
- 3. Asia Pacific
- 4. Rest of the World
- 5. North America
- 6. Europe
- 7. Asia Pacific
- 8. Rest of the World
Smart Television and Set-Top Box Market REPORT HIGHLIGHTS
| Aspects | Details |
|---|---|
| Study Period | 2019-2033 |
| Base Year | 2024 |
| Estimated Year | 2025 |
| Forecast Period | 2025-2033 |
| Historical Period | 2019-2024 |
| Growth Rate | CAGR of 2.21% from 2019-2033 |
| Segmentation |
|
Table of Contents
- 1. Introduction
- 1.1. Research Scope
- 1.2. Market Segmentation
- 1.3. Research Methodology
- 1.4. Definitions and Assumptions
- 2. Executive Summary
- 2.1. Introduction
- 3. Market Dynamics
- 3.1. Introduction
- 3.2. Market Drivers
- 3.2.1. High Levels of Technological Innovations; Growing Adoption In The Emerging Markets; Deployment Of OS-based Devices
- 3.3. Market Restrains
- 3.3.1. Growing Production Costs and Vendor Consolidation
- 3.4. Market Trends
- 3.4.1. High Levels of Technological Innovations to Drive the Market
- 4. Market Factor Analysis
- 4.1. Porters Five Forces
- 4.2. Supply/Value Chain
- 4.3. PESTEL analysis
- 4.4. Market Entropy
- 4.5. Patent/Trademark Analysis
- 5. Global Smart Television and Set-Top Box Market Analysis, Insights and Forecast, 2019-2031
- 5.1. Market Analysis, Insights and Forecast - by Technology
- 5.1.1. Satellite/DTH
- 5.1.2. IPTV
- 5.1.3. Cable
- 5.1.4. Other Types (DTT)
- 5.2. Market Analysis, Insights and Forecast - by Resolution
- 5.2.1. SD
- 5.2.2. HD
- 5.2.3. Ultra-HD And Higher
- 5.3. Market Analysis, Insights and Forecast - by Resolution
- 5.3.1. HD/FHD
- 5.3.2. 4K
- 5.3.3. 8K
- 5.4. Market Analysis, Insights and Forecast - by Display Size (in Inches)
- 5.4.1. 32 And Below
- 5.4.2. 39-43
- 5.4.3. 48-50
- 5.4.4. 55-60
- 5.4.5. 65 And Above
- 5.5. Market Analysis, Insights and Forecast - by Technology
- 5.5.1. LCD
- 5.5.2. OLED
- 5.5.3. QLED
- 5.6. Market Analysis, Insights and Forecast - by Region
- 5.6.1. North America
- 5.6.2. Europe
- 5.6.3. Asia Pacific
- 5.6.4. Rest of the World
- 5.6.5. North America
- 5.6.6. Europe
- 5.6.7. Asia Pacific
- 5.6.8. Rest of the World
- 5.1. Market Analysis, Insights and Forecast - by Technology
- 6. North America Smart Television and Set-Top Box Market Analysis, Insights and Forecast, 2019-2031
- 6.1. Market Analysis, Insights and Forecast - by Technology
- 6.1.1. Satellite/DTH
- 6.1.2. IPTV
- 6.1.3. Cable
- 6.1.4. Other Types (DTT)
- 6.2. Market Analysis, Insights and Forecast - by Resolution
- 6.2.1. SD
- 6.2.2. HD
- 6.2.3. Ultra-HD And Higher
- 6.3. Market Analysis, Insights and Forecast - by Resolution
- 6.3.1. HD/FHD
- 6.3.2. 4K
- 6.3.3. 8K
- 6.4. Market Analysis, Insights and Forecast - by Display Size (in Inches)
- 6.4.1. 32 And Below
- 6.4.2. 39-43
- 6.4.3. 48-50
- 6.4.4. 55-60
- 6.4.5. 65 And Above
- 6.5. Market Analysis, Insights and Forecast - by Technology
- 6.5.1. LCD
- 6.5.2. OLED
- 6.5.3. QLED
- 6.1. Market Analysis, Insights and Forecast - by Technology
- 7. Europe Smart Television and Set-Top Box Market Analysis, Insights and Forecast, 2019-2031
- 7.1. Market Analysis, Insights and Forecast - by Technology
- 7.1.1. Satellite/DTH
- 7.1.2. IPTV
- 7.1.3. Cable
- 7.1.4. Other Types (DTT)
- 7.2. Market Analysis, Insights and Forecast - by Resolution
- 7.2.1. SD
- 7.2.2. HD
- 7.2.3. Ultra-HD And Higher
- 7.3. Market Analysis, Insights and Forecast - by Resolution
- 7.3.1. HD/FHD
- 7.3.2. 4K
- 7.3.3. 8K
- 7.4. Market Analysis, Insights and Forecast - by Display Size (in Inches)
- 7.4.1. 32 And Below
- 7.4.2. 39-43
- 7.4.3. 48-50
- 7.4.4. 55-60
- 7.4.5. 65 And Above
- 7.5. Market Analysis, Insights and Forecast - by Technology
- 7.5.1. LCD
- 7.5.2. OLED
- 7.5.3. QLED
- 7.1. Market Analysis, Insights and Forecast - by Technology
- 8. Asia Pacific Smart Television and Set-Top Box Market Analysis, Insights and Forecast, 2019-2031
- 8.1. Market Analysis, Insights and Forecast - by Technology
- 8.1.1. Satellite/DTH
- 8.1.2. IPTV
- 8.1.3. Cable
- 8.1.4. Other Types (DTT)
- 8.2. Market Analysis, Insights and Forecast - by Resolution
- 8.2.1. SD
- 8.2.2. HD
- 8.2.3. Ultra-HD And Higher
- 8.3. Market Analysis, Insights and Forecast - by Resolution
- 8.3.1. HD/FHD
- 8.3.2. 4K
- 8.3.3. 8K
- 8.4. Market Analysis, Insights and Forecast - by Display Size (in Inches)
- 8.4.1. 32 And Below
- 8.4.2. 39-43
- 8.4.3. 48-50
- 8.4.4. 55-60
- 8.4.5. 65 And Above
- 8.5. Market Analysis, Insights and Forecast - by Technology
- 8.5.1. LCD
- 8.5.2. OLED
- 8.5.3. QLED
- 8.1. Market Analysis, Insights and Forecast - by Technology
- 9. Rest of the World Smart Television and Set-Top Box Market Analysis, Insights and Forecast, 2019-2031
- 9.1. Market Analysis, Insights and Forecast - by Technology
- 9.1.1. Satellite/DTH
- 9.1.2. IPTV
- 9.1.3. Cable
- 9.1.4. Other Types (DTT)
- 9.2. Market Analysis, Insights and Forecast - by Resolution
- 9.2.1. SD
- 9.2.2. HD
- 9.2.3. Ultra-HD And Higher
- 9.3. Market Analysis, Insights and Forecast - by Resolution
- 9.3.1. HD/FHD
- 9.3.2. 4K
- 9.3.3. 8K
- 9.4. Market Analysis, Insights and Forecast - by Display Size (in Inches)
- 9.4.1. 32 And Below
- 9.4.2. 39-43
- 9.4.3. 48-50
- 9.4.4. 55-60
- 9.4.5. 65 And Above
- 9.5. Market Analysis, Insights and Forecast - by Technology
- 9.5.1. LCD
- 9.5.2. OLED
- 9.5.3. QLED
- 9.1. Market Analysis, Insights and Forecast - by Technology
- 10. North America Smart Television and Set-Top Box Market Analysis, Insights and Forecast, 2019-2031
- 10.1. Market Analysis, Insights and Forecast - by Technology
- 10.1.1. Satellite/DTH
- 10.1.2. IPTV
- 10.1.3. Cable
- 10.1.4. Other Types (DTT)
- 10.2. Market Analysis, Insights and Forecast - by Resolution
- 10.2.1. SD
- 10.2.2. HD
- 10.2.3. Ultra-HD And Higher
- 10.3. Market Analysis, Insights and Forecast - by Resolution
- 10.3.1. HD/FHD
- 10.3.2. 4K
- 10.3.3. 8K
- 10.4. Market Analysis, Insights and Forecast - by Display Size (in Inches)
- 10.4.1. 32 And Below
- 10.4.2. 39-43
- 10.4.3. 48-50
- 10.4.4. 55-60
- 10.4.5. 65 And Above
- 10.5. Market Analysis, Insights and Forecast - by Technology
- 10.5.1. LCD
- 10.5.2. OLED
- 10.5.3. QLED
- 10.1. Market Analysis, Insights and Forecast - by Technology
- 11. Europe Smart Television and Set-Top Box Market Analysis, Insights and Forecast, 2019-2031
- 11.1. Market Analysis, Insights and Forecast - by Technology
- 11.1.1. Satellite/DTH
- 11.1.2. IPTV
- 11.1.3. Cable
- 11.1.4. Other Types (DTT)
- 11.2. Market Analysis, Insights and Forecast - by Resolution
- 11.2.1. SD
- 11.2.2. HD
- 11.2.3. Ultra-HD And Higher
- 11.3. Market Analysis, Insights and Forecast - by Resolution
- 11.3.1. HD/FHD
- 11.3.2. 4K
- 11.3.3. 8K
- 11.4. Market Analysis, Insights and Forecast - by Display Size (in Inches)
- 11.4.1. 32 And Below
- 11.4.2. 39-43
- 11.4.3. 48-50
- 11.4.4. 55-60
- 11.4.5. 65 And Above
- 11.5. Market Analysis, Insights and Forecast - by Technology
- 11.5.1. LCD
- 11.5.2. OLED
- 11.5.3. QLED
- 11.1. Market Analysis, Insights and Forecast - by Technology
- 12. Asia Pacific Smart Television and Set-Top Box Market Analysis, Insights and Forecast, 2019-2031
- 12.1. Market Analysis, Insights and Forecast - by Technology
- 12.1.1. Satellite/DTH
- 12.1.2. IPTV
- 12.1.3. Cable
- 12.1.4. Other Types (DTT)
- 12.2. Market Analysis, Insights and Forecast - by Resolution
- 12.2.1. SD
- 12.2.2. HD
- 12.2.3. Ultra-HD And Higher
- 12.3. Market Analysis, Insights and Forecast - by Resolution
- 12.3.1. HD/FHD
- 12.3.2. 4K
- 12.3.3. 8K
- 12.4. Market Analysis, Insights and Forecast - by Display Size (in Inches)
- 12.4.1. 32 And Below
- 12.4.2. 39-43
- 12.4.3. 48-50
- 12.4.4. 55-60
- 12.4.5. 65 And Above
- 12.5. Market Analysis, Insights and Forecast - by Technology
- 12.5.1. LCD
- 12.5.2. OLED
- 12.5.3. QLED
- 12.1. Market Analysis, Insights and Forecast - by Technology
- 13. Rest of the World Smart Television and Set-Top Box Market Analysis, Insights and Forecast, 2019-2031
- 13.1. Market Analysis, Insights and Forecast - by Technology
- 13.1.1. Satellite/DTH
- 13.1.2. IPTV
- 13.1.3. Cable
- 13.1.4. Other Types (DTT)
- 13.2. Market Analysis, Insights and Forecast - by Resolution
- 13.2.1. SD
- 13.2.2. HD
- 13.2.3. Ultra-HD And Higher
- 13.3. Market Analysis, Insights and Forecast - by Resolution
- 13.3.1. HD/FHD
- 13.3.2. 4K
- 13.3.3. 8K
- 13.4. Market Analysis, Insights and Forecast - by Display Size (in Inches)
- 13.4.1. 32 And Below
- 13.4.2. 39-43
- 13.4.3. 48-50
- 13.4.4. 55-60
- 13.4.5. 65 And Above
- 13.5. Market Analysis, Insights and Forecast - by Technology
- 13.5.1. LCD
- 13.5.2. OLED
- 13.5.3. QLED
- 13.1. Market Analysis, Insights and Forecast - by Technology
- 14. North America Smart Television and Set-Top Box Market Analysis, Insights and Forecast, 2019-2031
- 14.1. Market Analysis, Insights and Forecast - By Country/Sub-region
- 14.1.1 United States
- 14.1.2 Canada
- 14.1.3 Mexico
- 15. Europe Smart Television and Set-Top Box Market Analysis, Insights and Forecast, 2019-2031
- 15.1. Market Analysis, Insights and Forecast - By Country/Sub-region
- 15.1.1 Germany
- 15.1.2 United Kingdom
- 15.1.3 France
- 15.1.4 Spain
- 15.1.5 Italy
- 15.1.6 Spain
- 15.1.7 Belgium
- 15.1.8 Netherland
- 15.1.9 Nordics
- 15.1.10 Rest of Europe
- 16. Asia Pacific Smart Television and Set-Top Box Market Analysis, Insights and Forecast, 2019-2031
- 16.1. Market Analysis, Insights and Forecast - By Country/Sub-region
- 16.1.1 China
- 16.1.2 Japan
- 16.1.3 India
- 16.1.4 South Korea
- 16.1.5 Southeast Asia
- 16.1.6 Australia
- 16.1.7 Indonesia
- 16.1.8 Phillipes
- 16.1.9 Singapore
- 16.1.10 Thailandc
- 16.1.11 Rest of Asia Pacific
- 17. South America Smart Television and Set-Top Box Market Analysis, Insights and Forecast, 2019-2031
- 17.1. Market Analysis, Insights and Forecast - By Country/Sub-region
- 17.1.1 Brazil
- 17.1.2 Argentina
- 17.1.3 Peru
- 17.1.4 Chile
- 17.1.5 Colombia
- 17.1.6 Ecuador
- 17.1.7 Venezuela
- 17.1.8 Rest of South America
- 18. North America Smart Television and Set-Top Box Market Analysis, Insights and Forecast, 2019-2031
- 18.1. Market Analysis, Insights and Forecast - By Country/Sub-region
- 18.1.1 United States
- 18.1.2 Canada
- 18.1.3 Mexico
- 19. MEA Smart Television and Set-Top Box Market Analysis, Insights and Forecast, 2019-2031
- 19.1. Market Analysis, Insights and Forecast - By Country/Sub-region
- 19.1.1 United Arab Emirates
- 19.1.2 Saudi Arabia
- 19.1.3 South Africa
- 19.1.4 Rest of Middle East and Africa
- 20. Competitive Analysis
- 20.1. Global Market Share Analysis 2024
- 20.2. Company Profiles
- 20.2.1 Hisense Group
- 20.2.1.1. Overview
- 20.2.1.2. Products
- 20.2.1.3. SWOT Analysis
- 20.2.1.4. Recent Developments
- 20.2.1.5. Financials (Based on Availability)
- 20.2.2 Gospell Digital Technology CO Limited
- 20.2.2.1. Overview
- 20.2.2.2. Products
- 20.2.2.3. SWOT Analysis
- 20.2.2.4. Recent Developments
- 20.2.2.5. Financials (Based on Availability)
- 20.2.3 TCL Electronics Holdings Limited
- 20.2.3.1. Overview
- 20.2.3.2. Products
- 20.2.3.3. SWOT Analysis
- 20.2.3.4. Recent Developments
- 20.2.3.5. Financials (Based on Availability)
- 20.2.4 Evolution Digital LLC
- 20.2.4.1. Overview
- 20.2.4.2. Products
- 20.2.4.3. SWOT Analysis
- 20.2.4.4. Recent Developments
- 20.2.4.5. Financials (Based on Availability)
- 20.2.5 Humax Holdings CO Ltd
- 20.2.5.1. Overview
- 20.2.5.2. Products
- 20.2.5.3. SWOT Analysis
- 20.2.5.4. Recent Developments
- 20.2.5.5. Financials (Based on Availability)
- 20.2.6 LG Electronics Inc
- 20.2.6.1. Overview
- 20.2.6.2. Products
- 20.2.6.3. SWOT Analysis
- 20.2.6.4. Recent Developments
- 20.2.6.5. Financials (Based on Availability)
- 20.2.7 Shenzhen Skyworth Digital Technology CO Ltd
- 20.2.7.1. Overview
- 20.2.7.2. Products
- 20.2.7.3. SWOT Analysis
- 20.2.7.4. Recent Developments
- 20.2.7.5. Financials (Based on Availability)
- 20.2.8 Shenzhen Coship Electronics CO Ltd
- 20.2.8.1. Overview
- 20.2.8.2. Products
- 20.2.8.3. SWOT Analysis
- 20.2.8.4. Recent Developments
- 20.2.8.5. Financials (Based on Availability)
- 20.2.9 Intek Digital Inc
- 20.2.9.1. Overview
- 20.2.9.2. Products
- 20.2.9.3. SWOT Analysis
- 20.2.9.4. Recent Developments
- 20.2.9.5. Financials (Based on Availability)
- 20.2.10 Arris International PLC (commscope Holding Company Inc)
- 20.2.10.1. Overview
- 20.2.10.2. Products
- 20.2.10.3. SWOT Analysis
- 20.2.10.4. Recent Developments
- 20.2.10.5. Financials (Based on Availability)
- 20.2.11 Sagemcom SAS
- 20.2.11.1. Overview
- 20.2.11.2. Products
- 20.2.11.3. SWOT Analysis
- 20.2.11.4. Recent Developments
- 20.2.11.5. Financials (Based on Availability)
- 20.2.12 ZTE Corporation
- 20.2.12.1. Overview
- 20.2.12.2. Products
- 20.2.12.3. SWOT Analysis
- 20.2.12.4. Recent Developments
- 20.2.12.5. Financials (Based on Availability)
- 20.2.13 Xiaomi Corporatio
- 20.2.13.1. Overview
- 20.2.13.2. Products
- 20.2.13.3. SWOT Analysis
- 20.2.13.4. Recent Developments
- 20.2.13.5. Financials (Based on Availability)
- 20.2.14 Kaonmedia CO Ltd
- 20.2.14.1. Overview
- 20.2.14.2. Products
- 20.2.14.3. SWOT Analysis
- 20.2.14.4. Recent Developments
- 20.2.14.5. Financials (Based on Availability)
- 20.2.15 Technicolor SA
- 20.2.15.1. Overview
- 20.2.15.2. Products
- 20.2.15.3. SWOT Analysis
- 20.2.15.4. Recent Developments
- 20.2.15.5. Financials (Based on Availability)
- 20.2.16 Samsung Electronics CO Ltd
- 20.2.16.1. Overview
- 20.2.16.2. Products
- 20.2.16.3. SWOT Analysis
- 20.2.16.4. Recent Developments
- 20.2.16.5. Financials (Based on Availability)
- 20.2.1 Hisense Group
List of Figures
- Figure 1: Global Smart Television and Set-Top Box Market Revenue Breakdown (Million, %) by Region 2024 & 2032
- Figure 2: Global Smart Television and Set-Top Box Market Volume Breakdown (K Unit, %) by Region 2024 & 2032
- Figure 3: North America Smart Television and Set-Top Box Market Revenue (Million), by Country 2024 & 2032
- Figure 4: North America Smart Television and Set-Top Box Market Volume (K Unit), by Country 2024 & 2032
- Figure 5: North America Smart Television and Set-Top Box Market Revenue Share (%), by Country 2024 & 2032
- Figure 6: North America Smart Television and Set-Top Box Market Volume Share (%), by Country 2024 & 2032
- Figure 7: Europe Smart Television and Set-Top Box Market Revenue (Million), by Country 2024 & 2032
- Figure 8: Europe Smart Television and Set-Top Box Market Volume (K Unit), by Country 2024 & 2032
- Figure 9: Europe Smart Television and Set-Top Box Market Revenue Share (%), by Country 2024 & 2032
- Figure 10: Europe Smart Television and Set-Top Box Market Volume Share (%), by Country 2024 & 2032
- Figure 11: Asia Pacific Smart Television and Set-Top Box Market Revenue (Million), by Country 2024 & 2032
- Figure 12: Asia Pacific Smart Television and Set-Top Box Market Volume (K Unit), by Country 2024 & 2032
- Figure 13: Asia Pacific Smart Television and Set-Top Box Market Revenue Share (%), by Country 2024 & 2032
- Figure 14: Asia Pacific Smart Television and Set-Top Box Market Volume Share (%), by Country 2024 & 2032
- Figure 15: South America Smart Television and Set-Top Box Market Revenue (Million), by Country 2024 & 2032
- Figure 16: South America Smart Television and Set-Top Box Market Volume (K Unit), by Country 2024 & 2032
- Figure 17: South America Smart Television and Set-Top Box Market Revenue Share (%), by Country 2024 & 2032
- Figure 18: South America Smart Television and Set-Top Box Market Volume Share (%), by Country 2024 & 2032
- Figure 19: North America Smart Television and Set-Top Box Market Revenue (Million), by Country 2024 & 2032
- Figure 20: North America Smart Television and Set-Top Box Market Volume (K Unit), by Country 2024 & 2032
- Figure 21: North America Smart Television and Set-Top Box Market Revenue Share (%), by Country 2024 & 2032
- Figure 22: North America Smart Television and Set-Top Box Market Volume Share (%), by Country 2024 & 2032
- Figure 23: MEA Smart Television and Set-Top Box Market Revenue (Million), by Country 2024 & 2032
- Figure 24: MEA Smart Television and Set-Top Box Market Volume (K Unit), by Country 2024 & 2032
- Figure 25: MEA Smart Television and Set-Top Box Market Revenue Share (%), by Country 2024 & 2032
- Figure 26: MEA Smart Television and Set-Top Box Market Volume Share (%), by Country 2024 & 2032
- Figure 27: North America Smart Television and Set-Top Box Market Revenue (Million), by Technology 2024 & 2032
- Figure 28: North America Smart Television and Set-Top Box Market Volume (K Unit), by Technology 2024 & 2032
- Figure 29: North America Smart Television and Set-Top Box Market Revenue Share (%), by Technology 2024 & 2032
- Figure 30: North America Smart Television and Set-Top Box Market Volume Share (%), by Technology 2024 & 2032
- Figure 31: North America Smart Television and Set-Top Box Market Revenue (Million), by Resolution 2024 & 2032
- Figure 32: North America Smart Television and Set-Top Box Market Volume (K Unit), by Resolution 2024 & 2032
- Figure 33: North America Smart Television and Set-Top Box Market Revenue Share (%), by Resolution 2024 & 2032
- Figure 34: North America Smart Television and Set-Top Box Market Volume Share (%), by Resolution 2024 & 2032
- Figure 35: North America Smart Television and Set-Top Box Market Revenue (Million), by Resolution 2024 & 2032
- Figure 36: North America Smart Television and Set-Top Box Market Volume (K Unit), by Resolution 2024 & 2032
- Figure 37: North America Smart Television and Set-Top Box Market Revenue Share (%), by Resolution 2024 & 2032
- Figure 38: North America Smart Television and Set-Top Box Market Volume Share (%), by Resolution 2024 & 2032
- Figure 39: North America Smart Television and Set-Top Box Market Revenue (Million), by Display Size (in Inches) 2024 & 2032
- Figure 40: North America Smart Television and Set-Top Box Market Volume (K Unit), by Display Size (in Inches) 2024 & 2032
- Figure 41: North America Smart Television and Set-Top Box Market Revenue Share (%), by Display Size (in Inches) 2024 & 2032
- Figure 42: North America Smart Television and Set-Top Box Market Volume Share (%), by Display Size (in Inches) 2024 & 2032
- Figure 43: North America Smart Television and Set-Top Box Market Revenue (Million), by Technology 2024 & 2032
- Figure 44: North America Smart Television and Set-Top Box Market Volume (K Unit), by Technology 2024 & 2032
- Figure 45: North America Smart Television and Set-Top Box Market Revenue Share (%), by Technology 2024 & 2032
- Figure 46: North America Smart Television and Set-Top Box Market Volume Share (%), by Technology 2024 & 2032
- Figure 47: North America Smart Television and Set-Top Box Market Revenue (Million), by Country 2024 & 2032
- Figure 48: North America Smart Television and Set-Top Box Market Volume (K Unit), by Country 2024 & 2032
- Figure 49: North America Smart Television and Set-Top Box Market Revenue Share (%), by Country 2024 & 2032
- Figure 50: North America Smart Television and Set-Top Box Market Volume Share (%), by Country 2024 & 2032
- Figure 51: Europe Smart Television and Set-Top Box Market Revenue (Million), by Technology 2024 & 2032
- Figure 52: Europe Smart Television and Set-Top Box Market Volume (K Unit), by Technology 2024 & 2032
- Figure 53: Europe Smart Television and Set-Top Box Market Revenue Share (%), by Technology 2024 & 2032
- Figure 54: Europe Smart Television and Set-Top Box Market Volume Share (%), by Technology 2024 & 2032
- Figure 55: Europe Smart Television and Set-Top Box Market Revenue (Million), by Resolution 2024 & 2032
- Figure 56: Europe Smart Television and Set-Top Box Market Volume (K Unit), by Resolution 2024 & 2032
- Figure 57: Europe Smart Television and Set-Top Box Market Revenue Share (%), by Resolution 2024 & 2032
- Figure 58: Europe Smart Television and Set-Top Box Market Volume Share (%), by Resolution 2024 & 2032
- Figure 59: Europe Smart Television and Set-Top Box Market Revenue (Million), by Resolution 2024 & 2032
- Figure 60: Europe Smart Television and Set-Top Box Market Volume (K Unit), by Resolution 2024 & 2032
- Figure 61: Europe Smart Television and Set-Top Box Market Revenue Share (%), by Resolution 2024 & 2032
- Figure 62: Europe Smart Television and Set-Top Box Market Volume Share (%), by Resolution 2024 & 2032
- Figure 63: Europe Smart Television and Set-Top Box Market Revenue (Million), by Display Size (in Inches) 2024 & 2032
- Figure 64: Europe Smart Television and Set-Top Box Market Volume (K Unit), by Display Size (in Inches) 2024 & 2032
- Figure 65: Europe Smart Television and Set-Top Box Market Revenue Share (%), by Display Size (in Inches) 2024 & 2032
- Figure 66: Europe Smart Television and Set-Top Box Market Volume Share (%), by Display Size (in Inches) 2024 & 2032
- Figure 67: Europe Smart Television and Set-Top Box Market Revenue (Million), by Technology 2024 & 2032
- Figure 68: Europe Smart Television and Set-Top Box Market Volume (K Unit), by Technology 2024 & 2032
- Figure 69: Europe Smart Television and Set-Top Box Market Revenue Share (%), by Technology 2024 & 2032
- Figure 70: Europe Smart Television and Set-Top Box Market Volume Share (%), by Technology 2024 & 2032
- Figure 71: Europe Smart Television and Set-Top Box Market Revenue (Million), by Country 2024 & 2032
- Figure 72: Europe Smart Television and Set-Top Box Market Volume (K Unit), by Country 2024 & 2032
- Figure 73: Europe Smart Television and Set-Top Box Market Revenue Share (%), by Country 2024 & 2032
- Figure 74: Europe Smart Television and Set-Top Box Market Volume Share (%), by Country 2024 & 2032
- Figure 75: Asia Pacific Smart Television and Set-Top Box Market Revenue (Million), by Technology 2024 & 2032
- Figure 76: Asia Pacific Smart Television and Set-Top Box Market Volume (K Unit), by Technology 2024 & 2032
- Figure 77: Asia Pacific Smart Television and Set-Top Box Market Revenue Share (%), by Technology 2024 & 2032
- Figure 78: Asia Pacific Smart Television and Set-Top Box Market Volume Share (%), by Technology 2024 & 2032
- Figure 79: Asia Pacific Smart Television and Set-Top Box Market Revenue (Million), by Resolution 2024 & 2032
- Figure 80: Asia Pacific Smart Television and Set-Top Box Market Volume (K Unit), by Resolution 2024 & 2032
- Figure 81: Asia Pacific Smart Television and Set-Top Box Market Revenue Share (%), by Resolution 2024 & 2032
- Figure 82: Asia Pacific Smart Television and Set-Top Box Market Volume Share (%), by Resolution 2024 & 2032
- Figure 83: Asia Pacific Smart Television and Set-Top Box Market Revenue (Million), by Resolution 2024 & 2032
- Figure 84: Asia Pacific Smart Television and Set-Top Box Market Volume (K Unit), by Resolution 2024 & 2032
- Figure 85: Asia Pacific Smart Television and Set-Top Box Market Revenue Share (%), by Resolution 2024 & 2032
- Figure 86: Asia Pacific Smart Television and Set-Top Box Market Volume Share (%), by Resolution 2024 & 2032
- Figure 87: Asia Pacific Smart Television and Set-Top Box Market Revenue (Million), by Display Size (in Inches) 2024 & 2032
- Figure 88: Asia Pacific Smart Television and Set-Top Box Market Volume (K Unit), by Display Size (in Inches) 2024 & 2032
- Figure 89: Asia Pacific Smart Television and Set-Top Box Market Revenue Share (%), by Display Size (in Inches) 2024 & 2032
- Figure 90: Asia Pacific Smart Television and Set-Top Box Market Volume Share (%), by Display Size (in Inches) 2024 & 2032
- Figure 91: Asia Pacific Smart Television and Set-Top Box Market Revenue (Million), by Technology 2024 & 2032
- Figure 92: Asia Pacific Smart Television and Set-Top Box Market Volume (K Unit), by Technology 2024 & 2032
- Figure 93: Asia Pacific Smart Television and Set-Top Box Market Revenue Share (%), by Technology 2024 & 2032
- Figure 94: Asia Pacific Smart Television and Set-Top Box Market Volume Share (%), by Technology 2024 & 2032
- Figure 95: Asia Pacific Smart Television and Set-Top Box Market Revenue (Million), by Country 2024 & 2032
- Figure 96: Asia Pacific Smart Television and Set-Top Box Market Volume (K Unit), by Country 2024 & 2032
- Figure 97: Asia Pacific Smart Television and Set-Top Box Market Revenue Share (%), by Country 2024 & 2032
- Figure 98: Asia Pacific Smart Television and Set-Top Box Market Volume Share (%), by Country 2024 & 2032
- Figure 99: Rest of the World Smart Television and Set-Top Box Market Revenue (Million), by Technology 2024 & 2032
- Figure 100: Rest of the World Smart Television and Set-Top Box Market Volume (K Unit), by Technology 2024 & 2032
- Figure 101: Rest of the World Smart Television and Set-Top Box Market Revenue Share (%), by Technology 2024 & 2032
- Figure 102: Rest of the World Smart Television and Set-Top Box Market Volume Share (%), by Technology 2024 & 2032
- Figure 103: Rest of the World Smart Television and Set-Top Box Market Revenue (Million), by Resolution 2024 & 2032
- Figure 104: Rest of the World Smart Television and Set-Top Box Market Volume (K Unit), by Resolution 2024 & 2032
- Figure 105: Rest of the World Smart Television and Set-Top Box Market Revenue Share (%), by Resolution 2024 & 2032
- Figure 106: Rest of the World Smart Television and Set-Top Box Market Volume Share (%), by Resolution 2024 & 2032
- Figure 107: Rest of the World Smart Television and Set-Top Box Market Revenue (Million), by Resolution 2024 & 2032
- Figure 108: Rest of the World Smart Television and Set-Top Box Market Volume (K Unit), by Resolution 2024 & 2032
- Figure 109: Rest of the World Smart Television and Set-Top Box Market Revenue Share (%), by Resolution 2024 & 2032
- Figure 110: Rest of the World Smart Television and Set-Top Box Market Volume Share (%), by Resolution 2024 & 2032
- Figure 111: Rest of the World Smart Television and Set-Top Box Market Revenue (Million), by Display Size (in Inches) 2024 & 2032
- Figure 112: Rest of the World Smart Television and Set-Top Box Market Volume (K Unit), by Display Size (in Inches) 2024 & 2032
- Figure 113: Rest of the World Smart Television and Set-Top Box Market Revenue Share (%), by Display Size (in Inches) 2024 & 2032
- Figure 114: Rest of the World Smart Television and Set-Top Box Market Volume Share (%), by Display Size (in Inches) 2024 & 2032
- Figure 115: Rest of the World Smart Television and Set-Top Box Market Revenue (Million), by Technology 2024 & 2032
- Figure 116: Rest of the World Smart Television and Set-Top Box Market Volume (K Unit), by Technology 2024 & 2032
- Figure 117: Rest of the World Smart Television and Set-Top Box Market Revenue Share (%), by Technology 2024 & 2032
- Figure 118: Rest of the World Smart Television and Set-Top Box Market Volume Share (%), by Technology 2024 & 2032
- Figure 119: Rest of the World Smart Television and Set-Top Box Market Revenue (Million), by Country 2024 & 2032
- Figure 120: Rest of the World Smart Television and Set-Top Box Market Volume (K Unit), by Country 2024 & 2032
- Figure 121: Rest of the World Smart Television and Set-Top Box Market Revenue Share (%), by Country 2024 & 2032
- Figure 122: Rest of the World Smart Television and Set-Top Box Market Volume Share (%), by Country 2024 & 2032
- Figure 123: North America Smart Television and Set-Top Box Market Revenue (Million), by Technology 2024 & 2032
- Figure 124: North America Smart Television and Set-Top Box Market Volume (K Unit), by Technology 2024 & 2032
- Figure 125: North America Smart Television and Set-Top Box Market Revenue Share (%), by Technology 2024 & 2032
- Figure 126: North America Smart Television and Set-Top Box Market Volume Share (%), by Technology 2024 & 2032
- Figure 127: North America Smart Television and Set-Top Box Market Revenue (Million), by Resolution 2024 & 2032
- Figure 128: North America Smart Television and Set-Top Box Market Volume (K Unit), by Resolution 2024 & 2032
- Figure 129: North America Smart Television and Set-Top Box Market Revenue Share (%), by Resolution 2024 & 2032
- Figure 130: North America Smart Television and Set-Top Box Market Volume Share (%), by Resolution 2024 & 2032
- Figure 131: North America Smart Television and Set-Top Box Market Revenue (Million), by Resolution 2024 & 2032
- Figure 132: North America Smart Television and Set-Top Box Market Volume (K Unit), by Resolution 2024 & 2032
- Figure 133: North America Smart Television and Set-Top Box Market Revenue Share (%), by Resolution 2024 & 2032
- Figure 134: North America Smart Television and Set-Top Box Market Volume Share (%), by Resolution 2024 & 2032
- Figure 135: North America Smart Television and Set-Top Box Market Revenue (Million), by Display Size (in Inches) 2024 & 2032
- Figure 136: North America Smart Television and Set-Top Box Market Volume (K Unit), by Display Size (in Inches) 2024 & 2032
- Figure 137: North America Smart Television and Set-Top Box Market Revenue Share (%), by Display Size (in Inches) 2024 & 2032
- Figure 138: North America Smart Television and Set-Top Box Market Volume Share (%), by Display Size (in Inches) 2024 & 2032
- Figure 139: North America Smart Television and Set-Top Box Market Revenue (Million), by Technology 2024 & 2032
- Figure 140: North America Smart Television and Set-Top Box Market Volume (K Unit), by Technology 2024 & 2032
- Figure 141: North America Smart Television and Set-Top Box Market Revenue Share (%), by Technology 2024 & 2032
- Figure 142: North America Smart Television and Set-Top Box Market Volume Share (%), by Technology 2024 & 2032
- Figure 143: North America Smart Television and Set-Top Box Market Revenue (Million), by Country 2024 & 2032
- Figure 144: North America Smart Television and Set-Top Box Market Volume (K Unit), by Country 2024 & 2032
- Figure 145: North America Smart Television and Set-Top Box Market Revenue Share (%), by Country 2024 & 2032
- Figure 146: North America Smart Television and Set-Top Box Market Volume Share (%), by Country 2024 & 2032
- Figure 147: Europe Smart Television and Set-Top Box Market Revenue (Million), by Technology 2024 & 2032
- Figure 148: Europe Smart Television and Set-Top Box Market Volume (K Unit), by Technology 2024 & 2032
- Figure 149: Europe Smart Television and Set-Top Box Market Revenue Share (%), by Technology 2024 & 2032
- Figure 150: Europe Smart Television and Set-Top Box Market Volume Share (%), by Technology 2024 & 2032
- Figure 151: Europe Smart Television and Set-Top Box Market Revenue (Million), by Resolution 2024 & 2032
- Figure 152: Europe Smart Television and Set-Top Box Market Volume (K Unit), by Resolution 2024 & 2032
- Figure 153: Europe Smart Television and Set-Top Box Market Revenue Share (%), by Resolution 2024 & 2032
- Figure 154: Europe Smart Television and Set-Top Box Market Volume Share (%), by Resolution 2024 & 2032
- Figure 155: Europe Smart Television and Set-Top Box Market Revenue (Million), by Resolution 2024 & 2032
- Figure 156: Europe Smart Television and Set-Top Box Market Volume (K Unit), by Resolution 2024 & 2032
- Figure 157: Europe Smart Television and Set-Top Box Market Revenue Share (%), by Resolution 2024 & 2032
- Figure 158: Europe Smart Television and Set-Top Box Market Volume Share (%), by Resolution 2024 & 2032
- Figure 159: Europe Smart Television and Set-Top Box Market Revenue (Million), by Display Size (in Inches) 2024 & 2032
- Figure 160: Europe Smart Television and Set-Top Box Market Volume (K Unit), by Display Size (in Inches) 2024 & 2032
- Figure 161: Europe Smart Television and Set-Top Box Market Revenue Share (%), by Display Size (in Inches) 2024 & 2032
- Figure 162: Europe Smart Television and Set-Top Box Market Volume Share (%), by Display Size (in Inches) 2024 & 2032
- Figure 163: Europe Smart Television and Set-Top Box Market Revenue (Million), by Technology 2024 & 2032
- Figure 164: Europe Smart Television and Set-Top Box Market Volume (K Unit), by Technology 2024 & 2032
- Figure 165: Europe Smart Television and Set-Top Box Market Revenue Share (%), by Technology 2024 & 2032
- Figure 166: Europe Smart Television and Set-Top Box Market Volume Share (%), by Technology 2024 & 2032
- Figure 167: Europe Smart Television and Set-Top Box Market Revenue (Million), by Country 2024 & 2032
- Figure 168: Europe Smart Television and Set-Top Box Market Volume (K Unit), by Country 2024 & 2032
- Figure 169: Europe Smart Television and Set-Top Box Market Revenue Share (%), by Country 2024 & 2032
- Figure 170: Europe Smart Television and Set-Top Box Market Volume Share (%), by Country 2024 & 2032
- Figure 171: Asia Pacific Smart Television and Set-Top Box Market Revenue (Million), by Technology 2024 & 2032
- Figure 172: Asia Pacific Smart Television and Set-Top Box Market Volume (K Unit), by Technology 2024 & 2032
- Figure 173: Asia Pacific Smart Television and Set-Top Box Market Revenue Share (%), by Technology 2024 & 2032
- Figure 174: Asia Pacific Smart Television and Set-Top Box Market Volume Share (%), by Technology 2024 & 2032
- Figure 175: Asia Pacific Smart Television and Set-Top Box Market Revenue (Million), by Resolution 2024 & 2032
- Figure 176: Asia Pacific Smart Television and Set-Top Box Market Volume (K Unit), by Resolution 2024 & 2032
- Figure 177: Asia Pacific Smart Television and Set-Top Box Market Revenue Share (%), by Resolution 2024 & 2032
- Figure 178: Asia Pacific Smart Television and Set-Top Box Market Volume Share (%), by Resolution 2024 & 2032
- Figure 179: Asia Pacific Smart Television and Set-Top Box Market Revenue (Million), by Resolution 2024 & 2032
- Figure 180: Asia Pacific Smart Television and Set-Top Box Market Volume (K Unit), by Resolution 2024 & 2032
- Figure 181: Asia Pacific Smart Television and Set-Top Box Market Revenue Share (%), by Resolution 2024 & 2032
- Figure 182: Asia Pacific Smart Television and Set-Top Box Market Volume Share (%), by Resolution 2024 & 2032
- Figure 183: Asia Pacific Smart Television and Set-Top Box Market Revenue (Million), by Display Size (in Inches) 2024 & 2032
- Figure 184: Asia Pacific Smart Television and Set-Top Box Market Volume (K Unit), by Display Size (in Inches) 2024 & 2032
- Figure 185: Asia Pacific Smart Television and Set-Top Box Market Revenue Share (%), by Display Size (in Inches) 2024 & 2032
- Figure 186: Asia Pacific Smart Television and Set-Top Box Market Volume Share (%), by Display Size (in Inches) 2024 & 2032
- Figure 187: Asia Pacific Smart Television and Set-Top Box Market Revenue (Million), by Technology 2024 & 2032
- Figure 188: Asia Pacific Smart Television and Set-Top Box Market Volume (K Unit), by Technology 2024 & 2032
- Figure 189: Asia Pacific Smart Television and Set-Top Box Market Revenue Share (%), by Technology 2024 & 2032
- Figure 190: Asia Pacific Smart Television and Set-Top Box Market Volume Share (%), by Technology 2024 & 2032
- Figure 191: Asia Pacific Smart Television and Set-Top Box Market Revenue (Million), by Country 2024 & 2032
- Figure 192: Asia Pacific Smart Television and Set-Top Box Market Volume (K Unit), by Country 2024 & 2032
- Figure 193: Asia Pacific Smart Television and Set-Top Box Market Revenue Share (%), by Country 2024 & 2032
- Figure 194: Asia Pacific Smart Television and Set-Top Box Market Volume Share (%), by Country 2024 & 2032
- Figure 195: Rest of the World Smart Television and Set-Top Box Market Revenue (Million), by Technology 2024 & 2032
- Figure 196: Rest of the World Smart Television and Set-Top Box Market Volume (K Unit), by Technology 2024 & 2032
- Figure 197: Rest of the World Smart Television and Set-Top Box Market Revenue Share (%), by Technology 2024 & 2032
- Figure 198: Rest of the World Smart Television and Set-Top Box Market Volume Share (%), by Technology 2024 & 2032
- Figure 199: Rest of the World Smart Television and Set-Top Box Market Revenue (Million), by Resolution 2024 & 2032
- Figure 200: Rest of the World Smart Television and Set-Top Box Market Volume (K Unit), by Resolution 2024 & 2032
- Figure 201: Rest of the World Smart Television and Set-Top Box Market Revenue Share (%), by Resolution 2024 & 2032
- Figure 202: Rest of the World Smart Television and Set-Top Box Market Volume Share (%), by Resolution 2024 & 2032
- Figure 203: Rest of the World Smart Television and Set-Top Box Market Revenue (Million), by Resolution 2024 & 2032
- Figure 204: Rest of the World Smart Television and Set-Top Box Market Volume (K Unit), by Resolution 2024 & 2032
- Figure 205: Rest of the World Smart Television and Set-Top Box Market Revenue Share (%), by Resolution 2024 & 2032
- Figure 206: Rest of the World Smart Television and Set-Top Box Market Volume Share (%), by Resolution 2024 & 2032
- Figure 207: Rest of the World Smart Television and Set-Top Box Market Revenue (Million), by Display Size (in Inches) 2024 & 2032
- Figure 208: Rest of the World Smart Television and Set-Top Box Market Volume (K Unit), by Display Size (in Inches) 2024 & 2032
- Figure 209: Rest of the World Smart Television and Set-Top Box Market Revenue Share (%), by Display Size (in Inches) 2024 & 2032
- Figure 210: Rest of the World Smart Television and Set-Top Box Market Volume Share (%), by Display Size (in Inches) 2024 & 2032
- Figure 211: Rest of the World Smart Television and Set-Top Box Market Revenue (Million), by Technology 2024 & 2032
- Figure 212: Rest of the World Smart Television and Set-Top Box Market Volume (K Unit), by Technology 2024 & 2032
- Figure 213: Rest of the World Smart Television and Set-Top Box Market Revenue Share (%), by Technology 2024 & 2032
- Figure 214: Rest of the World Smart Television and Set-Top Box Market Volume Share (%), by Technology 2024 & 2032
- Figure 215: Rest of the World Smart Television and Set-Top Box Market Revenue (Million), by Country 2024 & 2032
- Figure 216: Rest of the World Smart Television and Set-Top Box Market Volume (K Unit), by Country 2024 & 2032
- Figure 217: Rest of the World Smart Television and Set-Top Box Market Revenue Share (%), by Country 2024 & 2032
- Figure 218: Rest of the World Smart Television and Set-Top Box Market Volume Share (%), by Country 2024 & 2032
List of Tables
- Table 1: Global Smart Television and Set-Top Box Market Revenue Million Forecast, by Region 2019 & 2032
- Table 2: Global Smart Television and Set-Top Box Market Volume K Unit Forecast, by Region 2019 & 2032
- Table 3: Global Smart Television and Set-Top Box Market Revenue Million Forecast, by Technology 2019 & 2032
- Table 4: Global Smart Television and Set-Top Box Market Volume K Unit Forecast, by Technology 2019 & 2032
- Table 5: Global Smart Television and Set-Top Box Market Revenue Million Forecast, by Resolution 2019 & 2032
- Table 6: Global Smart Television and Set-Top Box Market Volume K Unit Forecast, by Resolution 2019 & 2032
- Table 7: Global Smart Television and Set-Top Box Market Revenue Million Forecast, by Resolution 2019 & 2032
- Table 8: Global Smart Television and Set-Top Box Market Volume K Unit Forecast, by Resolution 2019 & 2032
- Table 9: Global Smart Television and Set-Top Box Market Revenue Million Forecast, by Display Size (in Inches) 2019 & 2032
- Table 10: Global Smart Television and Set-Top Box Market Volume K Unit Forecast, by Display Size (in Inches) 2019 & 2032
- Table 11: Global Smart Television and Set-Top Box Market Revenue Million Forecast, by Technology 2019 & 2032
- Table 12: Global Smart Television and Set-Top Box Market Volume K Unit Forecast, by Technology 2019 & 2032
- Table 13: Global Smart Television and Set-Top Box Market Revenue Million Forecast, by Region 2019 & 2032
- Table 14: Global Smart Television and Set-Top Box Market Volume K Unit Forecast, by Region 2019 & 2032
- Table 15: Global Smart Television and Set-Top Box Market Revenue Million Forecast, by Country 2019 & 2032
- Table 16: Global Smart Television and Set-Top Box Market Volume K Unit Forecast, by Country 2019 & 2032
- Table 17: United States Smart Television and Set-Top Box Market Revenue (Million) Forecast, by Application 2019 & 2032
- Table 18: United States Smart Television and Set-Top Box Market Volume (K Unit) Forecast, by Application 2019 & 2032
- Table 19: Canada Smart Television and Set-Top Box Market Revenue (Million) Forecast, by Application 2019 & 2032
- Table 20: Canada Smart Television and Set-Top Box Market Volume (K Unit) Forecast, by Application 2019 & 2032
- Table 21: Mexico Smart Television and Set-Top Box Market Revenue (Million) Forecast, by Application 2019 & 2032
- Table 22: Mexico Smart Television and Set-Top Box Market Volume (K Unit) Forecast, by Application 2019 & 2032
- Table 23: Global Smart Television and Set-Top Box Market Revenue Million Forecast, by Country 2019 & 2032
- Table 24: Global Smart Television and Set-Top Box Market Volume K Unit Forecast, by Country 2019 & 2032
- Table 25: Germany Smart Television and Set-Top Box Market Revenue (Million) Forecast, by Application 2019 & 2032
- Table 26: Germany Smart Television and Set-Top Box Market Volume (K Unit) Forecast, by Application 2019 & 2032
- Table 27: United Kingdom Smart Television and Set-Top Box Market Revenue (Million) Forecast, by Application 2019 & 2032
- Table 28: United Kingdom Smart Television and Set-Top Box Market Volume (K Unit) Forecast, by Application 2019 & 2032
- Table 29: France Smart Television and Set-Top Box Market Revenue (Million) Forecast, by Application 2019 & 2032
- Table 30: France Smart Television and Set-Top Box Market Volume (K Unit) Forecast, by Application 2019 & 2032
- Table 31: Spain Smart Television and Set-Top Box Market Revenue (Million) Forecast, by Application 2019 & 2032
- Table 32: Spain Smart Television and Set-Top Box Market Volume (K Unit) Forecast, by Application 2019 & 2032
- Table 33: Italy Smart Television and Set-Top Box Market Revenue (Million) Forecast, by Application 2019 & 2032
- Table 34: Italy Smart Television and Set-Top Box Market Volume (K Unit) Forecast, by Application 2019 & 2032
- Table 35: Spain Smart Television and Set-Top Box Market Revenue (Million) Forecast, by Application 2019 & 2032
- Table 36: Spain Smart Television and Set-Top Box Market Volume (K Unit) Forecast, by Application 2019 & 2032
- Table 37: Belgium Smart Television and Set-Top Box Market Revenue (Million) Forecast, by Application 2019 & 2032
- Table 38: Belgium Smart Television and Set-Top Box Market Volume (K Unit) Forecast, by Application 2019 & 2032
- Table 39: Netherland Smart Television and Set-Top Box Market Revenue (Million) Forecast, by Application 2019 & 2032
- Table 40: Netherland Smart Television and Set-Top Box Market Volume (K Unit) Forecast, by Application 2019 & 2032
- Table 41: Nordics Smart Television and Set-Top Box Market Revenue (Million) Forecast, by Application 2019 & 2032
- Table 42: Nordics Smart Television and Set-Top Box Market Volume (K Unit) Forecast, by Application 2019 & 2032
- Table 43: Rest of Europe Smart Television and Set-Top Box Market Revenue (Million) Forecast, by Application 2019 & 2032
- Table 44: Rest of Europe Smart Television and Set-Top Box Market Volume (K Unit) Forecast, by Application 2019 & 2032
- Table 45: Global Smart Television and Set-Top Box Market Revenue Million Forecast, by Country 2019 & 2032
- Table 46: Global Smart Television and Set-Top Box Market Volume K Unit Forecast, by Country 2019 & 2032
- Table 47: China Smart Television and Set-Top Box Market Revenue (Million) Forecast, by Application 2019 & 2032
- Table 48: China Smart Television and Set-Top Box Market Volume (K Unit) Forecast, by Application 2019 & 2032
- Table 49: Japan Smart Television and Set-Top Box Market Revenue (Million) Forecast, by Application 2019 & 2032
- Table 50: Japan Smart Television and Set-Top Box Market Volume (K Unit) Forecast, by Application 2019 & 2032
- Table 51: India Smart Television and Set-Top Box Market Revenue (Million) Forecast, by Application 2019 & 2032
- Table 52: India Smart Television and Set-Top Box Market Volume (K Unit) Forecast, by Application 2019 & 2032
- Table 53: South Korea Smart Television and Set-Top Box Market Revenue (Million) Forecast, by Application 2019 & 2032
- Table 54: South Korea Smart Television and Set-Top Box Market Volume (K Unit) Forecast, by Application 2019 & 2032
- Table 55: Southeast Asia Smart Television and Set-Top Box Market Revenue (Million) Forecast, by Application 2019 & 2032
- Table 56: Southeast Asia Smart Television and Set-Top Box Market Volume (K Unit) Forecast, by Application 2019 & 2032
- Table 57: Australia Smart Television and Set-Top Box Market Revenue (Million) Forecast, by Application 2019 & 2032
- Table 58: Australia Smart Television and Set-Top Box Market Volume (K Unit) Forecast, by Application 2019 & 2032
- Table 59: Indonesia Smart Television and Set-Top Box Market Revenue (Million) Forecast, by Application 2019 & 2032
- Table 60: Indonesia Smart Television and Set-Top Box Market Volume (K Unit) Forecast, by Application 2019 & 2032
- Table 61: Phillipes Smart Television and Set-Top Box Market Revenue (Million) Forecast, by Application 2019 & 2032
- Table 62: Phillipes Smart Television and Set-Top Box Market Volume (K Unit) Forecast, by Application 2019 & 2032
- Table 63: Singapore Smart Television and Set-Top Box Market Revenue (Million) Forecast, by Application 2019 & 2032
- Table 64: Singapore Smart Television and Set-Top Box Market Volume (K Unit) Forecast, by Application 2019 & 2032
- Table 65: Thailandc Smart Television and Set-Top Box Market Revenue (Million) Forecast, by Application 2019 & 2032
- Table 66: Thailandc Smart Television and Set-Top Box Market Volume (K Unit) Forecast, by Application 2019 & 2032
- Table 67: Rest of Asia Pacific Smart Television and Set-Top Box Market Revenue (Million) Forecast, by Application 2019 & 2032
- Table 68: Rest of Asia Pacific Smart Television and Set-Top Box Market Volume (K Unit) Forecast, by Application 2019 & 2032
- Table 69: Global Smart Television and Set-Top Box Market Revenue Million Forecast, by Country 2019 & 2032
- Table 70: Global Smart Television and Set-Top Box Market Volume K Unit Forecast, by Country 2019 & 2032
- Table 71: Brazil Smart Television and Set-Top Box Market Revenue (Million) Forecast, by Application 2019 & 2032
- Table 72: Brazil Smart Television and Set-Top Box Market Volume (K Unit) Forecast, by Application 2019 & 2032
- Table 73: Argentina Smart Television and Set-Top Box Market Revenue (Million) Forecast, by Application 2019 & 2032
- Table 74: Argentina Smart Television and Set-Top Box Market Volume (K Unit) Forecast, by Application 2019 & 2032
- Table 75: Peru Smart Television and Set-Top Box Market Revenue (Million) Forecast, by Application 2019 & 2032
- Table 76: Peru Smart Television and Set-Top Box Market Volume (K Unit) Forecast, by Application 2019 & 2032
- Table 77: Chile Smart Television and Set-Top Box Market Revenue (Million) Forecast, by Application 2019 & 2032
- Table 78: Chile Smart Television and Set-Top Box Market Volume (K Unit) Forecast, by Application 2019 & 2032
- Table 79: Colombia Smart Television and Set-Top Box Market Revenue (Million) Forecast, by Application 2019 & 2032
- Table 80: Colombia Smart Television and Set-Top Box Market Volume (K Unit) Forecast, by Application 2019 & 2032
- Table 81: Ecuador Smart Television and Set-Top Box Market Revenue (Million) Forecast, by Application 2019 & 2032
- Table 82: Ecuador Smart Television and Set-Top Box Market Volume (K Unit) Forecast, by Application 2019 & 2032
- Table 83: Venezuela Smart Television and Set-Top Box Market Revenue (Million) Forecast, by Application 2019 & 2032
- Table 84: Venezuela Smart Television and Set-Top Box Market Volume (K Unit) Forecast, by Application 2019 & 2032
- Table 85: Rest of South America Smart Television and Set-Top Box Market Revenue (Million) Forecast, by Application 2019 & 2032
- Table 86: Rest of South America Smart Television and Set-Top Box Market Volume (K Unit) Forecast, by Application 2019 & 2032
- Table 87: Global Smart Television and Set-Top Box Market Revenue Million Forecast, by Country 2019 & 2032
- Table 88: Global Smart Television and Set-Top Box Market Volume K Unit Forecast, by Country 2019 & 2032
- Table 89: United States Smart Television and Set-Top Box Market Revenue (Million) Forecast, by Application 2019 & 2032
- Table 90: United States Smart Television and Set-Top Box Market Volume (K Unit) Forecast, by Application 2019 & 2032
- Table 91: Canada Smart Television and Set-Top Box Market Revenue (Million) Forecast, by Application 2019 & 2032
- Table 92: Canada Smart Television and Set-Top Box Market Volume (K Unit) Forecast, by Application 2019 & 2032
- Table 93: Mexico Smart Television and Set-Top Box Market Revenue (Million) Forecast, by Application 2019 & 2032
- Table 94: Mexico Smart Television and Set-Top Box Market Volume (K Unit) Forecast, by Application 2019 & 2032
- Table 95: Global Smart Television and Set-Top Box Market Revenue Million Forecast, by Country 2019 & 2032
- Table 96: Global Smart Television and Set-Top Box Market Volume K Unit Forecast, by Country 2019 & 2032
- Table 97: United Arab Emirates Smart Television and Set-Top Box Market Revenue (Million) Forecast, by Application 2019 & 2032
- Table 98: United Arab Emirates Smart Television and Set-Top Box Market Volume (K Unit) Forecast, by Application 2019 & 2032
- Table 99: Saudi Arabia Smart Television and Set-Top Box Market Revenue (Million) Forecast, by Application 2019 & 2032
- Table 100: Saudi Arabia Smart Television and Set-Top Box Market Volume (K Unit) Forecast, by Application 2019 & 2032
- Table 101: South Africa Smart Television and Set-Top Box Market Revenue (Million) Forecast, by Application 2019 & 2032
- Table 102: South Africa Smart Television and Set-Top Box Market Volume (K Unit) Forecast, by Application 2019 & 2032
- Table 103: Rest of Middle East and Africa Smart Television and Set-Top Box Market Revenue (Million) Forecast, by Application 2019 & 2032
- Table 104: Rest of Middle East and Africa Smart Television and Set-Top Box Market Volume (K Unit) Forecast, by Application 2019 & 2032
- Table 105: Global Smart Television and Set-Top Box Market Revenue Million Forecast, by Technology 2019 & 2032
- Table 106: Global Smart Television and Set-Top Box Market Volume K Unit Forecast, by Technology 2019 & 2032
- Table 107: Global Smart Television and Set-Top Box Market Revenue Million Forecast, by Resolution 2019 & 2032
- Table 108: Global Smart Television and Set-Top Box Market Volume K Unit Forecast, by Resolution 2019 & 2032
- Table 109: Global Smart Television and Set-Top Box Market Revenue Million Forecast, by Resolution 2019 & 2032
- Table 110: Global Smart Television and Set-Top Box Market Volume K Unit Forecast, by Resolution 2019 & 2032
- Table 111: Global Smart Television and Set-Top Box Market Revenue Million Forecast, by Display Size (in Inches) 2019 & 2032
- Table 112: Global Smart Television and Set-Top Box Market Volume K Unit Forecast, by Display Size (in Inches) 2019 & 2032
- Table 113: Global Smart Television and Set-Top Box Market Revenue Million Forecast, by Technology 2019 & 2032
- Table 114: Global Smart Television and Set-Top Box Market Volume K Unit Forecast, by Technology 2019 & 2032
- Table 115: Global Smart Television and Set-Top Box Market Revenue Million Forecast, by Country 2019 & 2032
- Table 116: Global Smart Television and Set-Top Box Market Volume K Unit Forecast, by Country 2019 & 2032
- Table 117: Global Smart Television and Set-Top Box Market Revenue Million Forecast, by Technology 2019 & 2032
- Table 118: Global Smart Television and Set-Top Box Market Volume K Unit Forecast, by Technology 2019 & 2032
- Table 119: Global Smart Television and Set-Top Box Market Revenue Million Forecast, by Resolution 2019 & 2032
- Table 120: Global Smart Television and Set-Top Box Market Volume K Unit Forecast, by Resolution 2019 & 2032
- Table 121: Global Smart Television and Set-Top Box Market Revenue Million Forecast, by Resolution 2019 & 2032
- Table 122: Global Smart Television and Set-Top Box Market Volume K Unit Forecast, by Resolution 2019 & 2032
- Table 123: Global Smart Television and Set-Top Box Market Revenue Million Forecast, by Display Size (in Inches) 2019 & 2032
- Table 124: Global Smart Television and Set-Top Box Market Volume K Unit Forecast, by Display Size (in Inches) 2019 & 2032
- Table 125: Global Smart Television and Set-Top Box Market Revenue Million Forecast, by Technology 2019 & 2032
- Table 126: Global Smart Television and Set-Top Box Market Volume K Unit Forecast, by Technology 2019 & 2032
- Table 127: Global Smart Television and Set-Top Box Market Revenue Million Forecast, by Country 2019 & 2032
- Table 128: Global Smart Television and Set-Top Box Market Volume K Unit Forecast, by Country 2019 & 2032
- Table 129: Global Smart Television and Set-Top Box Market Revenue Million Forecast, by Technology 2019 & 2032
- Table 130: Global Smart Television and Set-Top Box Market Volume K Unit Forecast, by Technology 2019 & 2032
- Table 131: Global Smart Television and Set-Top Box Market Revenue Million Forecast, by Resolution 2019 & 2032
- Table 132: Global Smart Television and Set-Top Box Market Volume K Unit Forecast, by Resolution 2019 & 2032
- Table 133: Global Smart Television and Set-Top Box Market Revenue Million Forecast, by Resolution 2019 & 2032
- Table 134: Global Smart Television and Set-Top Box Market Volume K Unit Forecast, by Resolution 2019 & 2032
- Table 135: Global Smart Television and Set-Top Box Market Revenue Million Forecast, by Display Size (in Inches) 2019 & 2032
- Table 136: Global Smart Television and Set-Top Box Market Volume K Unit Forecast, by Display Size (in Inches) 2019 & 2032
- Table 137: Global Smart Television and Set-Top Box Market Revenue Million Forecast, by Technology 2019 & 2032
- Table 138: Global Smart Television and Set-Top Box Market Volume K Unit Forecast, by Technology 2019 & 2032
- Table 139: Global Smart Television and Set-Top Box Market Revenue Million Forecast, by Country 2019 & 2032
- Table 140: Global Smart Television and Set-Top Box Market Volume K Unit Forecast, by Country 2019 & 2032
- Table 141: Global Smart Television and Set-Top Box Market Revenue Million Forecast, by Technology 2019 & 2032
- Table 142: Global Smart Television and Set-Top Box Market Volume K Unit Forecast, by Technology 2019 & 2032
- Table 143: Global Smart Television and Set-Top Box Market Revenue Million Forecast, by Resolution 2019 & 2032
- Table 144: Global Smart Television and Set-Top Box Market Volume K Unit Forecast, by Resolution 2019 & 2032
- Table 145: Global Smart Television and Set-Top Box Market Revenue Million Forecast, by Resolution 2019 & 2032
- Table 146: Global Smart Television and Set-Top Box Market Volume K Unit Forecast, by Resolution 2019 & 2032
- Table 147: Global Smart Television and Set-Top Box Market Revenue Million Forecast, by Display Size (in Inches) 2019 & 2032
- Table 148: Global Smart Television and Set-Top Box Market Volume K Unit Forecast, by Display Size (in Inches) 2019 & 2032
- Table 149: Global Smart Television and Set-Top Box Market Revenue Million Forecast, by Technology 2019 & 2032
- Table 150: Global Smart Television and Set-Top Box Market Volume K Unit Forecast, by Technology 2019 & 2032
- Table 151: Global Smart Television and Set-Top Box Market Revenue Million Forecast, by Country 2019 & 2032
- Table 152: Global Smart Television and Set-Top Box Market Volume K Unit Forecast, by Country 2019 & 2032
- Table 153: Global Smart Television and Set-Top Box Market Revenue Million Forecast, by Technology 2019 & 2032
- Table 154: Global Smart Television and Set-Top Box Market Volume K Unit Forecast, by Technology 2019 & 2032
- Table 155: Global Smart Television and Set-Top Box Market Revenue Million Forecast, by Resolution 2019 & 2032
- Table 156: Global Smart Television and Set-Top Box Market Volume K Unit Forecast, by Resolution 2019 & 2032
- Table 157: Global Smart Television and Set-Top Box Market Revenue Million Forecast, by Resolution 2019 & 2032
- Table 158: Global Smart Television and Set-Top Box Market Volume K Unit Forecast, by Resolution 2019 & 2032
- Table 159: Global Smart Television and Set-Top Box Market Revenue Million Forecast, by Display Size (in Inches) 2019 & 2032
- Table 160: Global Smart Television and Set-Top Box Market Volume K Unit Forecast, by Display Size (in Inches) 2019 & 2032
- Table 161: Global Smart Television and Set-Top Box Market Revenue Million Forecast, by Technology 2019 & 2032
- Table 162: Global Smart Television and Set-Top Box Market Volume K Unit Forecast, by Technology 2019 & 2032
- Table 163: Global Smart Television and Set-Top Box Market Revenue Million Forecast, by Country 2019 & 2032
- Table 164: Global Smart Television and Set-Top Box Market Volume K Unit Forecast, by Country 2019 & 2032
- Table 165: Global Smart Television and Set-Top Box Market Revenue Million Forecast, by Technology 2019 & 2032
- Table 166: Global Smart Television and Set-Top Box Market Volume K Unit Forecast, by Technology 2019 & 2032
- Table 167: Global Smart Television and Set-Top Box Market Revenue Million Forecast, by Resolution 2019 & 2032
- Table 168: Global Smart Television and Set-Top Box Market Volume K Unit Forecast, by Resolution 2019 & 2032
- Table 169: Global Smart Television and Set-Top Box Market Revenue Million Forecast, by Resolution 2019 & 2032
- Table 170: Global Smart Television and Set-Top Box Market Volume K Unit Forecast, by Resolution 2019 & 2032
- Table 171: Global Smart Television and Set-Top Box Market Revenue Million Forecast, by Display Size (in Inches) 2019 & 2032
- Table 172: Global Smart Television and Set-Top Box Market Volume K Unit Forecast, by Display Size (in Inches) 2019 & 2032
- Table 173: Global Smart Television and Set-Top Box Market Revenue Million Forecast, by Technology 2019 & 2032
- Table 174: Global Smart Television and Set-Top Box Market Volume K Unit Forecast, by Technology 2019 & 2032
- Table 175: Global Smart Television and Set-Top Box Market Revenue Million Forecast, by Country 2019 & 2032
- Table 176: Global Smart Television and Set-Top Box Market Volume K Unit Forecast, by Country 2019 & 2032
- Table 177: Global Smart Television and Set-Top Box Market Revenue Million Forecast, by Technology 2019 & 2032
- Table 178: Global Smart Television and Set-Top Box Market Volume K Unit Forecast, by Technology 2019 & 2032
- Table 179: Global Smart Television and Set-Top Box Market Revenue Million Forecast, by Resolution 2019 & 2032
- Table 180: Global Smart Television and Set-Top Box Market Volume K Unit Forecast, by Resolution 2019 & 2032
- Table 181: Global Smart Television and Set-Top Box Market Revenue Million Forecast, by Resolution 2019 & 2032
- Table 182: Global Smart Television and Set-Top Box Market Volume K Unit Forecast, by Resolution 2019 & 2032
- Table 183: Global Smart Television and Set-Top Box Market Revenue Million Forecast, by Display Size (in Inches) 2019 & 2032
- Table 184: Global Smart Television and Set-Top Box Market Volume K Unit Forecast, by Display Size (in Inches) 2019 & 2032
- Table 185: Global Smart Television and Set-Top Box Market Revenue Million Forecast, by Technology 2019 & 2032
- Table 186: Global Smart Television and Set-Top Box Market Volume K Unit Forecast, by Technology 2019 & 2032
- Table 187: Global Smart Television and Set-Top Box Market Revenue Million Forecast, by Country 2019 & 2032
- Table 188: Global Smart Television and Set-Top Box Market Volume K Unit Forecast, by Country 2019 & 2032
- Table 189: Global Smart Television and Set-Top Box Market Revenue Million Forecast, by Technology 2019 & 2032
- Table 190: Global Smart Television and Set-Top Box Market Volume K Unit Forecast, by Technology 2019 & 2032
- Table 191: Global Smart Television and Set-Top Box Market Revenue Million Forecast, by Resolution 2019 & 2032
- Table 192: Global Smart Television and Set-Top Box Market Volume K Unit Forecast, by Resolution 2019 & 2032
- Table 193: Global Smart Television and Set-Top Box Market Revenue Million Forecast, by Resolution 2019 & 2032
- Table 194: Global Smart Television and Set-Top Box Market Volume K Unit Forecast, by Resolution 2019 & 2032
- Table 195: Global Smart Television and Set-Top Box Market Revenue Million Forecast, by Display Size (in Inches) 2019 & 2032
- Table 196: Global Smart Television and Set-Top Box Market Volume K Unit Forecast, by Display Size (in Inches) 2019 & 2032
- Table 197: Global Smart Television and Set-Top Box Market Revenue Million Forecast, by Technology 2019 & 2032
- Table 198: Global Smart Television and Set-Top Box Market Volume K Unit Forecast, by Technology 2019 & 2032
- Table 199: Global Smart Television and Set-Top Box Market Revenue Million Forecast, by Country 2019 & 2032
- Table 200: Global Smart Television and Set-Top Box Market Volume K Unit Forecast, by Country 2019 & 2032
Frequently Asked Questions
1. What is the projected Compound Annual Growth Rate (CAGR) of the Smart Television and Set-Top Box Market?
The projected CAGR is approximately 2.21%.
2. Which companies are prominent players in the Smart Television and Set-Top Box Market?
Key companies in the market include Hisense Group, Gospell Digital Technology CO Limited, TCL Electronics Holdings Limited, Evolution Digital LLC, Humax Holdings CO Ltd, LG Electronics Inc, Shenzhen Skyworth Digital Technology CO Ltd, Shenzhen Coship Electronics CO Ltd, Intek Digital Inc, Arris International PLC (commscope Holding Company Inc), Sagemcom SAS, ZTE Corporation, Xiaomi Corporatio, Kaonmedia CO Ltd, Technicolor SA, Samsung Electronics CO Ltd.
3. What are the main segments of the Smart Television and Set-Top Box Market?
The market segments include Technology, Resolution, Resolution, Display Size (in Inches), Technology.
4. Can you provide details about the market size?
The market size is estimated to be USD XX Million as of 2022.
5. What are some drivers contributing to market growth?
High Levels of Technological Innovations; Growing Adoption In The Emerging Markets; Deployment Of OS-based Devices.
6. What are the notable trends driving market growth?
High Levels of Technological Innovations to Drive the Market.
7. Are there any restraints impacting market growth?
Growing Production Costs and Vendor Consolidation.
8. Can you provide examples of recent developments in the market?
August 2022 - Samsung announced to launch of Samsung OLED in Australia, thereby expanding its 2022 TV line-up. The TV features over 8 million self-lit pixels partnered with Quantum Dot Technology that can deliver brighter, more accurate highlights and realistic colors.
9. What pricing options are available for accessing the report?
Pricing options include single-user, multi-user, and enterprise licenses priced at USD 4750, USD 5250, and USD 8750 respectively.
10. Is the market size provided in terms of value or volume?
The market size is provided in terms of value, measured in Million and volume, measured in K Unit.
11. Are there any specific market keywords associated with the report?
Yes, the market keyword associated with the report is "Smart Television and Set-Top Box Market," which aids in identifying and referencing the specific market segment covered.
12. How do I determine which pricing option suits my needs best?
The pricing options vary based on user requirements and access needs. Individual users may opt for single-user licenses, while businesses requiring broader access may choose multi-user or enterprise licenses for cost-effective access to the report.
13. Are there any additional resources or data provided in the Smart Television and Set-Top Box Market report?
While the report offers comprehensive insights, it's advisable to review the specific contents or supplementary materials provided to ascertain if additional resources or data are available.
14. How can I stay updated on further developments or reports in the Smart Television and Set-Top Box Market?
To stay informed about further developments, trends, and reports in the Smart Television and Set-Top Box Market, consider subscribing to industry newsletters, following relevant companies and organizations, or regularly checking reputable industry news sources and publications.
Methodology
Step 1 - Identification of Relevant Samples Size from Population Database


Step 2 - Approaches for Defining Global Market Size (Value, Volume* & Price*)

Note*: In applicable scenarios
Step 3 - Data Sources
Primary Research
- Web Analytics
- Survey Reports
- Research Institute
- Latest Research Reports
- Opinion Leaders
Secondary Research
- Annual Reports
- White Paper
- Latest Press Release
- Industry Association
- Paid Database
- Investor Presentations

Step 4 - Data Triangulation
Involves using different sources of information in order to increase the validity of a study
These sources are likely to be stakeholders in a program - participants, other researchers, program staff, other community members, and so on.
Then we put all data in single framework & apply various statistical tools to find out the dynamic on the market.
During the analysis stage, feedback from the stakeholder groups would be compared to determine areas of agreement as well as areas of divergence
