

Key Insights
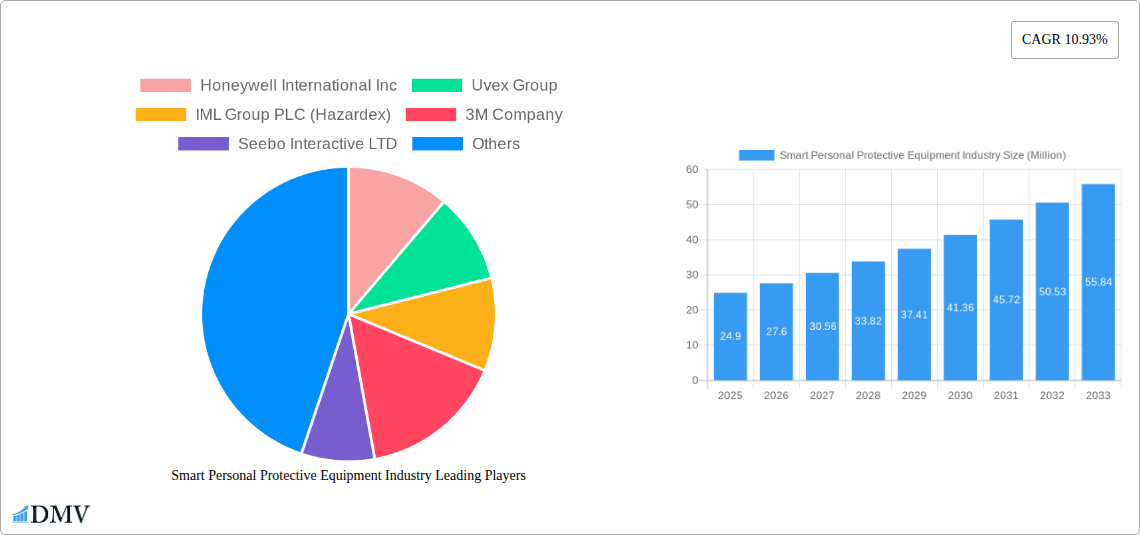
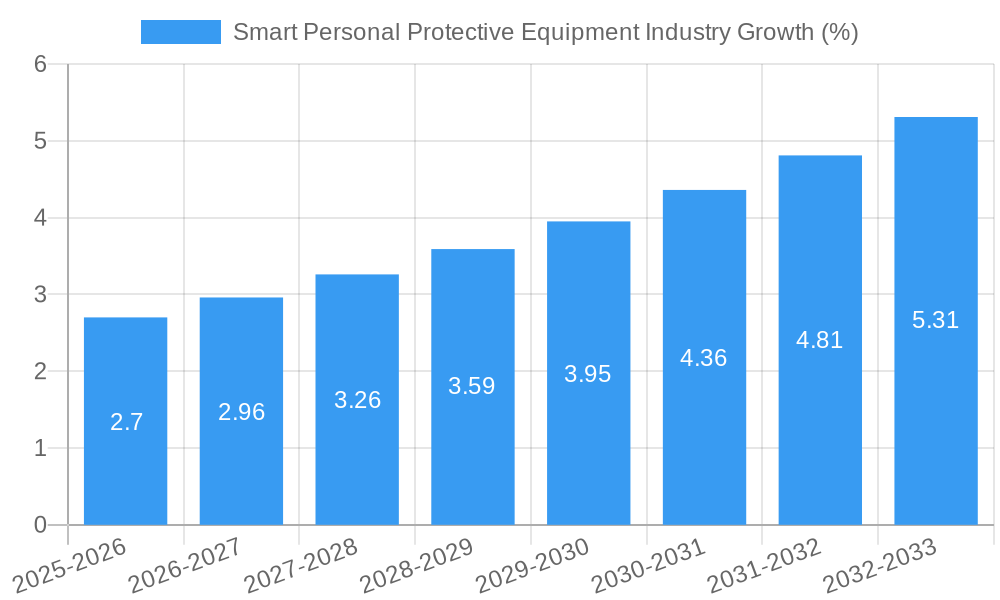
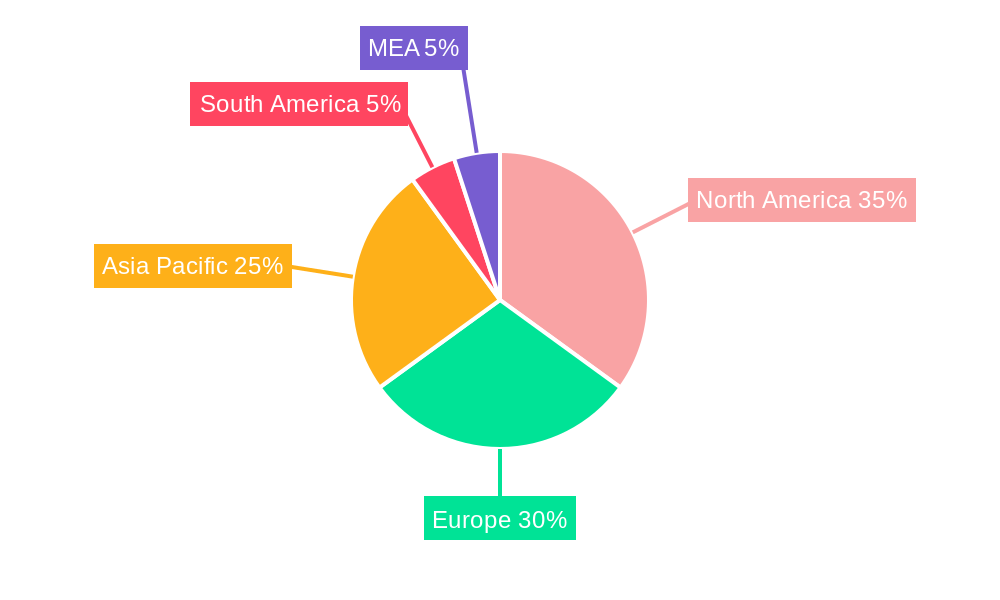
The global Smart Personal Protective Equipment (PPE) market is experiencing robust growth, projected to reach \$24.90 million in 2025 and exhibiting a Compound Annual Growth Rate (CAGR) of 10.93% from 2025 to 2033. This expansion is driven by several key factors. Increasing awareness of workplace safety and rising regulatory pressures mandating the use of advanced safety gear are significant contributors. Furthermore, technological advancements in sensor technology, connectivity, and data analytics are enabling the development of smarter, more efficient, and safer PPE solutions. The integration of features like real-time monitoring, location tracking, and fall detection significantly enhances worker safety and reduces workplace incidents. The construction, mining, and oil & gas sectors are major adopters, owing to their inherently hazardous work environments. However, high initial investment costs associated with smart PPE and the need for robust infrastructure to support data transmission can act as market restraints, particularly in developing economies. The market is segmented by PPE type (eye and face protection, hearing protection, head protection, fall protection, smart clothing, others) and end-user industry (construction, mining, oil & gas, manufacturing, automotive, others). North America and Europe currently hold significant market shares, but the Asia-Pacific region is poised for substantial growth driven by increasing industrialization and infrastructure development.
The competitive landscape is dynamic, with established players like Honeywell International Inc., 3M Company, and Uvex Group alongside emerging technology companies like Seebo Interactive and Daqri. These companies are focusing on developing innovative products and partnerships to cater to the growing demand for advanced safety solutions. Future market growth will depend on the continuous innovation of smart PPE technologies, the development of cost-effective solutions, and the wider adoption of these technologies across diverse industries and geographic regions. The focus will shift towards enhancing data analytics capabilities to provide actionable insights, improving worker training programs centered on smart PPE usage, and ensuring seamless integration with existing safety management systems. Addressing interoperability concerns and establishing industry standards will also be crucial for driving wider market penetration and ensuring consistent data quality.
Smart Personal Protective Equipment (PPE) Industry Market Report: 2019-2033
This comprehensive report provides an in-depth analysis of the Smart Personal Protective Equipment (PPE) industry, offering invaluable insights for stakeholders seeking to navigate this rapidly evolving market. With a study period spanning 2019-2033, a base year of 2025, and a forecast period of 2025-2033, this report delivers a robust understanding of current trends and future projections. The market is valued at xx Million in 2025 and is projected to reach xx Million by 2033.
Smart Personal Protective Equipment Industry Market Composition & Trends
The Smart PPE market is characterized by moderate concentration, with key players like Honeywell International Inc, 3M Company, and Uvex Group holding significant market share. However, the emergence of innovative startups like Seebo Interactive LTD and Intellinium is disrupting the traditional landscape. Market share distribution in 2025 is estimated as follows: Honeywell International Inc (xx%), 3M Company (xx%), Uvex Group (xx%), and Others (xx%). Innovation is driven by advancements in sensor technology, connectivity, and data analytics, enabling real-time monitoring and enhanced worker safety. Regulatory landscapes, varying across regions, are playing a crucial role in shaping market adoption. Substitute products, while limited, include traditional PPE, but the superior safety and efficiency of smart PPE are driving market growth. End-users are predominantly in high-risk industries such as construction, mining, and oil & gas. M&A activity in the sector has been moderate, with deal values averaging xx Million in the past five years.
- Market Concentration: Moderately concentrated, with a few major players dominating.
- Innovation Catalysts: Advancements in sensor technology, connectivity, and data analytics.
- Regulatory Landscape: Varying across regions, influencing adoption rates.
- Substitute Products: Traditional PPE, but with limited competitiveness.
- End-User Profiles: Predominantly high-risk industries (Construction, Mining, Oil & Gas).
- M&A Activity: Moderate, with average deal values of xx Million.
Smart Personal Protective Equipment Industry Industry Evolution
The Smart PPE market has witnessed significant growth, fueled by increasing awareness of workplace safety and technological advancements. From 2019 to 2024, the market experienced a Compound Annual Growth Rate (CAGR) of xx%, driven by factors such as stringent safety regulations and the rising demand for enhanced worker protection. Technological advancements, including the integration of AI and IoT, are transforming the capabilities of smart PPE, enabling predictive maintenance and real-time hazard detection. Consumer demand is shifting towards more user-friendly, comfortable, and data-driven PPE solutions, influencing product design and functionality. The market is expected to maintain a robust growth trajectory during the forecast period (2025-2033), with a projected CAGR of xx%, driven by increasing adoption across various end-user industries. The adoption rate of smart PPE is expected to increase from xx% in 2025 to xx% by 2033, reflecting growing acceptance and integration into operational workflows.
Leading Regions, Countries, or Segments in Smart Personal Protective Equipment Industry
North America currently holds the leading position in the Smart PPE market, driven by robust technological advancements, stringent safety regulations, and high investment in worker safety initiatives.
Key Drivers for North America:
- High levels of technological innovation and adoption.
- Stringent safety regulations and compliance requirements.
- Significant investments in worker safety and productivity.
Dominant Segments:
- Type: Fall Protection and Head Protection are currently the largest segments, driven by high demand in construction and industrial applications.
- End-User Industry: Construction and Manufacturing account for the largest market share.
Within the Type segment, Eye and face protection demonstrates promising growth potential due to increasing adoption of technologically advanced solutions, while Smart Clothing is expected to show significant growth driven by advancements in material science and improved comfort. In terms of End-User Industry, the Mining and Oil & Gas sectors show considerable growth potential due to their inherently hazardous working conditions and increasing focus on worker safety.
Smart Personal Protective Equipment Industry Product Innovations
Recent product innovations include the integration of advanced sensors for real-time monitoring of vital signs and environmental hazards, improved connectivity features for seamless data transmission, and the development of more ergonomic and comfortable designs. These advancements offer improved worker safety, enhanced data analysis capabilities, and increased productivity. The unique selling propositions revolve around improved safety, enhanced situational awareness, and real-time data for better decision-making. Technological advancements include the use of AI-powered analytics for predictive maintenance and the integration of augmented reality (AR) for improved visualization and guidance.
Propelling Factors for Smart Personal Protective Equipment Industry Growth
Technological advancements, particularly in sensor technology, connectivity, and data analytics, are pivotal in driving market growth. The increasing focus on workplace safety and the implementation of stricter regulations are also significant contributing factors. Economic factors, such as the rising cost of workplace accidents, are incentivizing businesses to invest in advanced safety solutions, further propelling market expansion.
Obstacles in the Smart Personal Protective Equipment Industry Market
High initial investment costs for smart PPE can be a barrier to adoption, particularly for smaller companies. Supply chain disruptions and the dependence on specialized components can also impact market growth. Competitive pressures from established PPE manufacturers and the emergence of new players necessitate continuous innovation and adaptation.
Future Opportunities in Smart Personal Protective Equipment Industry
Emerging markets in developing economies present significant growth potential, driven by increasing industrialization and rising awareness of worker safety. The integration of new technologies, such as 5G connectivity and advanced AI algorithms, offers opportunities for enhanced functionality and data analytics capabilities. Consumer demand for personalized and customizable PPE solutions is likely to increase, presenting opportunities for product differentiation and innovation.
Major Players in the Smart Personal Protective Equipment Industry Ecosystem
- Honeywell International Inc
- Uvex Group
- IML Group PLC (Hazardex)
- 3M Company
- Seebo Interactive LTD
- Tenacious Holdings Inc (dba Ergodyne)
- Intellinium
- Daqri
- Vuzix Corp
- Corvex Connected Worker
Key Developments in Smart Personal Protective Equipment Industry Industry
- 2023-Q3: 3M launched a new line of smart helmets with integrated communication and data capture capabilities.
- 2022-Q4: Honeywell announced a strategic partnership with a technology provider to integrate advanced AI algorithms into its smart PPE offerings.
- 2021-Q2: Uvex acquired a smaller company specializing in smart clothing technology. (Further developments to be added based on data availability)
Strategic Smart Personal Protective Equipment Industry Market Forecast
The Smart PPE market is poised for continued growth, driven by technological advancements, regulatory pressures, and increasing awareness of workplace safety. The forecast period (2025-2033) anticipates a substantial expansion, with promising opportunities in emerging markets and innovative product categories. The integration of AI, IoT, and AR technologies will further enhance the functionality and appeal of smart PPE, fostering wider adoption across various industries.
Smart Personal Protective Equipment Industry Segmentation
-
1. Type
- 1.1. Eye and Face Protection
- 1.2. Hearing Protection
- 1.3. Head Protection
- 1.4. Fall Protection
- 1.5. Smart Clothing
- 1.6. Other Types
-
2. End-user Industry
- 2.1. Construction
- 2.2. Mining
- 2.3. Oil and Gas
- 2.4. Manufacturing
- 2.5. Automotive
- 2.6. Other End-user Industries
Smart Personal Protective Equipment Industry Segmentation By Geography
- 1. North America
- 2. Europe
- 3. Asia
- 4. Australia and New Zealand
- 5. Latin America
- 6. Middle East and Africa
Smart Personal Protective Equipment Industry REPORT HIGHLIGHTS
| Aspects | Details |
|---|---|
| Study Period | 2019-2033 |
| Base Year | 2024 |
| Estimated Year | 2025 |
| Forecast Period | 2025-2033 |
| Historical Period | 2019-2024 |
| Growth Rate | CAGR of 10.93% from 2019-2033 |
| Segmentation |
|
Table of Contents
- 1. Introduction
- 1.1. Research Scope
- 1.2. Market Segmentation
- 1.3. Research Methodology
- 1.4. Definitions and Assumptions
- 2. Executive Summary
- 2.1. Introduction
- 3. Market Dynamics
- 3.1. Introduction
- 3.2. Market Drivers
- 3.2.1. ; Improvement in worker productivity and decrease in worker injury; Increase in the development in IoT and connectivity technologies
- 3.3. Market Restrains
- 3.3.1. ; Growing concerns related to security of personal information; Stringent work regulations at operating facilities
- 3.4. Market Trends
- 3.4.1. The usage of Smart PPE in construction to witness a significant growth
- 4. Market Factor Analysis
- 4.1. Porters Five Forces
- 4.2. Supply/Value Chain
- 4.3. PESTEL analysis
- 4.4. Market Entropy
- 4.5. Patent/Trademark Analysis
- 5. Global Smart Personal Protective Equipment Industry Analysis, Insights and Forecast, 2019-2031
- 5.1. Market Analysis, Insights and Forecast - by Type
- 5.1.1. Eye and Face Protection
- 5.1.2. Hearing Protection
- 5.1.3. Head Protection
- 5.1.4. Fall Protection
- 5.1.5. Smart Clothing
- 5.1.6. Other Types
- 5.2. Market Analysis, Insights and Forecast - by End-user Industry
- 5.2.1. Construction
- 5.2.2. Mining
- 5.2.3. Oil and Gas
- 5.2.4. Manufacturing
- 5.2.5. Automotive
- 5.2.6. Other End-user Industries
- 5.3. Market Analysis, Insights and Forecast - by Region
- 5.3.1. North America
- 5.3.2. Europe
- 5.3.3. Asia
- 5.3.4. Australia and New Zealand
- 5.3.5. Latin America
- 5.3.6. Middle East and Africa
- 5.1. Market Analysis, Insights and Forecast - by Type
- 6. North America Smart Personal Protective Equipment Industry Analysis, Insights and Forecast, 2019-2031
- 6.1. Market Analysis, Insights and Forecast - by Type
- 6.1.1. Eye and Face Protection
- 6.1.2. Hearing Protection
- 6.1.3. Head Protection
- 6.1.4. Fall Protection
- 6.1.5. Smart Clothing
- 6.1.6. Other Types
- 6.2. Market Analysis, Insights and Forecast - by End-user Industry
- 6.2.1. Construction
- 6.2.2. Mining
- 6.2.3. Oil and Gas
- 6.2.4. Manufacturing
- 6.2.5. Automotive
- 6.2.6. Other End-user Industries
- 6.1. Market Analysis, Insights and Forecast - by Type
- 7. Europe Smart Personal Protective Equipment Industry Analysis, Insights and Forecast, 2019-2031
- 7.1. Market Analysis, Insights and Forecast - by Type
- 7.1.1. Eye and Face Protection
- 7.1.2. Hearing Protection
- 7.1.3. Head Protection
- 7.1.4. Fall Protection
- 7.1.5. Smart Clothing
- 7.1.6. Other Types
- 7.2. Market Analysis, Insights and Forecast - by End-user Industry
- 7.2.1. Construction
- 7.2.2. Mining
- 7.2.3. Oil and Gas
- 7.2.4. Manufacturing
- 7.2.5. Automotive
- 7.2.6. Other End-user Industries
- 7.1. Market Analysis, Insights and Forecast - by Type
- 8. Asia Smart Personal Protective Equipment Industry Analysis, Insights and Forecast, 2019-2031
- 8.1. Market Analysis, Insights and Forecast - by Type
- 8.1.1. Eye and Face Protection
- 8.1.2. Hearing Protection
- 8.1.3. Head Protection
- 8.1.4. Fall Protection
- 8.1.5. Smart Clothing
- 8.1.6. Other Types
- 8.2. Market Analysis, Insights and Forecast - by End-user Industry
- 8.2.1. Construction
- 8.2.2. Mining
- 8.2.3. Oil and Gas
- 8.2.4. Manufacturing
- 8.2.5. Automotive
- 8.2.6. Other End-user Industries
- 8.1. Market Analysis, Insights and Forecast - by Type
- 9. Australia and New Zealand Smart Personal Protective Equipment Industry Analysis, Insights and Forecast, 2019-2031
- 9.1. Market Analysis, Insights and Forecast - by Type
- 9.1.1. Eye and Face Protection
- 9.1.2. Hearing Protection
- 9.1.3. Head Protection
- 9.1.4. Fall Protection
- 9.1.5. Smart Clothing
- 9.1.6. Other Types
- 9.2. Market Analysis, Insights and Forecast - by End-user Industry
- 9.2.1. Construction
- 9.2.2. Mining
- 9.2.3. Oil and Gas
- 9.2.4. Manufacturing
- 9.2.5. Automotive
- 9.2.6. Other End-user Industries
- 9.1. Market Analysis, Insights and Forecast - by Type
- 10. Latin America Smart Personal Protective Equipment Industry Analysis, Insights and Forecast, 2019-2031
- 10.1. Market Analysis, Insights and Forecast - by Type
- 10.1.1. Eye and Face Protection
- 10.1.2. Hearing Protection
- 10.1.3. Head Protection
- 10.1.4. Fall Protection
- 10.1.5. Smart Clothing
- 10.1.6. Other Types
- 10.2. Market Analysis, Insights and Forecast - by End-user Industry
- 10.2.1. Construction
- 10.2.2. Mining
- 10.2.3. Oil and Gas
- 10.2.4. Manufacturing
- 10.2.5. Automotive
- 10.2.6. Other End-user Industries
- 10.1. Market Analysis, Insights and Forecast - by Type
- 11. Middle East and Africa Smart Personal Protective Equipment Industry Analysis, Insights and Forecast, 2019-2031
- 11.1. Market Analysis, Insights and Forecast - by Type
- 11.1.1. Eye and Face Protection
- 11.1.2. Hearing Protection
- 11.1.3. Head Protection
- 11.1.4. Fall Protection
- 11.1.5. Smart Clothing
- 11.1.6. Other Types
- 11.2. Market Analysis, Insights and Forecast - by End-user Industry
- 11.2.1. Construction
- 11.2.2. Mining
- 11.2.3. Oil and Gas
- 11.2.4. Manufacturing
- 11.2.5. Automotive
- 11.2.6. Other End-user Industries
- 11.1. Market Analysis, Insights and Forecast - by Type
- 12. North America Smart Personal Protective Equipment Industry Analysis, Insights and Forecast, 2019-2031
- 12.1. Market Analysis, Insights and Forecast - By Country/Sub-region
- 12.1.1 United States
- 12.1.2 Canada
- 12.1.3 Mexico
- 13. Europe Smart Personal Protective Equipment Industry Analysis, Insights and Forecast, 2019-2031
- 13.1. Market Analysis, Insights and Forecast - By Country/Sub-region
- 13.1.1 Germany
- 13.1.2 United Kingdom
- 13.1.3 France
- 13.1.4 Spain
- 13.1.5 Italy
- 13.1.6 Spain
- 13.1.7 Belgium
- 13.1.8 Netherland
- 13.1.9 Nordics
- 13.1.10 Rest of Europe
- 14. Asia Pacific Smart Personal Protective Equipment Industry Analysis, Insights and Forecast, 2019-2031
- 14.1. Market Analysis, Insights and Forecast - By Country/Sub-region
- 14.1.1 China
- 14.1.2 Japan
- 14.1.3 India
- 14.1.4 South Korea
- 14.1.5 Southeast Asia
- 14.1.6 Australia
- 14.1.7 Indonesia
- 14.1.8 Phillipes
- 14.1.9 Singapore
- 14.1.10 Thailandc
- 14.1.11 Rest of Asia Pacific
- 15. South America Smart Personal Protective Equipment Industry Analysis, Insights and Forecast, 2019-2031
- 15.1. Market Analysis, Insights and Forecast - By Country/Sub-region
- 15.1.1 Brazil
- 15.1.2 Argentina
- 15.1.3 Peru
- 15.1.4 Chile
- 15.1.5 Colombia
- 15.1.6 Ecuador
- 15.1.7 Venezuela
- 15.1.8 Rest of South America
- 16. North America Smart Personal Protective Equipment Industry Analysis, Insights and Forecast, 2019-2031
- 16.1. Market Analysis, Insights and Forecast - By Country/Sub-region
- 16.1.1 United States
- 16.1.2 Canada
- 16.1.3 Mexico
- 17. MEA Smart Personal Protective Equipment Industry Analysis, Insights and Forecast, 2019-2031
- 17.1. Market Analysis, Insights and Forecast - By Country/Sub-region
- 17.1.1 United Arab Emirates
- 17.1.2 Saudi Arabia
- 17.1.3 South Africa
- 17.1.4 Rest of Middle East and Africa
- 18. Competitive Analysis
- 18.1. Global Market Share Analysis 2024
- 18.2. Company Profiles
- 18.2.1 Honeywell International Inc
- 18.2.1.1. Overview
- 18.2.1.2. Products
- 18.2.1.3. SWOT Analysis
- 18.2.1.4. Recent Developments
- 18.2.1.5. Financials (Based on Availability)
- 18.2.2 Uvex Group
- 18.2.2.1. Overview
- 18.2.2.2. Products
- 18.2.2.3. SWOT Analysis
- 18.2.2.4. Recent Developments
- 18.2.2.5. Financials (Based on Availability)
- 18.2.3 IML Group PLC (Hazardex)
- 18.2.3.1. Overview
- 18.2.3.2. Products
- 18.2.3.3. SWOT Analysis
- 18.2.3.4. Recent Developments
- 18.2.3.5. Financials (Based on Availability)
- 18.2.4 3M Company
- 18.2.4.1. Overview
- 18.2.4.2. Products
- 18.2.4.3. SWOT Analysis
- 18.2.4.4. Recent Developments
- 18.2.4.5. Financials (Based on Availability)
- 18.2.5 Seebo Interactive LTD
- 18.2.5.1. Overview
- 18.2.5.2. Products
- 18.2.5.3. SWOT Analysis
- 18.2.5.4. Recent Developments
- 18.2.5.5. Financials (Based on Availability)
- 18.2.6 Tenacious Holdings Inc (dba Ergodyne)
- 18.2.6.1. Overview
- 18.2.6.2. Products
- 18.2.6.3. SWOT Analysis
- 18.2.6.4. Recent Developments
- 18.2.6.5. Financials (Based on Availability)
- 18.2.7 Intellinium
- 18.2.7.1. Overview
- 18.2.7.2. Products
- 18.2.7.3. SWOT Analysis
- 18.2.7.4. Recent Developments
- 18.2.7.5. Financials (Based on Availability)
- 18.2.8 Daqri
- 18.2.8.1. Overview
- 18.2.8.2. Products
- 18.2.8.3. SWOT Analysis
- 18.2.8.4. Recent Developments
- 18.2.8.5. Financials (Based on Availability)
- 18.2.9 Vuzix Corp*List Not Exhaustive
- 18.2.9.1. Overview
- 18.2.9.2. Products
- 18.2.9.3. SWOT Analysis
- 18.2.9.4. Recent Developments
- 18.2.9.5. Financials (Based on Availability)
- 18.2.10 Corvex Connected Worker
- 18.2.10.1. Overview
- 18.2.10.2. Products
- 18.2.10.3. SWOT Analysis
- 18.2.10.4. Recent Developments
- 18.2.10.5. Financials (Based on Availability)
- 18.2.1 Honeywell International Inc
List of Figures
- Figure 1: Global Smart Personal Protective Equipment Industry Revenue Breakdown (Million, %) by Region 2024 & 2032
- Figure 2: North America Smart Personal Protective Equipment Industry Revenue (Million), by Country 2024 & 2032
- Figure 3: North America Smart Personal Protective Equipment Industry Revenue Share (%), by Country 2024 & 2032
- Figure 4: Europe Smart Personal Protective Equipment Industry Revenue (Million), by Country 2024 & 2032
- Figure 5: Europe Smart Personal Protective Equipment Industry Revenue Share (%), by Country 2024 & 2032
- Figure 6: Asia Pacific Smart Personal Protective Equipment Industry Revenue (Million), by Country 2024 & 2032
- Figure 7: Asia Pacific Smart Personal Protective Equipment Industry Revenue Share (%), by Country 2024 & 2032
- Figure 8: South America Smart Personal Protective Equipment Industry Revenue (Million), by Country 2024 & 2032
- Figure 9: South America Smart Personal Protective Equipment Industry Revenue Share (%), by Country 2024 & 2032
- Figure 10: North America Smart Personal Protective Equipment Industry Revenue (Million), by Country 2024 & 2032
- Figure 11: North America Smart Personal Protective Equipment Industry Revenue Share (%), by Country 2024 & 2032
- Figure 12: MEA Smart Personal Protective Equipment Industry Revenue (Million), by Country 2024 & 2032
- Figure 13: MEA Smart Personal Protective Equipment Industry Revenue Share (%), by Country 2024 & 2032
- Figure 14: North America Smart Personal Protective Equipment Industry Revenue (Million), by Type 2024 & 2032
- Figure 15: North America Smart Personal Protective Equipment Industry Revenue Share (%), by Type 2024 & 2032
- Figure 16: North America Smart Personal Protective Equipment Industry Revenue (Million), by End-user Industry 2024 & 2032
- Figure 17: North America Smart Personal Protective Equipment Industry Revenue Share (%), by End-user Industry 2024 & 2032
- Figure 18: North America Smart Personal Protective Equipment Industry Revenue (Million), by Country 2024 & 2032
- Figure 19: North America Smart Personal Protective Equipment Industry Revenue Share (%), by Country 2024 & 2032
- Figure 20: Europe Smart Personal Protective Equipment Industry Revenue (Million), by Type 2024 & 2032
- Figure 21: Europe Smart Personal Protective Equipment Industry Revenue Share (%), by Type 2024 & 2032
- Figure 22: Europe Smart Personal Protective Equipment Industry Revenue (Million), by End-user Industry 2024 & 2032
- Figure 23: Europe Smart Personal Protective Equipment Industry Revenue Share (%), by End-user Industry 2024 & 2032
- Figure 24: Europe Smart Personal Protective Equipment Industry Revenue (Million), by Country 2024 & 2032
- Figure 25: Europe Smart Personal Protective Equipment Industry Revenue Share (%), by Country 2024 & 2032
- Figure 26: Asia Smart Personal Protective Equipment Industry Revenue (Million), by Type 2024 & 2032
- Figure 27: Asia Smart Personal Protective Equipment Industry Revenue Share (%), by Type 2024 & 2032
- Figure 28: Asia Smart Personal Protective Equipment Industry Revenue (Million), by End-user Industry 2024 & 2032
- Figure 29: Asia Smart Personal Protective Equipment Industry Revenue Share (%), by End-user Industry 2024 & 2032
- Figure 30: Asia Smart Personal Protective Equipment Industry Revenue (Million), by Country 2024 & 2032
- Figure 31: Asia Smart Personal Protective Equipment Industry Revenue Share (%), by Country 2024 & 2032
- Figure 32: Australia and New Zealand Smart Personal Protective Equipment Industry Revenue (Million), by Type 2024 & 2032
- Figure 33: Australia and New Zealand Smart Personal Protective Equipment Industry Revenue Share (%), by Type 2024 & 2032
- Figure 34: Australia and New Zealand Smart Personal Protective Equipment Industry Revenue (Million), by End-user Industry 2024 & 2032
- Figure 35: Australia and New Zealand Smart Personal Protective Equipment Industry Revenue Share (%), by End-user Industry 2024 & 2032
- Figure 36: Australia and New Zealand Smart Personal Protective Equipment Industry Revenue (Million), by Country 2024 & 2032
- Figure 37: Australia and New Zealand Smart Personal Protective Equipment Industry Revenue Share (%), by Country 2024 & 2032
- Figure 38: Latin America Smart Personal Protective Equipment Industry Revenue (Million), by Type 2024 & 2032
- Figure 39: Latin America Smart Personal Protective Equipment Industry Revenue Share (%), by Type 2024 & 2032
- Figure 40: Latin America Smart Personal Protective Equipment Industry Revenue (Million), by End-user Industry 2024 & 2032
- Figure 41: Latin America Smart Personal Protective Equipment Industry Revenue Share (%), by End-user Industry 2024 & 2032
- Figure 42: Latin America Smart Personal Protective Equipment Industry Revenue (Million), by Country 2024 & 2032
- Figure 43: Latin America Smart Personal Protective Equipment Industry Revenue Share (%), by Country 2024 & 2032
- Figure 44: Middle East and Africa Smart Personal Protective Equipment Industry Revenue (Million), by Type 2024 & 2032
- Figure 45: Middle East and Africa Smart Personal Protective Equipment Industry Revenue Share (%), by Type 2024 & 2032
- Figure 46: Middle East and Africa Smart Personal Protective Equipment Industry Revenue (Million), by End-user Industry 2024 & 2032
- Figure 47: Middle East and Africa Smart Personal Protective Equipment Industry Revenue Share (%), by End-user Industry 2024 & 2032
- Figure 48: Middle East and Africa Smart Personal Protective Equipment Industry Revenue (Million), by Country 2024 & 2032
- Figure 49: Middle East and Africa Smart Personal Protective Equipment Industry Revenue Share (%), by Country 2024 & 2032
List of Tables
- Table 1: Global Smart Personal Protective Equipment Industry Revenue Million Forecast, by Region 2019 & 2032
- Table 2: Global Smart Personal Protective Equipment Industry Revenue Million Forecast, by Type 2019 & 2032
- Table 3: Global Smart Personal Protective Equipment Industry Revenue Million Forecast, by End-user Industry 2019 & 2032
- Table 4: Global Smart Personal Protective Equipment Industry Revenue Million Forecast, by Region 2019 & 2032
- Table 5: Global Smart Personal Protective Equipment Industry Revenue Million Forecast, by Country 2019 & 2032
- Table 6: United States Smart Personal Protective Equipment Industry Revenue (Million) Forecast, by Application 2019 & 2032
- Table 7: Canada Smart Personal Protective Equipment Industry Revenue (Million) Forecast, by Application 2019 & 2032
- Table 8: Mexico Smart Personal Protective Equipment Industry Revenue (Million) Forecast, by Application 2019 & 2032
- Table 9: Global Smart Personal Protective Equipment Industry Revenue Million Forecast, by Country 2019 & 2032
- Table 10: Germany Smart Personal Protective Equipment Industry Revenue (Million) Forecast, by Application 2019 & 2032
- Table 11: United Kingdom Smart Personal Protective Equipment Industry Revenue (Million) Forecast, by Application 2019 & 2032
- Table 12: France Smart Personal Protective Equipment Industry Revenue (Million) Forecast, by Application 2019 & 2032
- Table 13: Spain Smart Personal Protective Equipment Industry Revenue (Million) Forecast, by Application 2019 & 2032
- Table 14: Italy Smart Personal Protective Equipment Industry Revenue (Million) Forecast, by Application 2019 & 2032
- Table 15: Spain Smart Personal Protective Equipment Industry Revenue (Million) Forecast, by Application 2019 & 2032
- Table 16: Belgium Smart Personal Protective Equipment Industry Revenue (Million) Forecast, by Application 2019 & 2032
- Table 17: Netherland Smart Personal Protective Equipment Industry Revenue (Million) Forecast, by Application 2019 & 2032
- Table 18: Nordics Smart Personal Protective Equipment Industry Revenue (Million) Forecast, by Application 2019 & 2032
- Table 19: Rest of Europe Smart Personal Protective Equipment Industry Revenue (Million) Forecast, by Application 2019 & 2032
- Table 20: Global Smart Personal Protective Equipment Industry Revenue Million Forecast, by Country 2019 & 2032
- Table 21: China Smart Personal Protective Equipment Industry Revenue (Million) Forecast, by Application 2019 & 2032
- Table 22: Japan Smart Personal Protective Equipment Industry Revenue (Million) Forecast, by Application 2019 & 2032
- Table 23: India Smart Personal Protective Equipment Industry Revenue (Million) Forecast, by Application 2019 & 2032
- Table 24: South Korea Smart Personal Protective Equipment Industry Revenue (Million) Forecast, by Application 2019 & 2032
- Table 25: Southeast Asia Smart Personal Protective Equipment Industry Revenue (Million) Forecast, by Application 2019 & 2032
- Table 26: Australia Smart Personal Protective Equipment Industry Revenue (Million) Forecast, by Application 2019 & 2032
- Table 27: Indonesia Smart Personal Protective Equipment Industry Revenue (Million) Forecast, by Application 2019 & 2032
- Table 28: Phillipes Smart Personal Protective Equipment Industry Revenue (Million) Forecast, by Application 2019 & 2032
- Table 29: Singapore Smart Personal Protective Equipment Industry Revenue (Million) Forecast, by Application 2019 & 2032
- Table 30: Thailandc Smart Personal Protective Equipment Industry Revenue (Million) Forecast, by Application 2019 & 2032
- Table 31: Rest of Asia Pacific Smart Personal Protective Equipment Industry Revenue (Million) Forecast, by Application 2019 & 2032
- Table 32: Global Smart Personal Protective Equipment Industry Revenue Million Forecast, by Country 2019 & 2032
- Table 33: Brazil Smart Personal Protective Equipment Industry Revenue (Million) Forecast, by Application 2019 & 2032
- Table 34: Argentina Smart Personal Protective Equipment Industry Revenue (Million) Forecast, by Application 2019 & 2032
- Table 35: Peru Smart Personal Protective Equipment Industry Revenue (Million) Forecast, by Application 2019 & 2032
- Table 36: Chile Smart Personal Protective Equipment Industry Revenue (Million) Forecast, by Application 2019 & 2032
- Table 37: Colombia Smart Personal Protective Equipment Industry Revenue (Million) Forecast, by Application 2019 & 2032
- Table 38: Ecuador Smart Personal Protective Equipment Industry Revenue (Million) Forecast, by Application 2019 & 2032
- Table 39: Venezuela Smart Personal Protective Equipment Industry Revenue (Million) Forecast, by Application 2019 & 2032
- Table 40: Rest of South America Smart Personal Protective Equipment Industry Revenue (Million) Forecast, by Application 2019 & 2032
- Table 41: Global Smart Personal Protective Equipment Industry Revenue Million Forecast, by Country 2019 & 2032
- Table 42: United States Smart Personal Protective Equipment Industry Revenue (Million) Forecast, by Application 2019 & 2032
- Table 43: Canada Smart Personal Protective Equipment Industry Revenue (Million) Forecast, by Application 2019 & 2032
- Table 44: Mexico Smart Personal Protective Equipment Industry Revenue (Million) Forecast, by Application 2019 & 2032
- Table 45: Global Smart Personal Protective Equipment Industry Revenue Million Forecast, by Country 2019 & 2032
- Table 46: United Arab Emirates Smart Personal Protective Equipment Industry Revenue (Million) Forecast, by Application 2019 & 2032
- Table 47: Saudi Arabia Smart Personal Protective Equipment Industry Revenue (Million) Forecast, by Application 2019 & 2032
- Table 48: South Africa Smart Personal Protective Equipment Industry Revenue (Million) Forecast, by Application 2019 & 2032
- Table 49: Rest of Middle East and Africa Smart Personal Protective Equipment Industry Revenue (Million) Forecast, by Application 2019 & 2032
- Table 50: Global Smart Personal Protective Equipment Industry Revenue Million Forecast, by Type 2019 & 2032
- Table 51: Global Smart Personal Protective Equipment Industry Revenue Million Forecast, by End-user Industry 2019 & 2032
- Table 52: Global Smart Personal Protective Equipment Industry Revenue Million Forecast, by Country 2019 & 2032
- Table 53: Global Smart Personal Protective Equipment Industry Revenue Million Forecast, by Type 2019 & 2032
- Table 54: Global Smart Personal Protective Equipment Industry Revenue Million Forecast, by End-user Industry 2019 & 2032
- Table 55: Global Smart Personal Protective Equipment Industry Revenue Million Forecast, by Country 2019 & 2032
- Table 56: Global Smart Personal Protective Equipment Industry Revenue Million Forecast, by Type 2019 & 2032
- Table 57: Global Smart Personal Protective Equipment Industry Revenue Million Forecast, by End-user Industry 2019 & 2032
- Table 58: Global Smart Personal Protective Equipment Industry Revenue Million Forecast, by Country 2019 & 2032
- Table 59: Global Smart Personal Protective Equipment Industry Revenue Million Forecast, by Type 2019 & 2032
- Table 60: Global Smart Personal Protective Equipment Industry Revenue Million Forecast, by End-user Industry 2019 & 2032
- Table 61: Global Smart Personal Protective Equipment Industry Revenue Million Forecast, by Country 2019 & 2032
- Table 62: Global Smart Personal Protective Equipment Industry Revenue Million Forecast, by Type 2019 & 2032
- Table 63: Global Smart Personal Protective Equipment Industry Revenue Million Forecast, by End-user Industry 2019 & 2032
- Table 64: Global Smart Personal Protective Equipment Industry Revenue Million Forecast, by Country 2019 & 2032
- Table 65: Global Smart Personal Protective Equipment Industry Revenue Million Forecast, by Type 2019 & 2032
- Table 66: Global Smart Personal Protective Equipment Industry Revenue Million Forecast, by End-user Industry 2019 & 2032
- Table 67: Global Smart Personal Protective Equipment Industry Revenue Million Forecast, by Country 2019 & 2032
Frequently Asked Questions
1. What is the projected Compound Annual Growth Rate (CAGR) of the Smart Personal Protective Equipment Industry?
The projected CAGR is approximately 10.93%.
2. Which companies are prominent players in the Smart Personal Protective Equipment Industry?
Key companies in the market include Honeywell International Inc, Uvex Group, IML Group PLC (Hazardex), 3M Company, Seebo Interactive LTD, Tenacious Holdings Inc (dba Ergodyne), Intellinium, Daqri, Vuzix Corp*List Not Exhaustive, Corvex Connected Worker.
3. What are the main segments of the Smart Personal Protective Equipment Industry?
The market segments include Type, End-user Industry.
4. Can you provide details about the market size?
The market size is estimated to be USD 24.90 Million as of 2022.
5. What are some drivers contributing to market growth?
; Improvement in worker productivity and decrease in worker injury; Increase in the development in IoT and connectivity technologies.
6. What are the notable trends driving market growth?
The usage of Smart PPE in construction to witness a significant growth.
7. Are there any restraints impacting market growth?
; Growing concerns related to security of personal information; Stringent work regulations at operating facilities.
8. Can you provide examples of recent developments in the market?
N/A
9. What pricing options are available for accessing the report?
Pricing options include single-user, multi-user, and enterprise licenses priced at USD 4750, USD 5250, and USD 8750 respectively.
10. Is the market size provided in terms of value or volume?
The market size is provided in terms of value, measured in Million.
11. Are there any specific market keywords associated with the report?
Yes, the market keyword associated with the report is "Smart Personal Protective Equipment Industry," which aids in identifying and referencing the specific market segment covered.
12. How do I determine which pricing option suits my needs best?
The pricing options vary based on user requirements and access needs. Individual users may opt for single-user licenses, while businesses requiring broader access may choose multi-user or enterprise licenses for cost-effective access to the report.
13. Are there any additional resources or data provided in the Smart Personal Protective Equipment Industry report?
While the report offers comprehensive insights, it's advisable to review the specific contents or supplementary materials provided to ascertain if additional resources or data are available.
14. How can I stay updated on further developments or reports in the Smart Personal Protective Equipment Industry?
To stay informed about further developments, trends, and reports in the Smart Personal Protective Equipment Industry, consider subscribing to industry newsletters, following relevant companies and organizations, or regularly checking reputable industry news sources and publications.
Methodology
Step 1 - Identification of Relevant Samples Size from Population Database


Step 2 - Approaches for Defining Global Market Size (Value, Volume* & Price*)

Note*: In applicable scenarios
Step 3 - Data Sources
Primary Research
- Web Analytics
- Survey Reports
- Research Institute
- Latest Research Reports
- Opinion Leaders
Secondary Research
- Annual Reports
- White Paper
- Latest Press Release
- Industry Association
- Paid Database
- Investor Presentations

Step 4 - Data Triangulation
Involves using different sources of information in order to increase the validity of a study
These sources are likely to be stakeholders in a program - participants, other researchers, program staff, other community members, and so on.
Then we put all data in single framework & apply various statistical tools to find out the dynamic on the market.
During the analysis stage, feedback from the stakeholder groups would be compared to determine areas of agreement as well as areas of divergence
