

Key Insights
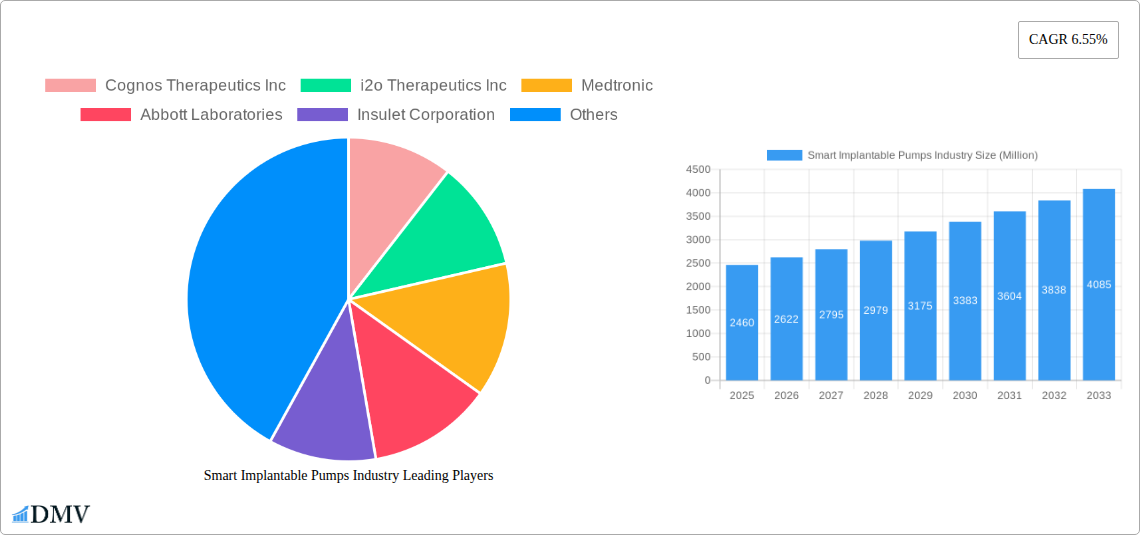
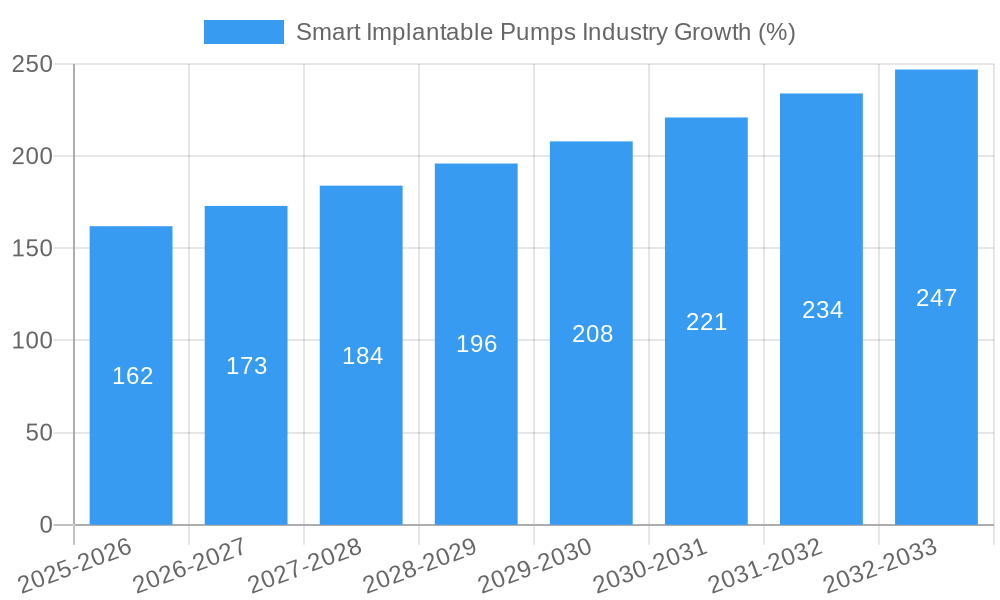
The smart implantable pumps market, valued at $2.46 billion in 2025, is projected to experience robust growth, driven by increasing prevalence of chronic diseases requiring continuous medication delivery, advancements in miniaturization and biocompatibility of implantable devices, and rising demand for minimally invasive procedures. The market's Compound Annual Growth Rate (CAGR) of 6.55% from 2025 to 2033 indicates a significant expansion, with perfusion pumps and micro pumps leading the pump type segment due to their versatility in administering a wide range of therapeutic agents. Key applications include pain management, spasticity treatment, and cardiovascular disease management, with hospitals and ambulatory surgical centers as major end-users. Technological innovations focused on improved battery life, wireless remote monitoring capabilities, and enhanced drug delivery precision are key trends shaping the market landscape. However, factors such as high initial costs, potential complications associated with implantation, and stringent regulatory approvals pose challenges to market growth.
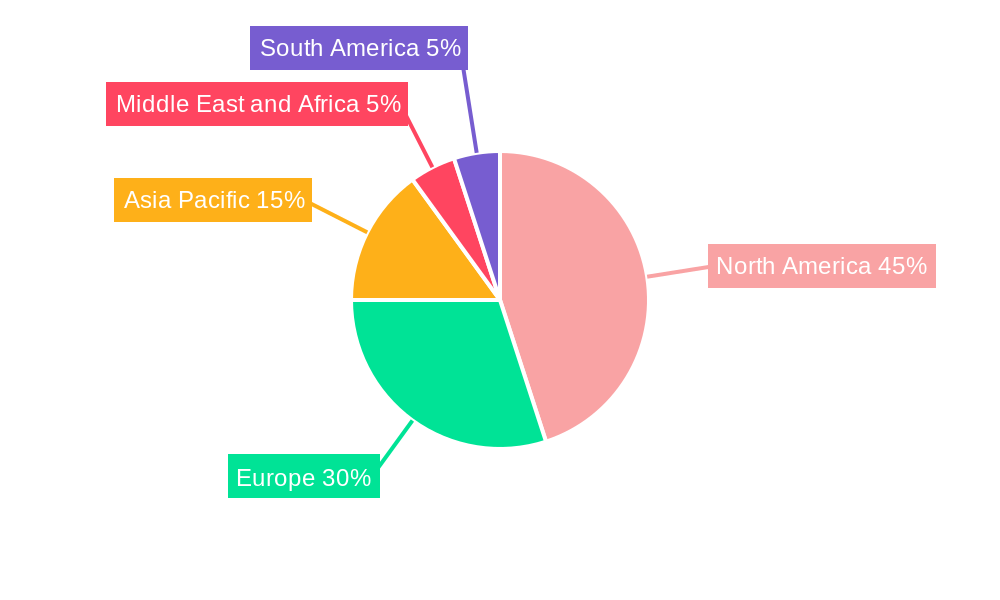
Geographic expansion is another significant aspect, with North America currently dominating the market due to advanced healthcare infrastructure and high adoption rates. However, the Asia-Pacific region is expected to witness the fastest growth, fueled by rising disposable incomes, increasing healthcare expenditure, and expanding awareness of advanced treatment options. Leading companies like Medtronic, Abbott Laboratories, and Insulet Corporation are driving innovation and competition through product development and strategic partnerships, while smaller players like Cognos Therapeutics and i2o Therapeutics are focusing on niche applications and technological advancements. The continued development of sophisticated, safer, and more effective smart implantable pumps will be crucial in expanding market penetration and improving patient outcomes in the coming years.
Smart Implantable Pumps Market Report: 2019-2033
This comprehensive report provides an in-depth analysis of the global smart implantable pumps market, projecting a robust expansion from XX Million in 2025 to XX Million by 2033. The study covers the historical period (2019-2024), base year (2025), and forecast period (2025-2033), offering valuable insights for stakeholders across the industry value chain. Key players like Medtronic, Abbott Laboratories, and Insulet Corporation are analyzed, alongside emerging companies such as Cognos Therapeutics Inc. and i2o Therapeutics Inc., shaping a dynamic and rapidly evolving landscape.
Smart Implantable Pumps Industry Market Composition & Trends
The smart implantable pumps market exhibits a moderately concentrated landscape, with a few major players holding significant market share. However, the emergence of innovative technologies and new entrants is fostering increased competition. Market share distribution is currently estimated as follows: Medtronic (XX%), Abbott Laboratories (XX%), Insulet Corporation (XX%), Others (XX%). Innovation is driven by the need for smaller, more efficient, and safer devices, propelled by advancements in microfluidics, materials science, and wireless communication technologies. Regulatory landscapes vary globally, impacting market access and product approvals. Substitute products, such as external infusion pumps, pose a challenge, but the advantages of implantable pumps—improved patient compliance and convenience—ensure sustained growth. M&A activity is substantial, exemplified by Medtronic’s acquisition of EOFlow Co. Ltd in June 2023 for an estimated value of XX Million, driving consolidation and technological advancements within the sector. The end-user profile consists primarily of hospitals and ambulatory surgical centers, with a growing segment of home healthcare users.
- Market Concentration: Moderately concentrated with major players holding significant share.
- Innovation Catalysts: Advancements in microfluidics, materials science, wireless communication.
- Regulatory Landscape: Varies globally, impacting market access.
- Substitute Products: External infusion pumps.
- End-User Profile: Hospitals, ambulatory surgical centers, and home healthcare.
- M&A Activity: Significant, exemplified by Medtronic’s acquisition of EOFlow (June 2023 for XX Million).
Smart Implantable Pumps Industry Industry Evolution
The smart implantable pumps market is experiencing exponential growth, driven by increasing prevalence of chronic diseases requiring continuous drug delivery, advancements in miniaturization and wireless technology, and rising patient preference for minimally invasive procedures. The market is expected to grow at a CAGR of XX% from 2025 to 2033. Technological advancements such as improved battery life, enhanced safety features, and remote monitoring capabilities are fueling adoption. Furthermore, shifting consumer demands are favoring smaller, more comfortable, and user-friendly devices with increased precision and personalized treatment options. The market is witnessing the integration of smart sensors and artificial intelligence (AI) for improved drug delivery precision and real-time monitoring. The adoption rate of smart implantable pumps is steadily increasing across various therapeutic applications, driven by improved clinical outcomes and improved patient quality of life. The integration of data analytics and remote patient monitoring is transforming healthcare delivery, creating opportunities for personalized medicine and proactive management of chronic diseases. The increasing availability of reimbursement options and favorable regulatory approvals in key markets are also boosting market growth.
Leading Regions, Countries, or Segments in Smart Implantable Pumps Industry
The North American region currently dominates the smart implantable pumps market, driven by high healthcare expenditure, technological advancements, and a strong regulatory framework. Within the product segments, perfusion pumps hold the largest market share, while the cardiovascular application segment is witnessing the fastest growth.
- Dominant Region: North America (driven by high healthcare expenditure, technological advancements, and strong regulatory support).
- Leading Pump Type: Perfusion Pumps (driven by their widespread use in various medical procedures).
- Fastest-Growing Application: Cardiovascular (due to the increasing prevalence of cardiovascular diseases).
- Key End-User: Hospitals (due to their extensive infrastructure and trained medical professionals).
The dominance of North America stems from significant investments in research and development, strong regulatory frameworks facilitating market access, and advanced healthcare infrastructure. The high prevalence of chronic diseases such as diabetes and heart failure in this region fuels demand for these devices. Furthermore, supportive reimbursement policies and increased awareness among both healthcare providers and patients contribute to market growth.
Smart Implantable Pumps Industry Product Innovations
Recent advancements in smart implantable pump technology include the development of smaller, more biocompatible devices with improved battery life and wireless communication capabilities. These innovations enhance patient comfort and allow for remote monitoring, leading to better treatment outcomes and reduced healthcare costs. Unique selling propositions include personalized drug delivery, real-time monitoring, and improved accuracy, allowing for targeted therapies and a reduction in adverse effects. Integration of AI and machine learning algorithms is enhancing treatment efficacy and enabling predictive maintenance.
Propelling Factors for Smart Implantable Pumps Industry Growth
The smart implantable pumps market is fueled by technological advancements leading to smaller, more efficient, and safer devices, combined with increasing prevalence of chronic diseases demanding continuous drug delivery. Favorable regulatory environments in key markets, such as the recent FDA approval of ICU Medical Inc.’s Plum Duo infusion pump, are crucial. Furthermore, rising healthcare expenditure and increasing focus on minimally invasive procedures drive demand.
Obstacles in the Smart Implantable Pumps Industry Market
Challenges include stringent regulatory pathways, high R&D costs associated with developing and testing new devices, and potential supply chain disruptions affecting the availability of components. The relatively high cost of implantable pumps compared to external infusion devices poses a barrier for some patients, influencing market penetration. Intense competition among established and emerging players also pressures margins.
Future Opportunities in Smart Implantable Pumps Industry
Future opportunities lie in the development of more personalized and targeted drug delivery systems. Expansion into emerging markets with growing healthcare infrastructure, integration of advanced materials for improved biocompatibility, and exploration of new therapeutic applications are key areas for growth. The integration of AI and machine learning for predictive diagnostics and proactive intervention further enhances the market potential.
Major Players in the Smart Implantable Pumps Industry Ecosystem
- Medtronic
- Abbott Laboratories
- Insulet Corporation
- Cognos Therapeutics Inc
- i2o Therapeutics Inc
- OrphaCare GmbH
- Tandem Diabetes
- Intera Oncology
Key Developments in Smart Implantable Pumps Industry Industry
- August 2023: US FDA approves ICU Medical Inc.’s Plum Duo infusion pump.
- June 2023: Medtronic acquires EOFlow Co. Ltd, manufacturer of the EOPatch device.
Strategic Smart Implantable Pumps Industry Market Forecast
The smart implantable pumps market is poised for significant growth, driven by technological innovations, increasing prevalence of chronic diseases, and favorable regulatory support. The integration of AI and personalized medicine will further propel market expansion, creating lucrative opportunities for players focusing on innovation and market penetration. The market is expected to witness a robust growth trajectory in the forecast period, driven by the factors outlined above.
Smart Implantable Pumps Industry Segmentation
-
1. Pump Type
- 1.1. Perfusion Pumps
- 1.2. Micro Pumps
-
2. Application
- 2.1. Pain
- 2.2. Spasticity
- 2.3. Cardiovascular
- 2.4. Others
-
3. End User
- 3.1. Hospitals
- 3.2. Ambulatory Surgical Centers
- 3.3. Others
Smart Implantable Pumps Industry Segmentation By Geography
-
1. North America
- 1.1. United States
- 1.2. Canada
- 1.3. Mexico
-
2. Europe
- 2.1. Germany
- 2.2. United Kingdom
- 2.3. France
- 2.4. Italy
- 2.5. Spain
- 2.6. Rest of Europe
-
3. Asia Pacific
- 3.1. China
- 3.2. Japan
- 3.3. India
- 3.4. Australia
- 3.5. South Korea
- 3.6. Rest of Asia Pacific
-
4. Middle East and Africa
- 4.1. GCC
- 4.2. South Africa
- 4.3. Rest of Middle East and Africa
-
5. South America
- 5.1. Brazil
- 5.2. Argentina
- 5.3. Rest of South America
Smart Implantable Pumps Industry REPORT HIGHLIGHTS
| Aspects | Details |
|---|---|
| Study Period | 2019-2033 |
| Base Year | 2024 |
| Estimated Year | 2025 |
| Forecast Period | 2025-2033 |
| Historical Period | 2019-2024 |
| Growth Rate | CAGR of 6.55% from 2019-2033 |
| Segmentation |
|
Table of Contents
- 1. Introduction
- 1.1. Research Scope
- 1.2. Market Segmentation
- 1.3. Research Methodology
- 1.4. Definitions and Assumptions
- 2. Executive Summary
- 2.1. Introduction
- 3. Market Dynamics
- 3.1. Introduction
- 3.2. Market Drivers
- 3.2.1 High Prevalence and Incidence of Chronic Diseases such as Spasticity & Chronic Pain; Growing Geriatric Population; Growing Healthcare Consciousness
- 3.2.2 Rising Healthcare Expenditure and Favorable Reimbursement Policies
- 3.3. Market Restrains
- 3.3.1. Stringent Regulatory Framework and Product Recalls
- 3.4. Market Trends
- 3.4.1. Cardiovascular Segment is Expected to Witness a Significant Growth Over the Forecast Period
- 4. Market Factor Analysis
- 4.1. Porters Five Forces
- 4.2. Supply/Value Chain
- 4.3. PESTEL analysis
- 4.4. Market Entropy
- 4.5. Patent/Trademark Analysis
- 5. Global Smart Implantable Pumps Industry Analysis, Insights and Forecast, 2019-2031
- 5.1. Market Analysis, Insights and Forecast - by Pump Type
- 5.1.1. Perfusion Pumps
- 5.1.2. Micro Pumps
- 5.2. Market Analysis, Insights and Forecast - by Application
- 5.2.1. Pain
- 5.2.2. Spasticity
- 5.2.3. Cardiovascular
- 5.2.4. Others
- 5.3. Market Analysis, Insights and Forecast - by End User
- 5.3.1. Hospitals
- 5.3.2. Ambulatory Surgical Centers
- 5.3.3. Others
- 5.4. Market Analysis, Insights and Forecast - by Region
- 5.4.1. North America
- 5.4.2. Europe
- 5.4.3. Asia Pacific
- 5.4.4. Middle East and Africa
- 5.4.5. South America
- 5.1. Market Analysis, Insights and Forecast - by Pump Type
- 6. North America Smart Implantable Pumps Industry Analysis, Insights and Forecast, 2019-2031
- 6.1. Market Analysis, Insights and Forecast - by Pump Type
- 6.1.1. Perfusion Pumps
- 6.1.2. Micro Pumps
- 6.2. Market Analysis, Insights and Forecast - by Application
- 6.2.1. Pain
- 6.2.2. Spasticity
- 6.2.3. Cardiovascular
- 6.2.4. Others
- 6.3. Market Analysis, Insights and Forecast - by End User
- 6.3.1. Hospitals
- 6.3.2. Ambulatory Surgical Centers
- 6.3.3. Others
- 6.1. Market Analysis, Insights and Forecast - by Pump Type
- 7. Europe Smart Implantable Pumps Industry Analysis, Insights and Forecast, 2019-2031
- 7.1. Market Analysis, Insights and Forecast - by Pump Type
- 7.1.1. Perfusion Pumps
- 7.1.2. Micro Pumps
- 7.2. Market Analysis, Insights and Forecast - by Application
- 7.2.1. Pain
- 7.2.2. Spasticity
- 7.2.3. Cardiovascular
- 7.2.4. Others
- 7.3. Market Analysis, Insights and Forecast - by End User
- 7.3.1. Hospitals
- 7.3.2. Ambulatory Surgical Centers
- 7.3.3. Others
- 7.1. Market Analysis, Insights and Forecast - by Pump Type
- 8. Asia Pacific Smart Implantable Pumps Industry Analysis, Insights and Forecast, 2019-2031
- 8.1. Market Analysis, Insights and Forecast - by Pump Type
- 8.1.1. Perfusion Pumps
- 8.1.2. Micro Pumps
- 8.2. Market Analysis, Insights and Forecast - by Application
- 8.2.1. Pain
- 8.2.2. Spasticity
- 8.2.3. Cardiovascular
- 8.2.4. Others
- 8.3. Market Analysis, Insights and Forecast - by End User
- 8.3.1. Hospitals
- 8.3.2. Ambulatory Surgical Centers
- 8.3.3. Others
- 8.1. Market Analysis, Insights and Forecast - by Pump Type
- 9. Middle East and Africa Smart Implantable Pumps Industry Analysis, Insights and Forecast, 2019-2031
- 9.1. Market Analysis, Insights and Forecast - by Pump Type
- 9.1.1. Perfusion Pumps
- 9.1.2. Micro Pumps
- 9.2. Market Analysis, Insights and Forecast - by Application
- 9.2.1. Pain
- 9.2.2. Spasticity
- 9.2.3. Cardiovascular
- 9.2.4. Others
- 9.3. Market Analysis, Insights and Forecast - by End User
- 9.3.1. Hospitals
- 9.3.2. Ambulatory Surgical Centers
- 9.3.3. Others
- 9.1. Market Analysis, Insights and Forecast - by Pump Type
- 10. South America Smart Implantable Pumps Industry Analysis, Insights and Forecast, 2019-2031
- 10.1. Market Analysis, Insights and Forecast - by Pump Type
- 10.1.1. Perfusion Pumps
- 10.1.2. Micro Pumps
- 10.2. Market Analysis, Insights and Forecast - by Application
- 10.2.1. Pain
- 10.2.2. Spasticity
- 10.2.3. Cardiovascular
- 10.2.4. Others
- 10.3. Market Analysis, Insights and Forecast - by End User
- 10.3.1. Hospitals
- 10.3.2. Ambulatory Surgical Centers
- 10.3.3. Others
- 10.1. Market Analysis, Insights and Forecast - by Pump Type
- 11. North America Smart Implantable Pumps Industry Analysis, Insights and Forecast, 2019-2031
- 11.1. Market Analysis, Insights and Forecast - By Country/Sub-region
- 11.1.1. undefined
- 12. Europe Smart Implantable Pumps Industry Analysis, Insights and Forecast, 2019-2031
- 12.1. Market Analysis, Insights and Forecast - By Country/Sub-region
- 12.1.1. undefined
- 13. Asia Pacific Smart Implantable Pumps Industry Analysis, Insights and Forecast, 2019-2031
- 13.1. Market Analysis, Insights and Forecast - By Country/Sub-region
- 13.1.1. undefined
- 14. Middle East and Africa Smart Implantable Pumps Industry Analysis, Insights and Forecast, 2019-2031
- 14.1. Market Analysis, Insights and Forecast - By Country/Sub-region
- 14.1.1. undefined
- 15. South America Smart Implantable Pumps Industry Analysis, Insights and Forecast, 2019-2031
- 15.1. Market Analysis, Insights and Forecast - By Country/Sub-region
- 15.1.1. undefined
- 16. Competitive Analysis
- 16.1. Global Market Share Analysis 2024
- 16.2. Company Profiles
- 16.2.1 Cognos Therapeutics Inc
- 16.2.1.1. Overview
- 16.2.1.2. Products
- 16.2.1.3. SWOT Analysis
- 16.2.1.4. Recent Developments
- 16.2.1.5. Financials (Based on Availability)
- 16.2.2 i2o Therapeutics Inc
- 16.2.2.1. Overview
- 16.2.2.2. Products
- 16.2.2.3. SWOT Analysis
- 16.2.2.4. Recent Developments
- 16.2.2.5. Financials (Based on Availability)
- 16.2.3 Medtronic
- 16.2.3.1. Overview
- 16.2.3.2. Products
- 16.2.3.3. SWOT Analysis
- 16.2.3.4. Recent Developments
- 16.2.3.5. Financials (Based on Availability)
- 16.2.4 Abbott Laboratories
- 16.2.4.1. Overview
- 16.2.4.2. Products
- 16.2.4.3. SWOT Analysis
- 16.2.4.4. Recent Developments
- 16.2.4.5. Financials (Based on Availability)
- 16.2.5 Insulet Corporation
- 16.2.5.1. Overview
- 16.2.5.2. Products
- 16.2.5.3. SWOT Analysis
- 16.2.5.4. Recent Developments
- 16.2.5.5. Financials (Based on Availability)
- 16.2.6 OrphaCare GmbH
- 16.2.6.1. Overview
- 16.2.6.2. Products
- 16.2.6.3. SWOT Analysis
- 16.2.6.4. Recent Developments
- 16.2.6.5. Financials (Based on Availability)
- 16.2.7 Tandem Diabetes
- 16.2.7.1. Overview
- 16.2.7.2. Products
- 16.2.7.3. SWOT Analysis
- 16.2.7.4. Recent Developments
- 16.2.7.5. Financials (Based on Availability)
- 16.2.8 Intera Oncology
- 16.2.8.1. Overview
- 16.2.8.2. Products
- 16.2.8.3. SWOT Analysis
- 16.2.8.4. Recent Developments
- 16.2.8.5. Financials (Based on Availability)
- 16.2.1 Cognos Therapeutics Inc
List of Figures
- Figure 1: Global Smart Implantable Pumps Industry Revenue Breakdown (Million, %) by Region 2024 & 2032
- Figure 2: Global Smart Implantable Pumps Industry Volume Breakdown (K Units, %) by Region 2024 & 2032
- Figure 3: North America Smart Implantable Pumps Industry Revenue (Million), by Country 2024 & 2032
- Figure 4: North America Smart Implantable Pumps Industry Volume (K Units), by Country 2024 & 2032
- Figure 5: North America Smart Implantable Pumps Industry Revenue Share (%), by Country 2024 & 2032
- Figure 6: North America Smart Implantable Pumps Industry Volume Share (%), by Country 2024 & 2032
- Figure 7: Europe Smart Implantable Pumps Industry Revenue (Million), by Country 2024 & 2032
- Figure 8: Europe Smart Implantable Pumps Industry Volume (K Units), by Country 2024 & 2032
- Figure 9: Europe Smart Implantable Pumps Industry Revenue Share (%), by Country 2024 & 2032
- Figure 10: Europe Smart Implantable Pumps Industry Volume Share (%), by Country 2024 & 2032
- Figure 11: Asia Pacific Smart Implantable Pumps Industry Revenue (Million), by Country 2024 & 2032
- Figure 12: Asia Pacific Smart Implantable Pumps Industry Volume (K Units), by Country 2024 & 2032
- Figure 13: Asia Pacific Smart Implantable Pumps Industry Revenue Share (%), by Country 2024 & 2032
- Figure 14: Asia Pacific Smart Implantable Pumps Industry Volume Share (%), by Country 2024 & 2032
- Figure 15: Middle East and Africa Smart Implantable Pumps Industry Revenue (Million), by Country 2024 & 2032
- Figure 16: Middle East and Africa Smart Implantable Pumps Industry Volume (K Units), by Country 2024 & 2032
- Figure 17: Middle East and Africa Smart Implantable Pumps Industry Revenue Share (%), by Country 2024 & 2032
- Figure 18: Middle East and Africa Smart Implantable Pumps Industry Volume Share (%), by Country 2024 & 2032
- Figure 19: South America Smart Implantable Pumps Industry Revenue (Million), by Country 2024 & 2032
- Figure 20: South America Smart Implantable Pumps Industry Volume (K Units), by Country 2024 & 2032
- Figure 21: South America Smart Implantable Pumps Industry Revenue Share (%), by Country 2024 & 2032
- Figure 22: South America Smart Implantable Pumps Industry Volume Share (%), by Country 2024 & 2032
- Figure 23: North America Smart Implantable Pumps Industry Revenue (Million), by Pump Type 2024 & 2032
- Figure 24: North America Smart Implantable Pumps Industry Volume (K Units), by Pump Type 2024 & 2032
- Figure 25: North America Smart Implantable Pumps Industry Revenue Share (%), by Pump Type 2024 & 2032
- Figure 26: North America Smart Implantable Pumps Industry Volume Share (%), by Pump Type 2024 & 2032
- Figure 27: North America Smart Implantable Pumps Industry Revenue (Million), by Application 2024 & 2032
- Figure 28: North America Smart Implantable Pumps Industry Volume (K Units), by Application 2024 & 2032
- Figure 29: North America Smart Implantable Pumps Industry Revenue Share (%), by Application 2024 & 2032
- Figure 30: North America Smart Implantable Pumps Industry Volume Share (%), by Application 2024 & 2032
- Figure 31: North America Smart Implantable Pumps Industry Revenue (Million), by End User 2024 & 2032
- Figure 32: North America Smart Implantable Pumps Industry Volume (K Units), by End User 2024 & 2032
- Figure 33: North America Smart Implantable Pumps Industry Revenue Share (%), by End User 2024 & 2032
- Figure 34: North America Smart Implantable Pumps Industry Volume Share (%), by End User 2024 & 2032
- Figure 35: North America Smart Implantable Pumps Industry Revenue (Million), by Country 2024 & 2032
- Figure 36: North America Smart Implantable Pumps Industry Volume (K Units), by Country 2024 & 2032
- Figure 37: North America Smart Implantable Pumps Industry Revenue Share (%), by Country 2024 & 2032
- Figure 38: North America Smart Implantable Pumps Industry Volume Share (%), by Country 2024 & 2032
- Figure 39: Europe Smart Implantable Pumps Industry Revenue (Million), by Pump Type 2024 & 2032
- Figure 40: Europe Smart Implantable Pumps Industry Volume (K Units), by Pump Type 2024 & 2032
- Figure 41: Europe Smart Implantable Pumps Industry Revenue Share (%), by Pump Type 2024 & 2032
- Figure 42: Europe Smart Implantable Pumps Industry Volume Share (%), by Pump Type 2024 & 2032
- Figure 43: Europe Smart Implantable Pumps Industry Revenue (Million), by Application 2024 & 2032
- Figure 44: Europe Smart Implantable Pumps Industry Volume (K Units), by Application 2024 & 2032
- Figure 45: Europe Smart Implantable Pumps Industry Revenue Share (%), by Application 2024 & 2032
- Figure 46: Europe Smart Implantable Pumps Industry Volume Share (%), by Application 2024 & 2032
- Figure 47: Europe Smart Implantable Pumps Industry Revenue (Million), by End User 2024 & 2032
- Figure 48: Europe Smart Implantable Pumps Industry Volume (K Units), by End User 2024 & 2032
- Figure 49: Europe Smart Implantable Pumps Industry Revenue Share (%), by End User 2024 & 2032
- Figure 50: Europe Smart Implantable Pumps Industry Volume Share (%), by End User 2024 & 2032
- Figure 51: Europe Smart Implantable Pumps Industry Revenue (Million), by Country 2024 & 2032
- Figure 52: Europe Smart Implantable Pumps Industry Volume (K Units), by Country 2024 & 2032
- Figure 53: Europe Smart Implantable Pumps Industry Revenue Share (%), by Country 2024 & 2032
- Figure 54: Europe Smart Implantable Pumps Industry Volume Share (%), by Country 2024 & 2032
- Figure 55: Asia Pacific Smart Implantable Pumps Industry Revenue (Million), by Pump Type 2024 & 2032
- Figure 56: Asia Pacific Smart Implantable Pumps Industry Volume (K Units), by Pump Type 2024 & 2032
- Figure 57: Asia Pacific Smart Implantable Pumps Industry Revenue Share (%), by Pump Type 2024 & 2032
- Figure 58: Asia Pacific Smart Implantable Pumps Industry Volume Share (%), by Pump Type 2024 & 2032
- Figure 59: Asia Pacific Smart Implantable Pumps Industry Revenue (Million), by Application 2024 & 2032
- Figure 60: Asia Pacific Smart Implantable Pumps Industry Volume (K Units), by Application 2024 & 2032
- Figure 61: Asia Pacific Smart Implantable Pumps Industry Revenue Share (%), by Application 2024 & 2032
- Figure 62: Asia Pacific Smart Implantable Pumps Industry Volume Share (%), by Application 2024 & 2032
- Figure 63: Asia Pacific Smart Implantable Pumps Industry Revenue (Million), by End User 2024 & 2032
- Figure 64: Asia Pacific Smart Implantable Pumps Industry Volume (K Units), by End User 2024 & 2032
- Figure 65: Asia Pacific Smart Implantable Pumps Industry Revenue Share (%), by End User 2024 & 2032
- Figure 66: Asia Pacific Smart Implantable Pumps Industry Volume Share (%), by End User 2024 & 2032
- Figure 67: Asia Pacific Smart Implantable Pumps Industry Revenue (Million), by Country 2024 & 2032
- Figure 68: Asia Pacific Smart Implantable Pumps Industry Volume (K Units), by Country 2024 & 2032
- Figure 69: Asia Pacific Smart Implantable Pumps Industry Revenue Share (%), by Country 2024 & 2032
- Figure 70: Asia Pacific Smart Implantable Pumps Industry Volume Share (%), by Country 2024 & 2032
- Figure 71: Middle East and Africa Smart Implantable Pumps Industry Revenue (Million), by Pump Type 2024 & 2032
- Figure 72: Middle East and Africa Smart Implantable Pumps Industry Volume (K Units), by Pump Type 2024 & 2032
- Figure 73: Middle East and Africa Smart Implantable Pumps Industry Revenue Share (%), by Pump Type 2024 & 2032
- Figure 74: Middle East and Africa Smart Implantable Pumps Industry Volume Share (%), by Pump Type 2024 & 2032
- Figure 75: Middle East and Africa Smart Implantable Pumps Industry Revenue (Million), by Application 2024 & 2032
- Figure 76: Middle East and Africa Smart Implantable Pumps Industry Volume (K Units), by Application 2024 & 2032
- Figure 77: Middle East and Africa Smart Implantable Pumps Industry Revenue Share (%), by Application 2024 & 2032
- Figure 78: Middle East and Africa Smart Implantable Pumps Industry Volume Share (%), by Application 2024 & 2032
- Figure 79: Middle East and Africa Smart Implantable Pumps Industry Revenue (Million), by End User 2024 & 2032
- Figure 80: Middle East and Africa Smart Implantable Pumps Industry Volume (K Units), by End User 2024 & 2032
- Figure 81: Middle East and Africa Smart Implantable Pumps Industry Revenue Share (%), by End User 2024 & 2032
- Figure 82: Middle East and Africa Smart Implantable Pumps Industry Volume Share (%), by End User 2024 & 2032
- Figure 83: Middle East and Africa Smart Implantable Pumps Industry Revenue (Million), by Country 2024 & 2032
- Figure 84: Middle East and Africa Smart Implantable Pumps Industry Volume (K Units), by Country 2024 & 2032
- Figure 85: Middle East and Africa Smart Implantable Pumps Industry Revenue Share (%), by Country 2024 & 2032
- Figure 86: Middle East and Africa Smart Implantable Pumps Industry Volume Share (%), by Country 2024 & 2032
- Figure 87: South America Smart Implantable Pumps Industry Revenue (Million), by Pump Type 2024 & 2032
- Figure 88: South America Smart Implantable Pumps Industry Volume (K Units), by Pump Type 2024 & 2032
- Figure 89: South America Smart Implantable Pumps Industry Revenue Share (%), by Pump Type 2024 & 2032
- Figure 90: South America Smart Implantable Pumps Industry Volume Share (%), by Pump Type 2024 & 2032
- Figure 91: South America Smart Implantable Pumps Industry Revenue (Million), by Application 2024 & 2032
- Figure 92: South America Smart Implantable Pumps Industry Volume (K Units), by Application 2024 & 2032
- Figure 93: South America Smart Implantable Pumps Industry Revenue Share (%), by Application 2024 & 2032
- Figure 94: South America Smart Implantable Pumps Industry Volume Share (%), by Application 2024 & 2032
- Figure 95: South America Smart Implantable Pumps Industry Revenue (Million), by End User 2024 & 2032
- Figure 96: South America Smart Implantable Pumps Industry Volume (K Units), by End User 2024 & 2032
- Figure 97: South America Smart Implantable Pumps Industry Revenue Share (%), by End User 2024 & 2032
- Figure 98: South America Smart Implantable Pumps Industry Volume Share (%), by End User 2024 & 2032
- Figure 99: South America Smart Implantable Pumps Industry Revenue (Million), by Country 2024 & 2032
- Figure 100: South America Smart Implantable Pumps Industry Volume (K Units), by Country 2024 & 2032
- Figure 101: South America Smart Implantable Pumps Industry Revenue Share (%), by Country 2024 & 2032
- Figure 102: South America Smart Implantable Pumps Industry Volume Share (%), by Country 2024 & 2032
List of Tables
- Table 1: Global Smart Implantable Pumps Industry Revenue Million Forecast, by Region 2019 & 2032
- Table 2: Global Smart Implantable Pumps Industry Volume K Units Forecast, by Region 2019 & 2032
- Table 3: Global Smart Implantable Pumps Industry Revenue Million Forecast, by Pump Type 2019 & 2032
- Table 4: Global Smart Implantable Pumps Industry Volume K Units Forecast, by Pump Type 2019 & 2032
- Table 5: Global Smart Implantable Pumps Industry Revenue Million Forecast, by Application 2019 & 2032
- Table 6: Global Smart Implantable Pumps Industry Volume K Units Forecast, by Application 2019 & 2032
- Table 7: Global Smart Implantable Pumps Industry Revenue Million Forecast, by End User 2019 & 2032
- Table 8: Global Smart Implantable Pumps Industry Volume K Units Forecast, by End User 2019 & 2032
- Table 9: Global Smart Implantable Pumps Industry Revenue Million Forecast, by Region 2019 & 2032
- Table 10: Global Smart Implantable Pumps Industry Volume K Units Forecast, by Region 2019 & 2032
- Table 11: Global Smart Implantable Pumps Industry Revenue Million Forecast, by Country 2019 & 2032
- Table 12: Global Smart Implantable Pumps Industry Volume K Units Forecast, by Country 2019 & 2032
- Table 13: Global Smart Implantable Pumps Industry Revenue Million Forecast, by Country 2019 & 2032
- Table 14: Global Smart Implantable Pumps Industry Volume K Units Forecast, by Country 2019 & 2032
- Table 15: Global Smart Implantable Pumps Industry Revenue Million Forecast, by Country 2019 & 2032
- Table 16: Global Smart Implantable Pumps Industry Volume K Units Forecast, by Country 2019 & 2032
- Table 17: Global Smart Implantable Pumps Industry Revenue Million Forecast, by Country 2019 & 2032
- Table 18: Global Smart Implantable Pumps Industry Volume K Units Forecast, by Country 2019 & 2032
- Table 19: Global Smart Implantable Pumps Industry Revenue Million Forecast, by Country 2019 & 2032
- Table 20: Global Smart Implantable Pumps Industry Volume K Units Forecast, by Country 2019 & 2032
- Table 21: Global Smart Implantable Pumps Industry Revenue Million Forecast, by Pump Type 2019 & 2032
- Table 22: Global Smart Implantable Pumps Industry Volume K Units Forecast, by Pump Type 2019 & 2032
- Table 23: Global Smart Implantable Pumps Industry Revenue Million Forecast, by Application 2019 & 2032
- Table 24: Global Smart Implantable Pumps Industry Volume K Units Forecast, by Application 2019 & 2032
- Table 25: Global Smart Implantable Pumps Industry Revenue Million Forecast, by End User 2019 & 2032
- Table 26: Global Smart Implantable Pumps Industry Volume K Units Forecast, by End User 2019 & 2032
- Table 27: Global Smart Implantable Pumps Industry Revenue Million Forecast, by Country 2019 & 2032
- Table 28: Global Smart Implantable Pumps Industry Volume K Units Forecast, by Country 2019 & 2032
- Table 29: United States Smart Implantable Pumps Industry Revenue (Million) Forecast, by Application 2019 & 2032
- Table 30: United States Smart Implantable Pumps Industry Volume (K Units) Forecast, by Application 2019 & 2032
- Table 31: Canada Smart Implantable Pumps Industry Revenue (Million) Forecast, by Application 2019 & 2032
- Table 32: Canada Smart Implantable Pumps Industry Volume (K Units) Forecast, by Application 2019 & 2032
- Table 33: Mexico Smart Implantable Pumps Industry Revenue (Million) Forecast, by Application 2019 & 2032
- Table 34: Mexico Smart Implantable Pumps Industry Volume (K Units) Forecast, by Application 2019 & 2032
- Table 35: Global Smart Implantable Pumps Industry Revenue Million Forecast, by Pump Type 2019 & 2032
- Table 36: Global Smart Implantable Pumps Industry Volume K Units Forecast, by Pump Type 2019 & 2032
- Table 37: Global Smart Implantable Pumps Industry Revenue Million Forecast, by Application 2019 & 2032
- Table 38: Global Smart Implantable Pumps Industry Volume K Units Forecast, by Application 2019 & 2032
- Table 39: Global Smart Implantable Pumps Industry Revenue Million Forecast, by End User 2019 & 2032
- Table 40: Global Smart Implantable Pumps Industry Volume K Units Forecast, by End User 2019 & 2032
- Table 41: Global Smart Implantable Pumps Industry Revenue Million Forecast, by Country 2019 & 2032
- Table 42: Global Smart Implantable Pumps Industry Volume K Units Forecast, by Country 2019 & 2032
- Table 43: Germany Smart Implantable Pumps Industry Revenue (Million) Forecast, by Application 2019 & 2032
- Table 44: Germany Smart Implantable Pumps Industry Volume (K Units) Forecast, by Application 2019 & 2032
- Table 45: United Kingdom Smart Implantable Pumps Industry Revenue (Million) Forecast, by Application 2019 & 2032
- Table 46: United Kingdom Smart Implantable Pumps Industry Volume (K Units) Forecast, by Application 2019 & 2032
- Table 47: France Smart Implantable Pumps Industry Revenue (Million) Forecast, by Application 2019 & 2032
- Table 48: France Smart Implantable Pumps Industry Volume (K Units) Forecast, by Application 2019 & 2032
- Table 49: Italy Smart Implantable Pumps Industry Revenue (Million) Forecast, by Application 2019 & 2032
- Table 50: Italy Smart Implantable Pumps Industry Volume (K Units) Forecast, by Application 2019 & 2032
- Table 51: Spain Smart Implantable Pumps Industry Revenue (Million) Forecast, by Application 2019 & 2032
- Table 52: Spain Smart Implantable Pumps Industry Volume (K Units) Forecast, by Application 2019 & 2032
- Table 53: Rest of Europe Smart Implantable Pumps Industry Revenue (Million) Forecast, by Application 2019 & 2032
- Table 54: Rest of Europe Smart Implantable Pumps Industry Volume (K Units) Forecast, by Application 2019 & 2032
- Table 55: Global Smart Implantable Pumps Industry Revenue Million Forecast, by Pump Type 2019 & 2032
- Table 56: Global Smart Implantable Pumps Industry Volume K Units Forecast, by Pump Type 2019 & 2032
- Table 57: Global Smart Implantable Pumps Industry Revenue Million Forecast, by Application 2019 & 2032
- Table 58: Global Smart Implantable Pumps Industry Volume K Units Forecast, by Application 2019 & 2032
- Table 59: Global Smart Implantable Pumps Industry Revenue Million Forecast, by End User 2019 & 2032
- Table 60: Global Smart Implantable Pumps Industry Volume K Units Forecast, by End User 2019 & 2032
- Table 61: Global Smart Implantable Pumps Industry Revenue Million Forecast, by Country 2019 & 2032
- Table 62: Global Smart Implantable Pumps Industry Volume K Units Forecast, by Country 2019 & 2032
- Table 63: China Smart Implantable Pumps Industry Revenue (Million) Forecast, by Application 2019 & 2032
- Table 64: China Smart Implantable Pumps Industry Volume (K Units) Forecast, by Application 2019 & 2032
- Table 65: Japan Smart Implantable Pumps Industry Revenue (Million) Forecast, by Application 2019 & 2032
- Table 66: Japan Smart Implantable Pumps Industry Volume (K Units) Forecast, by Application 2019 & 2032
- Table 67: India Smart Implantable Pumps Industry Revenue (Million) Forecast, by Application 2019 & 2032
- Table 68: India Smart Implantable Pumps Industry Volume (K Units) Forecast, by Application 2019 & 2032
- Table 69: Australia Smart Implantable Pumps Industry Revenue (Million) Forecast, by Application 2019 & 2032
- Table 70: Australia Smart Implantable Pumps Industry Volume (K Units) Forecast, by Application 2019 & 2032
- Table 71: South Korea Smart Implantable Pumps Industry Revenue (Million) Forecast, by Application 2019 & 2032
- Table 72: South Korea Smart Implantable Pumps Industry Volume (K Units) Forecast, by Application 2019 & 2032
- Table 73: Rest of Asia Pacific Smart Implantable Pumps Industry Revenue (Million) Forecast, by Application 2019 & 2032
- Table 74: Rest of Asia Pacific Smart Implantable Pumps Industry Volume (K Units) Forecast, by Application 2019 & 2032
- Table 75: Global Smart Implantable Pumps Industry Revenue Million Forecast, by Pump Type 2019 & 2032
- Table 76: Global Smart Implantable Pumps Industry Volume K Units Forecast, by Pump Type 2019 & 2032
- Table 77: Global Smart Implantable Pumps Industry Revenue Million Forecast, by Application 2019 & 2032
- Table 78: Global Smart Implantable Pumps Industry Volume K Units Forecast, by Application 2019 & 2032
- Table 79: Global Smart Implantable Pumps Industry Revenue Million Forecast, by End User 2019 & 2032
- Table 80: Global Smart Implantable Pumps Industry Volume K Units Forecast, by End User 2019 & 2032
- Table 81: Global Smart Implantable Pumps Industry Revenue Million Forecast, by Country 2019 & 2032
- Table 82: Global Smart Implantable Pumps Industry Volume K Units Forecast, by Country 2019 & 2032
- Table 83: GCC Smart Implantable Pumps Industry Revenue (Million) Forecast, by Application 2019 & 2032
- Table 84: GCC Smart Implantable Pumps Industry Volume (K Units) Forecast, by Application 2019 & 2032
- Table 85: South Africa Smart Implantable Pumps Industry Revenue (Million) Forecast, by Application 2019 & 2032
- Table 86: South Africa Smart Implantable Pumps Industry Volume (K Units) Forecast, by Application 2019 & 2032
- Table 87: Rest of Middle East and Africa Smart Implantable Pumps Industry Revenue (Million) Forecast, by Application 2019 & 2032
- Table 88: Rest of Middle East and Africa Smart Implantable Pumps Industry Volume (K Units) Forecast, by Application 2019 & 2032
- Table 89: Global Smart Implantable Pumps Industry Revenue Million Forecast, by Pump Type 2019 & 2032
- Table 90: Global Smart Implantable Pumps Industry Volume K Units Forecast, by Pump Type 2019 & 2032
- Table 91: Global Smart Implantable Pumps Industry Revenue Million Forecast, by Application 2019 & 2032
- Table 92: Global Smart Implantable Pumps Industry Volume K Units Forecast, by Application 2019 & 2032
- Table 93: Global Smart Implantable Pumps Industry Revenue Million Forecast, by End User 2019 & 2032
- Table 94: Global Smart Implantable Pumps Industry Volume K Units Forecast, by End User 2019 & 2032
- Table 95: Global Smart Implantable Pumps Industry Revenue Million Forecast, by Country 2019 & 2032
- Table 96: Global Smart Implantable Pumps Industry Volume K Units Forecast, by Country 2019 & 2032
- Table 97: Brazil Smart Implantable Pumps Industry Revenue (Million) Forecast, by Application 2019 & 2032
- Table 98: Brazil Smart Implantable Pumps Industry Volume (K Units) Forecast, by Application 2019 & 2032
- Table 99: Argentina Smart Implantable Pumps Industry Revenue (Million) Forecast, by Application 2019 & 2032
- Table 100: Argentina Smart Implantable Pumps Industry Volume (K Units) Forecast, by Application 2019 & 2032
- Table 101: Rest of South America Smart Implantable Pumps Industry Revenue (Million) Forecast, by Application 2019 & 2032
- Table 102: Rest of South America Smart Implantable Pumps Industry Volume (K Units) Forecast, by Application 2019 & 2032
Frequently Asked Questions
1. What is the projected Compound Annual Growth Rate (CAGR) of the Smart Implantable Pumps Industry?
The projected CAGR is approximately 6.55%.
2. Which companies are prominent players in the Smart Implantable Pumps Industry?
Key companies in the market include Cognos Therapeutics Inc, i2o Therapeutics Inc, Medtronic, Abbott Laboratories, Insulet Corporation, OrphaCare GmbH, Tandem Diabetes, Intera Oncology.
3. What are the main segments of the Smart Implantable Pumps Industry?
The market segments include Pump Type, Application, End User.
4. Can you provide details about the market size?
The market size is estimated to be USD 2.46 Million as of 2022.
5. What are some drivers contributing to market growth?
High Prevalence and Incidence of Chronic Diseases such as Spasticity & Chronic Pain; Growing Geriatric Population; Growing Healthcare Consciousness. Rising Healthcare Expenditure and Favorable Reimbursement Policies.
6. What are the notable trends driving market growth?
Cardiovascular Segment is Expected to Witness a Significant Growth Over the Forecast Period.
7. Are there any restraints impacting market growth?
Stringent Regulatory Framework and Product Recalls.
8. Can you provide examples of recent developments in the market?
In August 2023, the US FDA approved ICU Medical Inc.’s Plum Duo infusion pump with LifeShield infusion safety software for commercial use.
9. What pricing options are available for accessing the report?
Pricing options include single-user, multi-user, and enterprise licenses priced at USD 4750, USD 5250, and USD 8750 respectively.
10. Is the market size provided in terms of value or volume?
The market size is provided in terms of value, measured in Million and volume, measured in K Units.
11. Are there any specific market keywords associated with the report?
Yes, the market keyword associated with the report is "Smart Implantable Pumps Industry," which aids in identifying and referencing the specific market segment covered.
12. How do I determine which pricing option suits my needs best?
The pricing options vary based on user requirements and access needs. Individual users may opt for single-user licenses, while businesses requiring broader access may choose multi-user or enterprise licenses for cost-effective access to the report.
13. Are there any additional resources or data provided in the Smart Implantable Pumps Industry report?
While the report offers comprehensive insights, it's advisable to review the specific contents or supplementary materials provided to ascertain if additional resources or data are available.
14. How can I stay updated on further developments or reports in the Smart Implantable Pumps Industry?
To stay informed about further developments, trends, and reports in the Smart Implantable Pumps Industry, consider subscribing to industry newsletters, following relevant companies and organizations, or regularly checking reputable industry news sources and publications.
Methodology
Step 1 - Identification of Relevant Samples Size from Population Database


Step 2 - Approaches for Defining Global Market Size (Value, Volume* & Price*)

Note*: In applicable scenarios
Step 3 - Data Sources
Primary Research
- Web Analytics
- Survey Reports
- Research Institute
- Latest Research Reports
- Opinion Leaders
Secondary Research
- Annual Reports
- White Paper
- Latest Press Release
- Industry Association
- Paid Database
- Investor Presentations

Step 4 - Data Triangulation
Involves using different sources of information in order to increase the validity of a study
These sources are likely to be stakeholders in a program - participants, other researchers, program staff, other community members, and so on.
Then we put all data in single framework & apply various statistical tools to find out the dynamic on the market.
During the analysis stage, feedback from the stakeholder groups would be compared to determine areas of agreement as well as areas of divergence
