

Key Insights
The smart gas meter market is experiencing robust growth, driven by increasing urbanization, rising energy demands, and a global push towards efficient resource management. A compound annual growth rate (CAGR) of 5.80% from 2019 to 2024 suggests a significant expansion, and this momentum is projected to continue through 2033. Key drivers include the need for improved gas leak detection, reducing gas theft, and enhancing grid optimization. The integration of advanced metering infrastructure (AMI) and automatic meter reading (AMR) technologies are transforming the industry, enabling real-time data monitoring and automated billing processes. Further advancements in data analytics provide utilities with valuable insights for predictive maintenance and network planning, optimizing operational efficiency and minimizing losses. The market is segmented across diverse devices (AMR/AMI meters, communication modules), solutions (SCADA, GIS, EAM, MDM), and services (system integration, program management). Significant regional variations exist, with North America and Europe currently holding substantial market share due to early adoption and advanced infrastructure. However, Asia-Pacific is anticipated to witness rapid growth in the coming years, fueled by increasing investments in smart grid technologies and expanding gas infrastructure. Competition is intense, with established players like Itron, ABB, and Schneider Electric vying for market dominance alongside emerging technology providers.
The diverse end-user segments—residential, commercial, and industrial—present distinct market opportunities. Residential adoption is driven by consumer demand for improved energy efficiency and cost savings, while commercial and industrial users focus on optimizing consumption, reducing operational costs, and improving safety. The market faces certain restraints, including high initial investment costs for infrastructure upgrades and the need for skilled personnel for implementation and maintenance. Nevertheless, government initiatives promoting energy efficiency and smart grid development are likely to offset these challenges and contribute to sustained market expansion. The ongoing development of innovative technologies, such as AI-powered leak detection systems and advanced data analytics platforms, will further propel the market's growth trajectory throughout the forecast period. This signifies a promising investment landscape for companies operating within the smart gas meter ecosystem.
Smart Gas Meter Industry Market Report: 2019-2033
This comprehensive report provides a detailed analysis of the Smart Gas Meter industry, offering invaluable insights for stakeholders seeking to navigate this dynamic market. With a study period spanning 2019-2033, a base year of 2025, and a forecast period of 2025-2033, this report leverages extensive data analysis to project a market valued at xx Million by 2033. The report covers key segments, leading players, and emerging trends, offering a holistic understanding of the industry landscape.
Smart Gas Meter Industry Market Composition & Trends
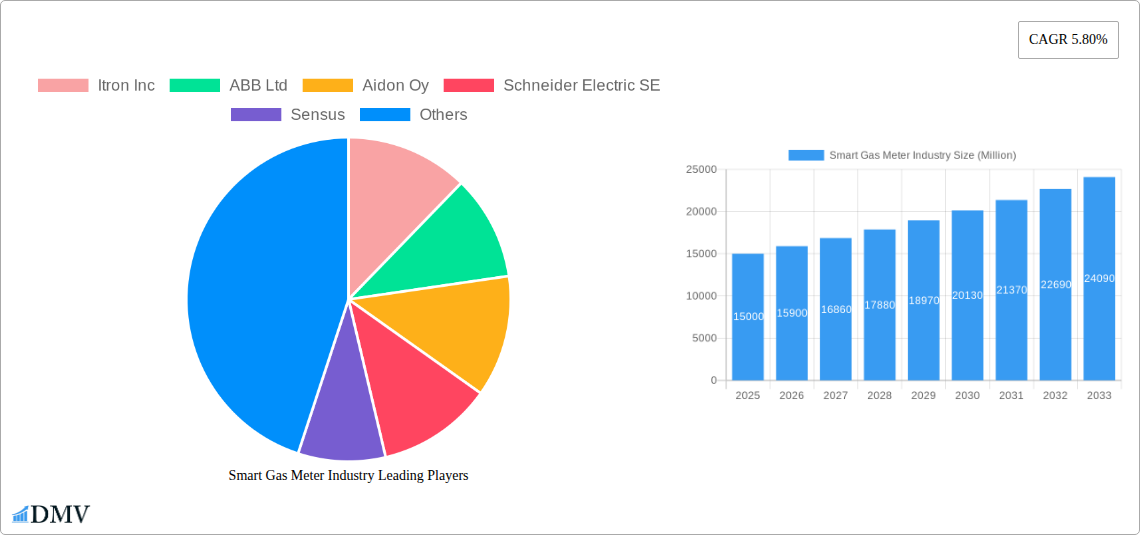
This section delves into the competitive landscape of the smart gas meter market, examining market concentration, innovation drivers, regulatory frameworks, substitute products, end-user demographics, and mergers & acquisitions (M&A) activities. The market is characterized by a moderately concentrated landscape with key players such as Itron Inc, ABB Ltd, and Schneider Electric SE holding significant market share. However, the presence of numerous smaller players and ongoing technological advancements contribute to a dynamic competitive environment.
Market Share Distribution (Estimated 2025):
- Itron Inc: 20%
- ABB Ltd: 15%
- Schneider Electric SE: 12%
- Other Players: 53%
Innovation Catalysts: The industry is driven by the need for improved energy efficiency, reduced gas leakage, and enhanced grid management. Technological advancements in communication protocols (e.g., cellular, LoRaWAN), data analytics capabilities, and the rise of smart city initiatives are key drivers of innovation.
Regulatory Landscape: Government regulations promoting energy efficiency and smart grid deployments significantly influence market growth. Variations in regulatory frameworks across different regions impact market penetration rates.
Substitute Products: While smart gas meters offer significant advantages, traditional mechanical meters continue to exist, although their market share is steadily declining.
End-User Profiles: The primary end-users are residential, commercial, and industrial consumers. The adoption rate varies across these segments, with commercial and industrial sectors leading due to higher potential for cost savings and efficiency gains.
M&A Activities: The industry has witnessed several M&A deals in recent years, with deal values ranging from xx Million to xx Million, primarily driven by strategic expansion and technology acquisitions. These activities further consolidate the market and accelerate technological advancements.
Smart Gas Meter Industry Industry Evolution
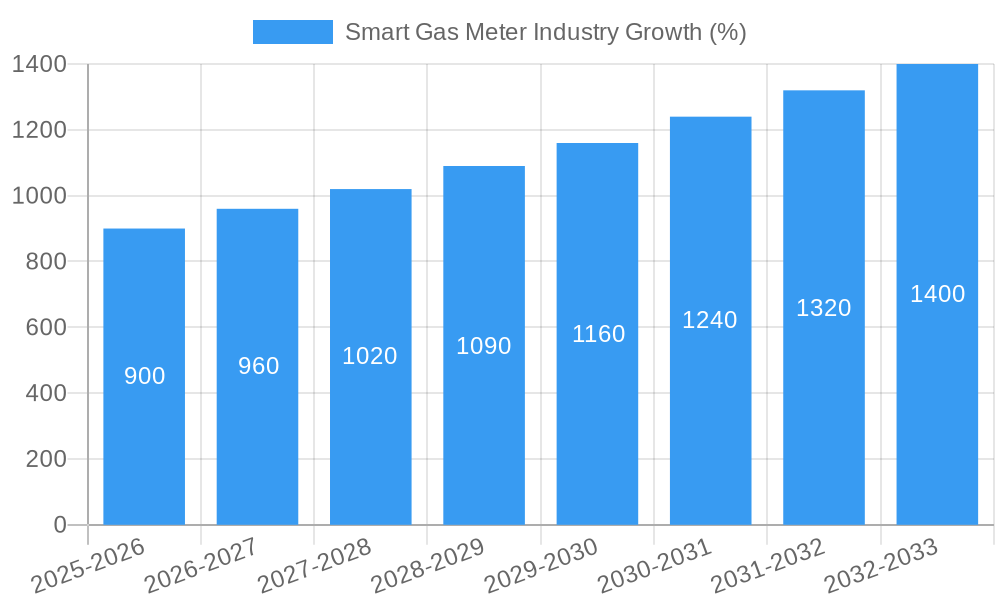
The smart gas meter industry has witnessed exponential growth over the past decade, fueled by technological advancements and increasing regulatory pressure. The market's historical period (2019-2024) saw a Compound Annual Growth Rate (CAGR) of xx%, driven by increased demand for advanced metering infrastructure (AMI) and the integration of smart gas meters into broader smart grid initiatives. This trajectory is expected to continue into the forecast period (2025-2033), with a projected CAGR of xx%.
The adoption of AMI meters, in particular, has been a significant driver of growth, offering real-time data on gas consumption, facilitating efficient billing, and enabling early detection of gas leaks. This technology enables utilities to optimize their operations, reduce losses, and improve customer service. Furthermore, the integration of advanced data analytics tools is enabling utilities to gain deeper insights into gas consumption patterns, enabling better demand forecasting and resource management. The increasing demand for enhanced grid management and the reduction of greenhouse gas emissions are further propelling the growth of the smart gas meter market. Consumer demand for accurate and timely billing, coupled with the desire for improved energy management, also plays a crucial role in market growth.
Leading Regions, Countries, or Segments in Smart Gas Meter Industry
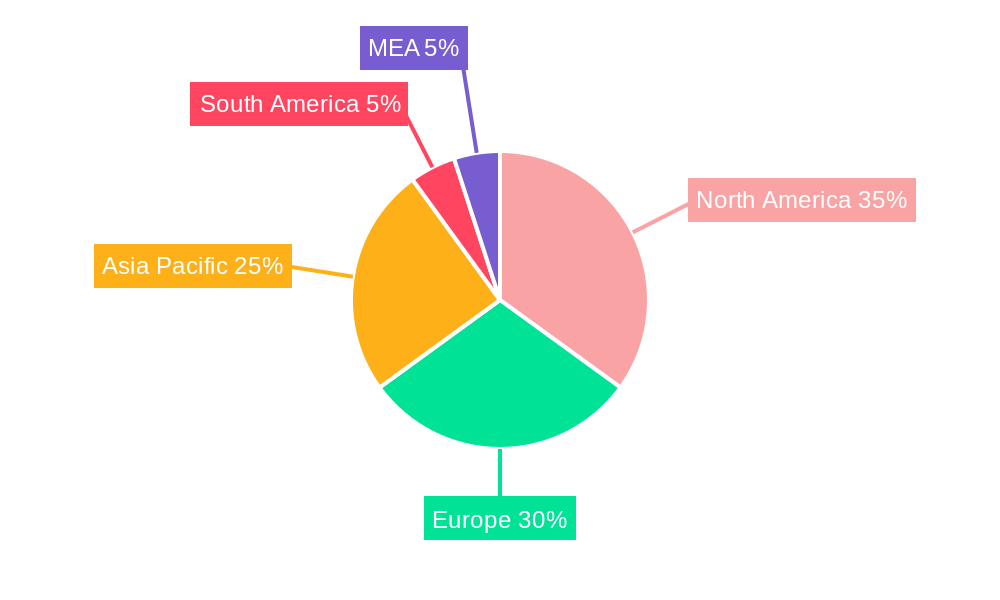
North America and Europe currently dominate the smart gas meter market, driven by robust regulatory frameworks, significant investments in smart grid infrastructure, and higher consumer awareness of energy efficiency. Within these regions, the adoption of AMI meters is particularly high.
Key Drivers:
- High Investment in Smart Grid Infrastructure: Government initiatives and private investments in smart grid technologies are boosting the demand for smart gas meters.
- Stringent Regulatory Support: Government regulations aimed at improving energy efficiency and reducing greenhouse gas emissions are creating a favorable market environment.
- Early Adoption of Advanced Metering Technologies: North America and Europe have been early adopters of advanced metering technologies like AMI.
- Favorable Economic Conditions: Higher disposable incomes in these regions support the adoption of advanced metering technologies.
Dominance Factors:
Developed economies in North America and Europe have already implemented advanced smart grid technologies, coupled with the supportive regulatory environment and higher consumer acceptance of new technologies. This early adoption has established these regions as market leaders, attracting significant investments and fostering technological innovation.
Segments: The AMI segment holds the largest market share within the devices segment. In solutions, Meter Data Management (MDM) and SCADA systems are leading, showcasing their importance for gas utility operations.
Smart Gas Meter Industry Product Innovations
Recent innovations in smart gas meters focus on enhanced communication capabilities, improved data analytics, and enhanced security features. The development of low-power, wide-area network (LPWAN) technologies like LoRaWAN and cellular networks has enabled greater range and improved reliability of communication. Advanced analytics tools are providing deeper insights into gas consumption patterns, enabling more efficient grid management. Furthermore, advanced security features are protecting against data breaches and cyberattacks. The introduction of gas leak detection capabilities integrated into smart meters is a significant advancement, minimizing environmental risks and operational disruptions.
Propelling Factors for Smart Gas Meter Growth
Technological advancements such as the development of LPWAN technologies and enhanced data analytics are key drivers. Economic factors, including the increasing cost of energy and the potential for cost savings through efficient gas management, are further driving market growth. Government regulations promoting energy efficiency and smart grid deployment are creating a favorable regulatory environment, stimulating growth.
Obstacles in the Smart Gas Meter Industry Market
High initial investment costs for upgrading existing infrastructure can be a barrier to adoption, particularly in developing economies. Supply chain disruptions can impact the availability of components, potentially delaying deployment. Intense competition among various vendors also puts pressure on pricing and profitability. Regulatory uncertainty in certain regions can hinder investment and deployment.
Future Opportunities in Smart Gas Meter Industry
The integration of smart gas meters into broader smart city initiatives presents significant opportunities. The development of next-generation communication technologies such as 5G will further enhance the capabilities of smart gas meters. Expanding into developing markets with growing energy demands will create new growth avenues. The development of advanced analytics tools to enable predictive maintenance and optimize grid operations will unlock new revenue streams.
Major Players in the Smart Gas Meter Industry Ecosystem
- Itron Inc
- ABB Ltd
- Aidon Oy
- Schneider Electric SE
- Sensus
- Elster Group GmbH
- Capgemini SA
- Aclara Technologies LLC
- Oracle Corporation
- CGI Inc
- Badger Meter
- General Electric Company
Key Developments in Smart Gas Meter Industry
- October 2022: Schneider Electric launched innovations such as GM AirSeT, EcoStruxure Energy Hub, and Schneider Electric EcoCare, aimed at addressing energy and climate concerns through advanced electrification and digitalization. These solutions support smart grid deployment and simplify energy management.
- July 2022: Itron Inc collaborated with United Systems & Software (USS) and Sevier County Utility District (SCUD) to deploy Itron's AMI Essentials for Gas, including 15,000 Itron Cellular 500G Gas Modules and Temetra. This deployment enhances gas distribution system visibility and optimizes operations.
Strategic Smart Gas Meter Industry Market Forecast
The smart gas meter market is poised for continued growth, driven by ongoing technological advancements, increasing regulatory support, and the expanding adoption of smart grid technologies globally. The market's potential is substantial, with significant opportunities in developing economies and emerging applications. The focus on enhanced data analytics, improved communication technologies, and integration with other smart city initiatives will continue to shape the future of the smart gas meter industry, leading to significant growth in the forecast period.
Smart Gas Meter Industry Segmentation
-
1. Devices
- 1.1. Automatic Meter Reading (AMR) Meters
- 1.2. Advanced Metering Infrastructure (AMI) Meters
- 1.3. Gas Meter Communication Modules
-
2. Solutions
- 2.1. Supervisory Control and Data Acquisition (SCADA)
- 2.2. Geographical Information System (GIS)
- 2.3. Enterprise Asset Management (EAM)
- 2.4. Mobile Workforce Management (MWM)
- 2.5. Meter Data Analytics
- 2.6. Gas Leak Detection
- 2.7. Meter Data Management (MDM)
-
3. Services
- 3.1. System Integration
- 3.2. Program Management
- 3.3. Installation
-
4. End-user
- 4.1. Residential
- 4.2. Commercial & Industrial
Smart Gas Meter Industry Segmentation By Geography
- 1. North America
- 2. Europe
- 3. Asia Pacific
- 4. Latin America
- 5. Middle East
Smart Gas Meter Industry REPORT HIGHLIGHTS
| Aspects | Details |
|---|---|
| Study Period | 2019-2033 |
| Base Year | 2024 |
| Estimated Year | 2025 |
| Forecast Period | 2025-2033 |
| Historical Period | 2019-2024 |
| Growth Rate | CAGR of 5.80% from 2019-2033 |
| Segmentation |
|
Table of Contents
- 1. Introduction
- 1.1. Research Scope
- 1.2. Market Segmentation
- 1.3. Research Methodology
- 1.4. Definitions and Assumptions
- 2. Executive Summary
- 2.1. Introduction
- 3. Market Dynamics
- 3.1. Introduction
- 3.2. Market Drivers
- 3.2.1. Favorable Government Regulations; Need for Reduction Carbon Footprint and Energy Security
- 3.3. Market Restrains
- 3.3.1. Irregularities in Data Due to Increased Number of Users; High Capital Expenditure
- 3.4. Market Trends
- 3.4.1. The Commercial and Industrial Application to Increase Significantly
- 4. Market Factor Analysis
- 4.1. Porters Five Forces
- 4.2. Supply/Value Chain
- 4.3. PESTEL analysis
- 4.4. Market Entropy
- 4.5. Patent/Trademark Analysis
- 5. Global Smart Gas Meter Industry Analysis, Insights and Forecast, 2019-2031
- 5.1. Market Analysis, Insights and Forecast - by Devices
- 5.1.1. Automatic Meter Reading (AMR) Meters
- 5.1.2. Advanced Metering Infrastructure (AMI) Meters
- 5.1.3. Gas Meter Communication Modules
- 5.2. Market Analysis, Insights and Forecast - by Solutions
- 5.2.1. Supervisory Control and Data Acquisition (SCADA)
- 5.2.2. Geographical Information System (GIS)
- 5.2.3. Enterprise Asset Management (EAM)
- 5.2.4. Mobile Workforce Management (MWM)
- 5.2.5. Meter Data Analytics
- 5.2.6. Gas Leak Detection
- 5.2.7. Meter Data Management (MDM)
- 5.3. Market Analysis, Insights and Forecast - by Services
- 5.3.1. System Integration
- 5.3.2. Program Management
- 5.3.3. Installation
- 5.4. Market Analysis, Insights and Forecast - by End-user
- 5.4.1. Residential
- 5.4.2. Commercial & Industrial
- 5.5. Market Analysis, Insights and Forecast - by Region
- 5.5.1. North America
- 5.5.2. Europe
- 5.5.3. Asia Pacific
- 5.5.4. Latin America
- 5.5.5. Middle East
- 5.1. Market Analysis, Insights and Forecast - by Devices
- 6. North America Smart Gas Meter Industry Analysis, Insights and Forecast, 2019-2031
- 6.1. Market Analysis, Insights and Forecast - by Devices
- 6.1.1. Automatic Meter Reading (AMR) Meters
- 6.1.2. Advanced Metering Infrastructure (AMI) Meters
- 6.1.3. Gas Meter Communication Modules
- 6.2. Market Analysis, Insights and Forecast - by Solutions
- 6.2.1. Supervisory Control and Data Acquisition (SCADA)
- 6.2.2. Geographical Information System (GIS)
- 6.2.3. Enterprise Asset Management (EAM)
- 6.2.4. Mobile Workforce Management (MWM)
- 6.2.5. Meter Data Analytics
- 6.2.6. Gas Leak Detection
- 6.2.7. Meter Data Management (MDM)
- 6.3. Market Analysis, Insights and Forecast - by Services
- 6.3.1. System Integration
- 6.3.2. Program Management
- 6.3.3. Installation
- 6.4. Market Analysis, Insights and Forecast - by End-user
- 6.4.1. Residential
- 6.4.2. Commercial & Industrial
- 6.1. Market Analysis, Insights and Forecast - by Devices
- 7. Europe Smart Gas Meter Industry Analysis, Insights and Forecast, 2019-2031
- 7.1. Market Analysis, Insights and Forecast - by Devices
- 7.1.1. Automatic Meter Reading (AMR) Meters
- 7.1.2. Advanced Metering Infrastructure (AMI) Meters
- 7.1.3. Gas Meter Communication Modules
- 7.2. Market Analysis, Insights and Forecast - by Solutions
- 7.2.1. Supervisory Control and Data Acquisition (SCADA)
- 7.2.2. Geographical Information System (GIS)
- 7.2.3. Enterprise Asset Management (EAM)
- 7.2.4. Mobile Workforce Management (MWM)
- 7.2.5. Meter Data Analytics
- 7.2.6. Gas Leak Detection
- 7.2.7. Meter Data Management (MDM)
- 7.3. Market Analysis, Insights and Forecast - by Services
- 7.3.1. System Integration
- 7.3.2. Program Management
- 7.3.3. Installation
- 7.4. Market Analysis, Insights and Forecast - by End-user
- 7.4.1. Residential
- 7.4.2. Commercial & Industrial
- 7.1. Market Analysis, Insights and Forecast - by Devices
- 8. Asia Pacific Smart Gas Meter Industry Analysis, Insights and Forecast, 2019-2031
- 8.1. Market Analysis, Insights and Forecast - by Devices
- 8.1.1. Automatic Meter Reading (AMR) Meters
- 8.1.2. Advanced Metering Infrastructure (AMI) Meters
- 8.1.3. Gas Meter Communication Modules
- 8.2. Market Analysis, Insights and Forecast - by Solutions
- 8.2.1. Supervisory Control and Data Acquisition (SCADA)
- 8.2.2. Geographical Information System (GIS)
- 8.2.3. Enterprise Asset Management (EAM)
- 8.2.4. Mobile Workforce Management (MWM)
- 8.2.5. Meter Data Analytics
- 8.2.6. Gas Leak Detection
- 8.2.7. Meter Data Management (MDM)
- 8.3. Market Analysis, Insights and Forecast - by Services
- 8.3.1. System Integration
- 8.3.2. Program Management
- 8.3.3. Installation
- 8.4. Market Analysis, Insights and Forecast - by End-user
- 8.4.1. Residential
- 8.4.2. Commercial & Industrial
- 8.1. Market Analysis, Insights and Forecast - by Devices
- 9. Latin America Smart Gas Meter Industry Analysis, Insights and Forecast, 2019-2031
- 9.1. Market Analysis, Insights and Forecast - by Devices
- 9.1.1. Automatic Meter Reading (AMR) Meters
- 9.1.2. Advanced Metering Infrastructure (AMI) Meters
- 9.1.3. Gas Meter Communication Modules
- 9.2. Market Analysis, Insights and Forecast - by Solutions
- 9.2.1. Supervisory Control and Data Acquisition (SCADA)
- 9.2.2. Geographical Information System (GIS)
- 9.2.3. Enterprise Asset Management (EAM)
- 9.2.4. Mobile Workforce Management (MWM)
- 9.2.5. Meter Data Analytics
- 9.2.6. Gas Leak Detection
- 9.2.7. Meter Data Management (MDM)
- 9.3. Market Analysis, Insights and Forecast - by Services
- 9.3.1. System Integration
- 9.3.2. Program Management
- 9.3.3. Installation
- 9.4. Market Analysis, Insights and Forecast - by End-user
- 9.4.1. Residential
- 9.4.2. Commercial & Industrial
- 9.1. Market Analysis, Insights and Forecast - by Devices
- 10. Middle East Smart Gas Meter Industry Analysis, Insights and Forecast, 2019-2031
- 10.1. Market Analysis, Insights and Forecast - by Devices
- 10.1.1. Automatic Meter Reading (AMR) Meters
- 10.1.2. Advanced Metering Infrastructure (AMI) Meters
- 10.1.3. Gas Meter Communication Modules
- 10.2. Market Analysis, Insights and Forecast - by Solutions
- 10.2.1. Supervisory Control and Data Acquisition (SCADA)
- 10.2.2. Geographical Information System (GIS)
- 10.2.3. Enterprise Asset Management (EAM)
- 10.2.4. Mobile Workforce Management (MWM)
- 10.2.5. Meter Data Analytics
- 10.2.6. Gas Leak Detection
- 10.2.7. Meter Data Management (MDM)
- 10.3. Market Analysis, Insights and Forecast - by Services
- 10.3.1. System Integration
- 10.3.2. Program Management
- 10.3.3. Installation
- 10.4. Market Analysis, Insights and Forecast - by End-user
- 10.4.1. Residential
- 10.4.2. Commercial & Industrial
- 10.1. Market Analysis, Insights and Forecast - by Devices
- 11. North America Smart Gas Meter Industry Analysis, Insights and Forecast, 2019-2031
- 11.1. Market Analysis, Insights and Forecast - By Country/Sub-region
- 11.1.1 United States
- 11.1.2 Canada
- 11.1.3 Mexico
- 12. Europe Smart Gas Meter Industry Analysis, Insights and Forecast, 2019-2031
- 12.1. Market Analysis, Insights and Forecast - By Country/Sub-region
- 12.1.1 Germany
- 12.1.2 United Kingdom
- 12.1.3 France
- 12.1.4 Spain
- 12.1.5 Italy
- 12.1.6 Spain
- 12.1.7 Belgium
- 12.1.8 Netherland
- 12.1.9 Nordics
- 12.1.10 Rest of Europe
- 13. Asia Pacific Smart Gas Meter Industry Analysis, Insights and Forecast, 2019-2031
- 13.1. Market Analysis, Insights and Forecast - By Country/Sub-region
- 13.1.1 China
- 13.1.2 Japan
- 13.1.3 India
- 13.1.4 South Korea
- 13.1.5 Southeast Asia
- 13.1.6 Australia
- 13.1.7 Indonesia
- 13.1.8 Phillipes
- 13.1.9 Singapore
- 13.1.10 Thailandc
- 13.1.11 Rest of Asia Pacific
- 14. South America Smart Gas Meter Industry Analysis, Insights and Forecast, 2019-2031
- 14.1. Market Analysis, Insights and Forecast - By Country/Sub-region
- 14.1.1 Brazil
- 14.1.2 Argentina
- 14.1.3 Peru
- 14.1.4 Chile
- 14.1.5 Colombia
- 14.1.6 Ecuador
- 14.1.7 Venezuela
- 14.1.8 Rest of South America
- 15. MEA Smart Gas Meter Industry Analysis, Insights and Forecast, 2019-2031
- 15.1. Market Analysis, Insights and Forecast - By Country/Sub-region
- 15.1.1 United Arab Emirates
- 15.1.2 Saudi Arabia
- 15.1.3 South Africa
- 15.1.4 Rest of Middle East and Africa
- 16. Competitive Analysis
- 16.1. Global Market Share Analysis 2024
- 16.2. Company Profiles
- 16.2.1 Itron Inc
- 16.2.1.1. Overview
- 16.2.1.2. Products
- 16.2.1.3. SWOT Analysis
- 16.2.1.4. Recent Developments
- 16.2.1.5. Financials (Based on Availability)
- 16.2.2 ABB Ltd
- 16.2.2.1. Overview
- 16.2.2.2. Products
- 16.2.2.3. SWOT Analysis
- 16.2.2.4. Recent Developments
- 16.2.2.5. Financials (Based on Availability)
- 16.2.3 Aidon Oy
- 16.2.3.1. Overview
- 16.2.3.2. Products
- 16.2.3.3. SWOT Analysis
- 16.2.3.4. Recent Developments
- 16.2.3.5. Financials (Based on Availability)
- 16.2.4 Schneider Electric SE
- 16.2.4.1. Overview
- 16.2.4.2. Products
- 16.2.4.3. SWOT Analysis
- 16.2.4.4. Recent Developments
- 16.2.4.5. Financials (Based on Availability)
- 16.2.5 Sensus
- 16.2.5.1. Overview
- 16.2.5.2. Products
- 16.2.5.3. SWOT Analysis
- 16.2.5.4. Recent Developments
- 16.2.5.5. Financials (Based on Availability)
- 16.2.6 Elster Group GmbH
- 16.2.6.1. Overview
- 16.2.6.2. Products
- 16.2.6.3. SWOT Analysis
- 16.2.6.4. Recent Developments
- 16.2.6.5. Financials (Based on Availability)
- 16.2.7 Capgemini SA
- 16.2.7.1. Overview
- 16.2.7.2. Products
- 16.2.7.3. SWOT Analysis
- 16.2.7.4. Recent Developments
- 16.2.7.5. Financials (Based on Availability)
- 16.2.8 Aclara Technologies LLC
- 16.2.8.1. Overview
- 16.2.8.2. Products
- 16.2.8.3. SWOT Analysis
- 16.2.8.4. Recent Developments
- 16.2.8.5. Financials (Based on Availability)
- 16.2.9 Oracle Corporation
- 16.2.9.1. Overview
- 16.2.9.2. Products
- 16.2.9.3. SWOT Analysis
- 16.2.9.4. Recent Developments
- 16.2.9.5. Financials (Based on Availability)
- 16.2.10 CGI Inc
- 16.2.10.1. Overview
- 16.2.10.2. Products
- 16.2.10.3. SWOT Analysis
- 16.2.10.4. Recent Developments
- 16.2.10.5. Financials (Based on Availability)
- 16.2.11 Badger Meter
- 16.2.11.1. Overview
- 16.2.11.2. Products
- 16.2.11.3. SWOT Analysis
- 16.2.11.4. Recent Developments
- 16.2.11.5. Financials (Based on Availability)
- 16.2.12 General Electric Company
- 16.2.12.1. Overview
- 16.2.12.2. Products
- 16.2.12.3. SWOT Analysis
- 16.2.12.4. Recent Developments
- 16.2.12.5. Financials (Based on Availability)
- 16.2.1 Itron Inc
List of Figures
- Figure 1: Global Smart Gas Meter Industry Revenue Breakdown (Million, %) by Region 2024 & 2032
- Figure 2: Global Smart Gas Meter Industry Volume Breakdown (K Units, %) by Region 2024 & 2032
- Figure 3: North America Smart Gas Meter Industry Revenue (Million), by Country 2024 & 2032
- Figure 4: North America Smart Gas Meter Industry Volume (K Units), by Country 2024 & 2032
- Figure 5: North America Smart Gas Meter Industry Revenue Share (%), by Country 2024 & 2032
- Figure 6: North America Smart Gas Meter Industry Volume Share (%), by Country 2024 & 2032
- Figure 7: Europe Smart Gas Meter Industry Revenue (Million), by Country 2024 & 2032
- Figure 8: Europe Smart Gas Meter Industry Volume (K Units), by Country 2024 & 2032
- Figure 9: Europe Smart Gas Meter Industry Revenue Share (%), by Country 2024 & 2032
- Figure 10: Europe Smart Gas Meter Industry Volume Share (%), by Country 2024 & 2032
- Figure 11: Asia Pacific Smart Gas Meter Industry Revenue (Million), by Country 2024 & 2032
- Figure 12: Asia Pacific Smart Gas Meter Industry Volume (K Units), by Country 2024 & 2032
- Figure 13: Asia Pacific Smart Gas Meter Industry Revenue Share (%), by Country 2024 & 2032
- Figure 14: Asia Pacific Smart Gas Meter Industry Volume Share (%), by Country 2024 & 2032
- Figure 15: South America Smart Gas Meter Industry Revenue (Million), by Country 2024 & 2032
- Figure 16: South America Smart Gas Meter Industry Volume (K Units), by Country 2024 & 2032
- Figure 17: South America Smart Gas Meter Industry Revenue Share (%), by Country 2024 & 2032
- Figure 18: South America Smart Gas Meter Industry Volume Share (%), by Country 2024 & 2032
- Figure 19: MEA Smart Gas Meter Industry Revenue (Million), by Country 2024 & 2032
- Figure 20: MEA Smart Gas Meter Industry Volume (K Units), by Country 2024 & 2032
- Figure 21: MEA Smart Gas Meter Industry Revenue Share (%), by Country 2024 & 2032
- Figure 22: MEA Smart Gas Meter Industry Volume Share (%), by Country 2024 & 2032
- Figure 23: North America Smart Gas Meter Industry Revenue (Million), by Devices 2024 & 2032
- Figure 24: North America Smart Gas Meter Industry Volume (K Units), by Devices 2024 & 2032
- Figure 25: North America Smart Gas Meter Industry Revenue Share (%), by Devices 2024 & 2032
- Figure 26: North America Smart Gas Meter Industry Volume Share (%), by Devices 2024 & 2032
- Figure 27: North America Smart Gas Meter Industry Revenue (Million), by Solutions 2024 & 2032
- Figure 28: North America Smart Gas Meter Industry Volume (K Units), by Solutions 2024 & 2032
- Figure 29: North America Smart Gas Meter Industry Revenue Share (%), by Solutions 2024 & 2032
- Figure 30: North America Smart Gas Meter Industry Volume Share (%), by Solutions 2024 & 2032
- Figure 31: North America Smart Gas Meter Industry Revenue (Million), by Services 2024 & 2032
- Figure 32: North America Smart Gas Meter Industry Volume (K Units), by Services 2024 & 2032
- Figure 33: North America Smart Gas Meter Industry Revenue Share (%), by Services 2024 & 2032
- Figure 34: North America Smart Gas Meter Industry Volume Share (%), by Services 2024 & 2032
- Figure 35: North America Smart Gas Meter Industry Revenue (Million), by End-user 2024 & 2032
- Figure 36: North America Smart Gas Meter Industry Volume (K Units), by End-user 2024 & 2032
- Figure 37: North America Smart Gas Meter Industry Revenue Share (%), by End-user 2024 & 2032
- Figure 38: North America Smart Gas Meter Industry Volume Share (%), by End-user 2024 & 2032
- Figure 39: North America Smart Gas Meter Industry Revenue (Million), by Country 2024 & 2032
- Figure 40: North America Smart Gas Meter Industry Volume (K Units), by Country 2024 & 2032
- Figure 41: North America Smart Gas Meter Industry Revenue Share (%), by Country 2024 & 2032
- Figure 42: North America Smart Gas Meter Industry Volume Share (%), by Country 2024 & 2032
- Figure 43: Europe Smart Gas Meter Industry Revenue (Million), by Devices 2024 & 2032
- Figure 44: Europe Smart Gas Meter Industry Volume (K Units), by Devices 2024 & 2032
- Figure 45: Europe Smart Gas Meter Industry Revenue Share (%), by Devices 2024 & 2032
- Figure 46: Europe Smart Gas Meter Industry Volume Share (%), by Devices 2024 & 2032
- Figure 47: Europe Smart Gas Meter Industry Revenue (Million), by Solutions 2024 & 2032
- Figure 48: Europe Smart Gas Meter Industry Volume (K Units), by Solutions 2024 & 2032
- Figure 49: Europe Smart Gas Meter Industry Revenue Share (%), by Solutions 2024 & 2032
- Figure 50: Europe Smart Gas Meter Industry Volume Share (%), by Solutions 2024 & 2032
- Figure 51: Europe Smart Gas Meter Industry Revenue (Million), by Services 2024 & 2032
- Figure 52: Europe Smart Gas Meter Industry Volume (K Units), by Services 2024 & 2032
- Figure 53: Europe Smart Gas Meter Industry Revenue Share (%), by Services 2024 & 2032
- Figure 54: Europe Smart Gas Meter Industry Volume Share (%), by Services 2024 & 2032
- Figure 55: Europe Smart Gas Meter Industry Revenue (Million), by End-user 2024 & 2032
- Figure 56: Europe Smart Gas Meter Industry Volume (K Units), by End-user 2024 & 2032
- Figure 57: Europe Smart Gas Meter Industry Revenue Share (%), by End-user 2024 & 2032
- Figure 58: Europe Smart Gas Meter Industry Volume Share (%), by End-user 2024 & 2032
- Figure 59: Europe Smart Gas Meter Industry Revenue (Million), by Country 2024 & 2032
- Figure 60: Europe Smart Gas Meter Industry Volume (K Units), by Country 2024 & 2032
- Figure 61: Europe Smart Gas Meter Industry Revenue Share (%), by Country 2024 & 2032
- Figure 62: Europe Smart Gas Meter Industry Volume Share (%), by Country 2024 & 2032
- Figure 63: Asia Pacific Smart Gas Meter Industry Revenue (Million), by Devices 2024 & 2032
- Figure 64: Asia Pacific Smart Gas Meter Industry Volume (K Units), by Devices 2024 & 2032
- Figure 65: Asia Pacific Smart Gas Meter Industry Revenue Share (%), by Devices 2024 & 2032
- Figure 66: Asia Pacific Smart Gas Meter Industry Volume Share (%), by Devices 2024 & 2032
- Figure 67: Asia Pacific Smart Gas Meter Industry Revenue (Million), by Solutions 2024 & 2032
- Figure 68: Asia Pacific Smart Gas Meter Industry Volume (K Units), by Solutions 2024 & 2032
- Figure 69: Asia Pacific Smart Gas Meter Industry Revenue Share (%), by Solutions 2024 & 2032
- Figure 70: Asia Pacific Smart Gas Meter Industry Volume Share (%), by Solutions 2024 & 2032
- Figure 71: Asia Pacific Smart Gas Meter Industry Revenue (Million), by Services 2024 & 2032
- Figure 72: Asia Pacific Smart Gas Meter Industry Volume (K Units), by Services 2024 & 2032
- Figure 73: Asia Pacific Smart Gas Meter Industry Revenue Share (%), by Services 2024 & 2032
- Figure 74: Asia Pacific Smart Gas Meter Industry Volume Share (%), by Services 2024 & 2032
- Figure 75: Asia Pacific Smart Gas Meter Industry Revenue (Million), by End-user 2024 & 2032
- Figure 76: Asia Pacific Smart Gas Meter Industry Volume (K Units), by End-user 2024 & 2032
- Figure 77: Asia Pacific Smart Gas Meter Industry Revenue Share (%), by End-user 2024 & 2032
- Figure 78: Asia Pacific Smart Gas Meter Industry Volume Share (%), by End-user 2024 & 2032
- Figure 79: Asia Pacific Smart Gas Meter Industry Revenue (Million), by Country 2024 & 2032
- Figure 80: Asia Pacific Smart Gas Meter Industry Volume (K Units), by Country 2024 & 2032
- Figure 81: Asia Pacific Smart Gas Meter Industry Revenue Share (%), by Country 2024 & 2032
- Figure 82: Asia Pacific Smart Gas Meter Industry Volume Share (%), by Country 2024 & 2032
- Figure 83: Latin America Smart Gas Meter Industry Revenue (Million), by Devices 2024 & 2032
- Figure 84: Latin America Smart Gas Meter Industry Volume (K Units), by Devices 2024 & 2032
- Figure 85: Latin America Smart Gas Meter Industry Revenue Share (%), by Devices 2024 & 2032
- Figure 86: Latin America Smart Gas Meter Industry Volume Share (%), by Devices 2024 & 2032
- Figure 87: Latin America Smart Gas Meter Industry Revenue (Million), by Solutions 2024 & 2032
- Figure 88: Latin America Smart Gas Meter Industry Volume (K Units), by Solutions 2024 & 2032
- Figure 89: Latin America Smart Gas Meter Industry Revenue Share (%), by Solutions 2024 & 2032
- Figure 90: Latin America Smart Gas Meter Industry Volume Share (%), by Solutions 2024 & 2032
- Figure 91: Latin America Smart Gas Meter Industry Revenue (Million), by Services 2024 & 2032
- Figure 92: Latin America Smart Gas Meter Industry Volume (K Units), by Services 2024 & 2032
- Figure 93: Latin America Smart Gas Meter Industry Revenue Share (%), by Services 2024 & 2032
- Figure 94: Latin America Smart Gas Meter Industry Volume Share (%), by Services 2024 & 2032
- Figure 95: Latin America Smart Gas Meter Industry Revenue (Million), by End-user 2024 & 2032
- Figure 96: Latin America Smart Gas Meter Industry Volume (K Units), by End-user 2024 & 2032
- Figure 97: Latin America Smart Gas Meter Industry Revenue Share (%), by End-user 2024 & 2032
- Figure 98: Latin America Smart Gas Meter Industry Volume Share (%), by End-user 2024 & 2032
- Figure 99: Latin America Smart Gas Meter Industry Revenue (Million), by Country 2024 & 2032
- Figure 100: Latin America Smart Gas Meter Industry Volume (K Units), by Country 2024 & 2032
- Figure 101: Latin America Smart Gas Meter Industry Revenue Share (%), by Country 2024 & 2032
- Figure 102: Latin America Smart Gas Meter Industry Volume Share (%), by Country 2024 & 2032
- Figure 103: Middle East Smart Gas Meter Industry Revenue (Million), by Devices 2024 & 2032
- Figure 104: Middle East Smart Gas Meter Industry Volume (K Units), by Devices 2024 & 2032
- Figure 105: Middle East Smart Gas Meter Industry Revenue Share (%), by Devices 2024 & 2032
- Figure 106: Middle East Smart Gas Meter Industry Volume Share (%), by Devices 2024 & 2032
- Figure 107: Middle East Smart Gas Meter Industry Revenue (Million), by Solutions 2024 & 2032
- Figure 108: Middle East Smart Gas Meter Industry Volume (K Units), by Solutions 2024 & 2032
- Figure 109: Middle East Smart Gas Meter Industry Revenue Share (%), by Solutions 2024 & 2032
- Figure 110: Middle East Smart Gas Meter Industry Volume Share (%), by Solutions 2024 & 2032
- Figure 111: Middle East Smart Gas Meter Industry Revenue (Million), by Services 2024 & 2032
- Figure 112: Middle East Smart Gas Meter Industry Volume (K Units), by Services 2024 & 2032
- Figure 113: Middle East Smart Gas Meter Industry Revenue Share (%), by Services 2024 & 2032
- Figure 114: Middle East Smart Gas Meter Industry Volume Share (%), by Services 2024 & 2032
- Figure 115: Middle East Smart Gas Meter Industry Revenue (Million), by End-user 2024 & 2032
- Figure 116: Middle East Smart Gas Meter Industry Volume (K Units), by End-user 2024 & 2032
- Figure 117: Middle East Smart Gas Meter Industry Revenue Share (%), by End-user 2024 & 2032
- Figure 118: Middle East Smart Gas Meter Industry Volume Share (%), by End-user 2024 & 2032
- Figure 119: Middle East Smart Gas Meter Industry Revenue (Million), by Country 2024 & 2032
- Figure 120: Middle East Smart Gas Meter Industry Volume (K Units), by Country 2024 & 2032
- Figure 121: Middle East Smart Gas Meter Industry Revenue Share (%), by Country 2024 & 2032
- Figure 122: Middle East Smart Gas Meter Industry Volume Share (%), by Country 2024 & 2032
List of Tables
- Table 1: Global Smart Gas Meter Industry Revenue Million Forecast, by Region 2019 & 2032
- Table 2: Global Smart Gas Meter Industry Volume K Units Forecast, by Region 2019 & 2032
- Table 3: Global Smart Gas Meter Industry Revenue Million Forecast, by Devices 2019 & 2032
- Table 4: Global Smart Gas Meter Industry Volume K Units Forecast, by Devices 2019 & 2032
- Table 5: Global Smart Gas Meter Industry Revenue Million Forecast, by Solutions 2019 & 2032
- Table 6: Global Smart Gas Meter Industry Volume K Units Forecast, by Solutions 2019 & 2032
- Table 7: Global Smart Gas Meter Industry Revenue Million Forecast, by Services 2019 & 2032
- Table 8: Global Smart Gas Meter Industry Volume K Units Forecast, by Services 2019 & 2032
- Table 9: Global Smart Gas Meter Industry Revenue Million Forecast, by End-user 2019 & 2032
- Table 10: Global Smart Gas Meter Industry Volume K Units Forecast, by End-user 2019 & 2032
- Table 11: Global Smart Gas Meter Industry Revenue Million Forecast, by Region 2019 & 2032
- Table 12: Global Smart Gas Meter Industry Volume K Units Forecast, by Region 2019 & 2032
- Table 13: Global Smart Gas Meter Industry Revenue Million Forecast, by Country 2019 & 2032
- Table 14: Global Smart Gas Meter Industry Volume K Units Forecast, by Country 2019 & 2032
- Table 15: United States Smart Gas Meter Industry Revenue (Million) Forecast, by Application 2019 & 2032
- Table 16: United States Smart Gas Meter Industry Volume (K Units) Forecast, by Application 2019 & 2032
- Table 17: Canada Smart Gas Meter Industry Revenue (Million) Forecast, by Application 2019 & 2032
- Table 18: Canada Smart Gas Meter Industry Volume (K Units) Forecast, by Application 2019 & 2032
- Table 19: Mexico Smart Gas Meter Industry Revenue (Million) Forecast, by Application 2019 & 2032
- Table 20: Mexico Smart Gas Meter Industry Volume (K Units) Forecast, by Application 2019 & 2032
- Table 21: Global Smart Gas Meter Industry Revenue Million Forecast, by Country 2019 & 2032
- Table 22: Global Smart Gas Meter Industry Volume K Units Forecast, by Country 2019 & 2032
- Table 23: Germany Smart Gas Meter Industry Revenue (Million) Forecast, by Application 2019 & 2032
- Table 24: Germany Smart Gas Meter Industry Volume (K Units) Forecast, by Application 2019 & 2032
- Table 25: United Kingdom Smart Gas Meter Industry Revenue (Million) Forecast, by Application 2019 & 2032
- Table 26: United Kingdom Smart Gas Meter Industry Volume (K Units) Forecast, by Application 2019 & 2032
- Table 27: France Smart Gas Meter Industry Revenue (Million) Forecast, by Application 2019 & 2032
- Table 28: France Smart Gas Meter Industry Volume (K Units) Forecast, by Application 2019 & 2032
- Table 29: Spain Smart Gas Meter Industry Revenue (Million) Forecast, by Application 2019 & 2032
- Table 30: Spain Smart Gas Meter Industry Volume (K Units) Forecast, by Application 2019 & 2032
- Table 31: Italy Smart Gas Meter Industry Revenue (Million) Forecast, by Application 2019 & 2032
- Table 32: Italy Smart Gas Meter Industry Volume (K Units) Forecast, by Application 2019 & 2032
- Table 33: Spain Smart Gas Meter Industry Revenue (Million) Forecast, by Application 2019 & 2032
- Table 34: Spain Smart Gas Meter Industry Volume (K Units) Forecast, by Application 2019 & 2032
- Table 35: Belgium Smart Gas Meter Industry Revenue (Million) Forecast, by Application 2019 & 2032
- Table 36: Belgium Smart Gas Meter Industry Volume (K Units) Forecast, by Application 2019 & 2032
- Table 37: Netherland Smart Gas Meter Industry Revenue (Million) Forecast, by Application 2019 & 2032
- Table 38: Netherland Smart Gas Meter Industry Volume (K Units) Forecast, by Application 2019 & 2032
- Table 39: Nordics Smart Gas Meter Industry Revenue (Million) Forecast, by Application 2019 & 2032
- Table 40: Nordics Smart Gas Meter Industry Volume (K Units) Forecast, by Application 2019 & 2032
- Table 41: Rest of Europe Smart Gas Meter Industry Revenue (Million) Forecast, by Application 2019 & 2032
- Table 42: Rest of Europe Smart Gas Meter Industry Volume (K Units) Forecast, by Application 2019 & 2032
- Table 43: Global Smart Gas Meter Industry Revenue Million Forecast, by Country 2019 & 2032
- Table 44: Global Smart Gas Meter Industry Volume K Units Forecast, by Country 2019 & 2032
- Table 45: China Smart Gas Meter Industry Revenue (Million) Forecast, by Application 2019 & 2032
- Table 46: China Smart Gas Meter Industry Volume (K Units) Forecast, by Application 2019 & 2032
- Table 47: Japan Smart Gas Meter Industry Revenue (Million) Forecast, by Application 2019 & 2032
- Table 48: Japan Smart Gas Meter Industry Volume (K Units) Forecast, by Application 2019 & 2032
- Table 49: India Smart Gas Meter Industry Revenue (Million) Forecast, by Application 2019 & 2032
- Table 50: India Smart Gas Meter Industry Volume (K Units) Forecast, by Application 2019 & 2032
- Table 51: South Korea Smart Gas Meter Industry Revenue (Million) Forecast, by Application 2019 & 2032
- Table 52: South Korea Smart Gas Meter Industry Volume (K Units) Forecast, by Application 2019 & 2032
- Table 53: Southeast Asia Smart Gas Meter Industry Revenue (Million) Forecast, by Application 2019 & 2032
- Table 54: Southeast Asia Smart Gas Meter Industry Volume (K Units) Forecast, by Application 2019 & 2032
- Table 55: Australia Smart Gas Meter Industry Revenue (Million) Forecast, by Application 2019 & 2032
- Table 56: Australia Smart Gas Meter Industry Volume (K Units) Forecast, by Application 2019 & 2032
- Table 57: Indonesia Smart Gas Meter Industry Revenue (Million) Forecast, by Application 2019 & 2032
- Table 58: Indonesia Smart Gas Meter Industry Volume (K Units) Forecast, by Application 2019 & 2032
- Table 59: Phillipes Smart Gas Meter Industry Revenue (Million) Forecast, by Application 2019 & 2032
- Table 60: Phillipes Smart Gas Meter Industry Volume (K Units) Forecast, by Application 2019 & 2032
- Table 61: Singapore Smart Gas Meter Industry Revenue (Million) Forecast, by Application 2019 & 2032
- Table 62: Singapore Smart Gas Meter Industry Volume (K Units) Forecast, by Application 2019 & 2032
- Table 63: Thailandc Smart Gas Meter Industry Revenue (Million) Forecast, by Application 2019 & 2032
- Table 64: Thailandc Smart Gas Meter Industry Volume (K Units) Forecast, by Application 2019 & 2032
- Table 65: Rest of Asia Pacific Smart Gas Meter Industry Revenue (Million) Forecast, by Application 2019 & 2032
- Table 66: Rest of Asia Pacific Smart Gas Meter Industry Volume (K Units) Forecast, by Application 2019 & 2032
- Table 67: Global Smart Gas Meter Industry Revenue Million Forecast, by Country 2019 & 2032
- Table 68: Global Smart Gas Meter Industry Volume K Units Forecast, by Country 2019 & 2032
- Table 69: Brazil Smart Gas Meter Industry Revenue (Million) Forecast, by Application 2019 & 2032
- Table 70: Brazil Smart Gas Meter Industry Volume (K Units) Forecast, by Application 2019 & 2032
- Table 71: Argentina Smart Gas Meter Industry Revenue (Million) Forecast, by Application 2019 & 2032
- Table 72: Argentina Smart Gas Meter Industry Volume (K Units) Forecast, by Application 2019 & 2032
- Table 73: Peru Smart Gas Meter Industry Revenue (Million) Forecast, by Application 2019 & 2032
- Table 74: Peru Smart Gas Meter Industry Volume (K Units) Forecast, by Application 2019 & 2032
- Table 75: Chile Smart Gas Meter Industry Revenue (Million) Forecast, by Application 2019 & 2032
- Table 76: Chile Smart Gas Meter Industry Volume (K Units) Forecast, by Application 2019 & 2032
- Table 77: Colombia Smart Gas Meter Industry Revenue (Million) Forecast, by Application 2019 & 2032
- Table 78: Colombia Smart Gas Meter Industry Volume (K Units) Forecast, by Application 2019 & 2032
- Table 79: Ecuador Smart Gas Meter Industry Revenue (Million) Forecast, by Application 2019 & 2032
- Table 80: Ecuador Smart Gas Meter Industry Volume (K Units) Forecast, by Application 2019 & 2032
- Table 81: Venezuela Smart Gas Meter Industry Revenue (Million) Forecast, by Application 2019 & 2032
- Table 82: Venezuela Smart Gas Meter Industry Volume (K Units) Forecast, by Application 2019 & 2032
- Table 83: Rest of South America Smart Gas Meter Industry Revenue (Million) Forecast, by Application 2019 & 2032
- Table 84: Rest of South America Smart Gas Meter Industry Volume (K Units) Forecast, by Application 2019 & 2032
- Table 85: Global Smart Gas Meter Industry Revenue Million Forecast, by Country 2019 & 2032
- Table 86: Global Smart Gas Meter Industry Volume K Units Forecast, by Country 2019 & 2032
- Table 87: United Arab Emirates Smart Gas Meter Industry Revenue (Million) Forecast, by Application 2019 & 2032
- Table 88: United Arab Emirates Smart Gas Meter Industry Volume (K Units) Forecast, by Application 2019 & 2032
- Table 89: Saudi Arabia Smart Gas Meter Industry Revenue (Million) Forecast, by Application 2019 & 2032
- Table 90: Saudi Arabia Smart Gas Meter Industry Volume (K Units) Forecast, by Application 2019 & 2032
- Table 91: South Africa Smart Gas Meter Industry Revenue (Million) Forecast, by Application 2019 & 2032
- Table 92: South Africa Smart Gas Meter Industry Volume (K Units) Forecast, by Application 2019 & 2032
- Table 93: Rest of Middle East and Africa Smart Gas Meter Industry Revenue (Million) Forecast, by Application 2019 & 2032
- Table 94: Rest of Middle East and Africa Smart Gas Meter Industry Volume (K Units) Forecast, by Application 2019 & 2032
- Table 95: Global Smart Gas Meter Industry Revenue Million Forecast, by Devices 2019 & 2032
- Table 96: Global Smart Gas Meter Industry Volume K Units Forecast, by Devices 2019 & 2032
- Table 97: Global Smart Gas Meter Industry Revenue Million Forecast, by Solutions 2019 & 2032
- Table 98: Global Smart Gas Meter Industry Volume K Units Forecast, by Solutions 2019 & 2032
- Table 99: Global Smart Gas Meter Industry Revenue Million Forecast, by Services 2019 & 2032
- Table 100: Global Smart Gas Meter Industry Volume K Units Forecast, by Services 2019 & 2032
- Table 101: Global Smart Gas Meter Industry Revenue Million Forecast, by End-user 2019 & 2032
- Table 102: Global Smart Gas Meter Industry Volume K Units Forecast, by End-user 2019 & 2032
- Table 103: Global Smart Gas Meter Industry Revenue Million Forecast, by Country 2019 & 2032
- Table 104: Global Smart Gas Meter Industry Volume K Units Forecast, by Country 2019 & 2032
- Table 105: Global Smart Gas Meter Industry Revenue Million Forecast, by Devices 2019 & 2032
- Table 106: Global Smart Gas Meter Industry Volume K Units Forecast, by Devices 2019 & 2032
- Table 107: Global Smart Gas Meter Industry Revenue Million Forecast, by Solutions 2019 & 2032
- Table 108: Global Smart Gas Meter Industry Volume K Units Forecast, by Solutions 2019 & 2032
- Table 109: Global Smart Gas Meter Industry Revenue Million Forecast, by Services 2019 & 2032
- Table 110: Global Smart Gas Meter Industry Volume K Units Forecast, by Services 2019 & 2032
- Table 111: Global Smart Gas Meter Industry Revenue Million Forecast, by End-user 2019 & 2032
- Table 112: Global Smart Gas Meter Industry Volume K Units Forecast, by End-user 2019 & 2032
- Table 113: Global Smart Gas Meter Industry Revenue Million Forecast, by Country 2019 & 2032
- Table 114: Global Smart Gas Meter Industry Volume K Units Forecast, by Country 2019 & 2032
- Table 115: Global Smart Gas Meter Industry Revenue Million Forecast, by Devices 2019 & 2032
- Table 116: Global Smart Gas Meter Industry Volume K Units Forecast, by Devices 2019 & 2032
- Table 117: Global Smart Gas Meter Industry Revenue Million Forecast, by Solutions 2019 & 2032
- Table 118: Global Smart Gas Meter Industry Volume K Units Forecast, by Solutions 2019 & 2032
- Table 119: Global Smart Gas Meter Industry Revenue Million Forecast, by Services 2019 & 2032
- Table 120: Global Smart Gas Meter Industry Volume K Units Forecast, by Services 2019 & 2032
- Table 121: Global Smart Gas Meter Industry Revenue Million Forecast, by End-user 2019 & 2032
- Table 122: Global Smart Gas Meter Industry Volume K Units Forecast, by End-user 2019 & 2032
- Table 123: Global Smart Gas Meter Industry Revenue Million Forecast, by Country 2019 & 2032
- Table 124: Global Smart Gas Meter Industry Volume K Units Forecast, by Country 2019 & 2032
- Table 125: Global Smart Gas Meter Industry Revenue Million Forecast, by Devices 2019 & 2032
- Table 126: Global Smart Gas Meter Industry Volume K Units Forecast, by Devices 2019 & 2032
- Table 127: Global Smart Gas Meter Industry Revenue Million Forecast, by Solutions 2019 & 2032
- Table 128: Global Smart Gas Meter Industry Volume K Units Forecast, by Solutions 2019 & 2032
- Table 129: Global Smart Gas Meter Industry Revenue Million Forecast, by Services 2019 & 2032
- Table 130: Global Smart Gas Meter Industry Volume K Units Forecast, by Services 2019 & 2032
- Table 131: Global Smart Gas Meter Industry Revenue Million Forecast, by End-user 2019 & 2032
- Table 132: Global Smart Gas Meter Industry Volume K Units Forecast, by End-user 2019 & 2032
- Table 133: Global Smart Gas Meter Industry Revenue Million Forecast, by Country 2019 & 2032
- Table 134: Global Smart Gas Meter Industry Volume K Units Forecast, by Country 2019 & 2032
- Table 135: Global Smart Gas Meter Industry Revenue Million Forecast, by Devices 2019 & 2032
- Table 136: Global Smart Gas Meter Industry Volume K Units Forecast, by Devices 2019 & 2032
- Table 137: Global Smart Gas Meter Industry Revenue Million Forecast, by Solutions 2019 & 2032
- Table 138: Global Smart Gas Meter Industry Volume K Units Forecast, by Solutions 2019 & 2032
- Table 139: Global Smart Gas Meter Industry Revenue Million Forecast, by Services 2019 & 2032
- Table 140: Global Smart Gas Meter Industry Volume K Units Forecast, by Services 2019 & 2032
- Table 141: Global Smart Gas Meter Industry Revenue Million Forecast, by End-user 2019 & 2032
- Table 142: Global Smart Gas Meter Industry Volume K Units Forecast, by End-user 2019 & 2032
- Table 143: Global Smart Gas Meter Industry Revenue Million Forecast, by Country 2019 & 2032
- Table 144: Global Smart Gas Meter Industry Volume K Units Forecast, by Country 2019 & 2032
Frequently Asked Questions
1. What is the projected Compound Annual Growth Rate (CAGR) of the Smart Gas Meter Industry?
The projected CAGR is approximately 5.80%.
2. Which companies are prominent players in the Smart Gas Meter Industry?
Key companies in the market include Itron Inc, ABB Ltd, Aidon Oy, Schneider Electric SE, Sensus, Elster Group GmbH, Capgemini SA, Aclara Technologies LLC, Oracle Corporation, CGI Inc, Badger Meter, General Electric Company.
3. What are the main segments of the Smart Gas Meter Industry?
The market segments include Devices, Solutions, Services, End-user.
4. Can you provide details about the market size?
The market size is estimated to be USD XX Million as of 2022.
5. What are some drivers contributing to market growth?
Favorable Government Regulations; Need for Reduction Carbon Footprint and Energy Security.
6. What are the notable trends driving market growth?
The Commercial and Industrial Application to Increase Significantly.
7. Are there any restraints impacting market growth?
Irregularities in Data Due to Increased Number of Users; High Capital Expenditure.
8. Can you provide examples of recent developments in the market?
Oct 2022 - Schneider Electric announced a raft of innovations to help the company's businesses, industry, and infrastructure providers, navigate the energy and climate concerns through advanced electrification and digitalization (Electricity 4.0). According to the company, the new solutions are developed to provide organizations with the tools and support they need to strategize, digitize and decarbonize their processes, accelerate sustainability commitments and overcome the energy concern. In addition, the company said they allow the reduction of some of the world's most potent greenhouse gases from energy infrastructures, support the smart grid deployment, and simplify energy management in buildings - thus removing a significant source of energy waste and emissions. The solution launched by the company includes GM AirSeT, EcoStruxure Energy Hub, and Schneider Electric EcoCare.
9. What pricing options are available for accessing the report?
Pricing options include single-user, multi-user, and enterprise licenses priced at USD 4750, USD 5250, and USD 8750 respectively.
10. Is the market size provided in terms of value or volume?
The market size is provided in terms of value, measured in Million and volume, measured in K Units.
11. Are there any specific market keywords associated with the report?
Yes, the market keyword associated with the report is "Smart Gas Meter Industry," which aids in identifying and referencing the specific market segment covered.
12. How do I determine which pricing option suits my needs best?
The pricing options vary based on user requirements and access needs. Individual users may opt for single-user licenses, while businesses requiring broader access may choose multi-user or enterprise licenses for cost-effective access to the report.
13. Are there any additional resources or data provided in the Smart Gas Meter Industry report?
While the report offers comprehensive insights, it's advisable to review the specific contents or supplementary materials provided to ascertain if additional resources or data are available.
14. How can I stay updated on further developments or reports in the Smart Gas Meter Industry?
To stay informed about further developments, trends, and reports in the Smart Gas Meter Industry, consider subscribing to industry newsletters, following relevant companies and organizations, or regularly checking reputable industry news sources and publications.
Methodology
Step 1 - Identification of Relevant Samples Size from Population Database


Step 2 - Approaches for Defining Global Market Size (Value, Volume* & Price*)

Note*: In applicable scenarios
Step 3 - Data Sources
Primary Research
- Web Analytics
- Survey Reports
- Research Institute
- Latest Research Reports
- Opinion Leaders
Secondary Research
- Annual Reports
- White Paper
- Latest Press Release
- Industry Association
- Paid Database
- Investor Presentations

Step 4 - Data Triangulation
Involves using different sources of information in order to increase the validity of a study
These sources are likely to be stakeholders in a program - participants, other researchers, program staff, other community members, and so on.
Then we put all data in single framework & apply various statistical tools to find out the dynamic on the market.
During the analysis stage, feedback from the stakeholder groups would be compared to determine areas of agreement as well as areas of divergence
