

Key Insights
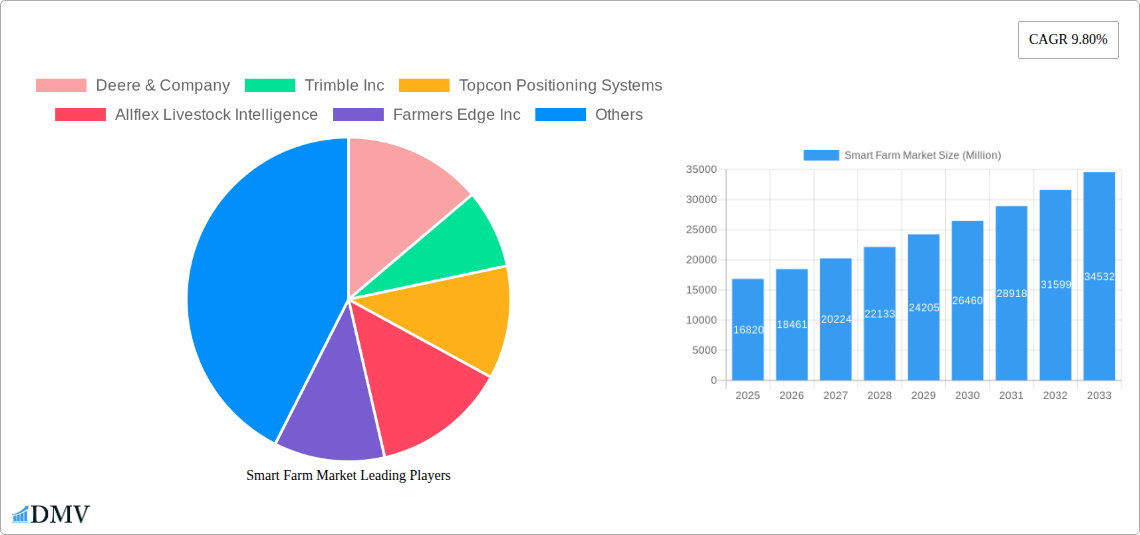
The global smart farm market, valued at $16.82 billion in 2025, is projected to experience robust growth, driven by increasing demand for higher crop yields, efficient resource management, and the need to address global food security challenges. A compound annual growth rate (CAGR) of 9.80% from 2025 to 2033 indicates significant expansion. Key drivers include the rising adoption of precision agriculture technologies like GPS-guided machinery, sensors, and data analytics for optimized irrigation, fertilization, and pest control. Furthermore, advancements in IoT (Internet of Things) devices, artificial intelligence (AI), and machine learning (ML) are enabling farmers to make data-driven decisions, improving operational efficiency and profitability. Government initiatives promoting sustainable agriculture and technological advancements also contribute to market growth. The market is segmented by technology (e.g., precision farming, livestock monitoring, greenhouse management), application (e.g., crop monitoring, livestock management), and geography. Leading players like Deere & Company, Trimble Inc., and Topcon Positioning Systems are driving innovation and market penetration.
Despite the significant growth potential, certain challenges hinder widespread adoption. High initial investment costs for smart farm technologies can be a barrier, particularly for small-scale farmers in developing regions. Concerns about data security and privacy, along with the need for reliable internet connectivity in rural areas, pose significant hurdles. However, these challenges are gradually being addressed through government subsidies, technological advancements making solutions more affordable, and the development of solutions that require less bandwidth. The continued focus on developing user-friendly and cost-effective solutions, along with supportive government policies, is expected to overcome these constraints and further propel market growth in the coming years.
Smart Farm Market: A Comprehensive Market Report (2019-2033)
This insightful report provides a detailed analysis of the Smart Farm Market, projecting a market valuation of $XX Million by 2033. The study period covers 2019-2033, with 2025 as the base and estimated year. It meticulously examines market trends, technological advancements, key players, and future opportunities, offering valuable insights for stakeholders seeking to navigate this dynamic sector. The report leverages extensive data analysis to provide a clear picture of the market's evolution and future potential.
Smart Farm Market Composition & Trends
This section delves into the competitive landscape of the Smart Farm Market, evaluating market concentration, innovation drivers, regulatory frameworks, substitute products, end-user profiles, and mergers & acquisitions (M&A) activities. We analyze market share distribution among key players like Deere & Company, Trimble Inc, and others, revealing a moderately concentrated market with significant opportunities for growth. The report quantifies the impact of M&A activities, estimating a total deal value of $XX Million during the historical period (2019-2024).
- Market Concentration: Moderate, with top 5 players holding approximately XX% market share.
- Innovation Catalysts: AI-powered solutions, IoT integration, and precision agriculture technologies are driving innovation.
- Regulatory Landscape: Varying regulations across different geographies impact market growth.
- Substitute Products: Traditional farming methods pose a competitive threat, though their adoption is declining.
- End-User Profiles: Large-scale commercial farms and medium-sized farms represent significant user segments.
- M&A Activities: Significant M&A activity observed during 2019-2024, with a total deal value estimated at $XX Million, indicating a consolidated market.
Smart Farm Market Industry Evolution
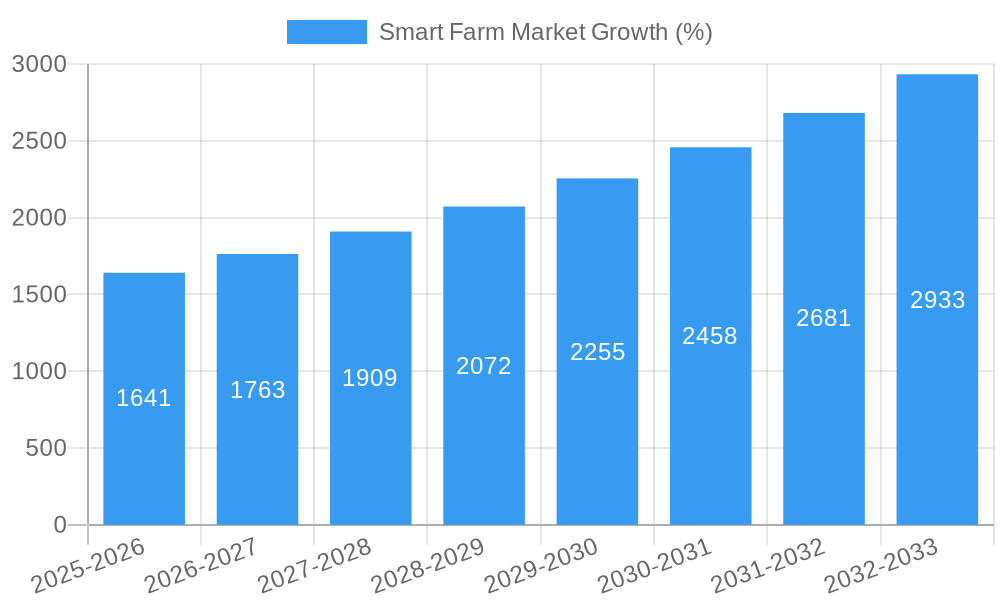
This section provides a comprehensive analysis of the Smart Farm Market's evolution, highlighting market growth trajectories, technological breakthroughs, and shifting consumer demands. From 2019 to 2024, the market experienced a Compound Annual Growth Rate (CAGR) of XX%, driven by increasing adoption of precision agriculture technologies and a growing awareness of sustainable farming practices. We project a CAGR of XX% during the forecast period (2025-2033), with significant growth anticipated in specific segments like greenhouse automation and livestock monitoring. The increasing integration of AI and machine learning is expected to further accelerate growth, enabling more efficient resource management and enhanced crop yields. The market is witnessing a shift towards data-driven decision-making, pushing farmers to adopt advanced technologies and analytics for enhanced productivity. The adoption rate of smart farming technologies is projected to reach XX% by 2033.
Leading Regions, Countries, or Segments in Smart Farm Market
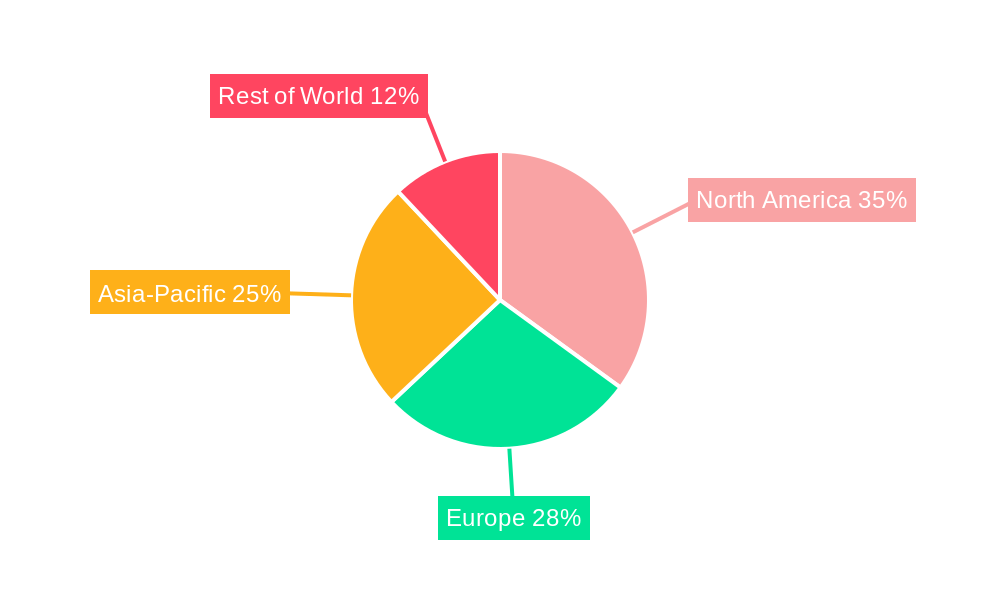
This section identifies the leading regions and segments within the Smart Farm Market. North America currently holds the largest market share, driven by high technological adoption rates, strong government support, and significant investments in agricultural technology. Europe follows closely, with a notable emphasis on sustainable and precision agriculture.
- Key Drivers for North American Dominance:
- High levels of investment in agricultural technology.
- Supportive government policies promoting innovation and technological adoption.
- High penetration of precision agriculture technologies.
- Key Drivers for European Growth:
- Focus on sustainable agriculture and environmentally friendly practices.
- Growing consumer demand for high-quality, sustainably produced food.
- Government initiatives promoting the adoption of smart farming technologies.
The report delves deeper into these factors, examining specific country-level data and their contribution to the overall market growth.
Smart Farm Market Product Innovations
Recent product innovations include AI-powered crop monitoring systems offering real-time insights into plant health and yield optimization, autonomous tractors and harvesters enhancing efficiency, and advanced sensor networks providing comprehensive data on soil conditions, weather patterns, and livestock health. These innovations deliver unique selling propositions such as improved crop yields, reduced resource consumption, and minimized environmental impact.
Propelling Factors for Smart Farm Market Growth
Technological advancements, particularly in AI, IoT, and robotics, are major growth drivers. Economic factors, such as increasing food demand and rising labor costs, are pushing the adoption of automation. Favorable government policies and subsidies are also boosting market expansion.
Obstacles in the Smart Farm Market Market
High initial investment costs, lack of technological awareness among farmers, cybersecurity concerns, and integration complexities represent significant barriers. Supply chain disruptions, especially regarding components essential for smart farm technologies, pose a further constraint on market growth.
Future Opportunities in Smart Farm Market
Expansion into developing economies, the emergence of novel technologies such as blockchain and nanotechnology, and growing consumer demand for traceable and sustainable food products present lucrative opportunities. Vertical farming and precision livestock farming offer substantial growth potential.
Major Players in the Smart Farm Market Ecosystem
- Deere & Company
- Trimble Inc
- Topcon Positioning Systems
- Allflex Livestock Intelligence
- Farmers Edge Inc
- Innovasea Systems Inc
- AgriData Incorporated
- AGCO Corporation
- Gamaya
- IBM Corporation
Key Developments in Smart Farm Market Industry
- January 2024: Deere & Company partnered with SpaceX to provide Starlink satellite communication services to farmers, enhancing access to precision agriculture technologies.
- February 2024: AgriData secured further investment to accelerate the development of its AI-powered crop monitoring technology for greenhouses.
Strategic Smart Farm Market Forecast
The Smart Farm Market is poised for substantial growth, driven by technological advancements, increasing demand for food, and government support for sustainable agriculture. The market's future is bright, with significant potential for innovation and expansion across various regions and segments. The adoption of smart farming technologies will continue to rise, leading to increased efficiency, higher yields, and improved sustainability in the agricultural sector.
Smart Farm Market Segmentation
-
1. Offering
- 1.1. Hardware
- 1.2. Software
- 1.3. Services
-
2. Application
- 2.1. Precision Farming
- 2.2. Livestock Monitoring
- 2.3. Smart Greenhouse
- 2.4. Field Mapping
- 2.5. Farm Labour Management
- 2.6. Others
Smart Farm Market Segmentation By Geography
- 1. North America
- 2. Europe
- 3. Asia
- 4. Australia and New Zealand
- 5. Latin America
- 6. Middle East and Africa
Smart Farm Market REPORT HIGHLIGHTS
| Aspects | Details |
|---|---|
| Study Period | 2019-2033 |
| Base Year | 2024 |
| Estimated Year | 2025 |
| Forecast Period | 2025-2033 |
| Historical Period | 2019-2024 |
| Growth Rate | CAGR of 9.80% from 2019-2033 |
| Segmentation |
|
Table of Contents
- 1. Introduction
- 1.1. Research Scope
- 1.2. Market Segmentation
- 1.3. Research Methodology
- 1.4. Definitions and Assumptions
- 2. Executive Summary
- 2.1. Introduction
- 3. Market Dynamics
- 3.1. Introduction
- 3.2. Market Drivers
- 3.2.1. Increasing Adoption of Advanced Farming Technologies; Rising Government Initiative to Boost the Agriculture Industry in Emerging Economies
- 3.3. Market Restrains
- 3.3.1. Increasing Adoption of Advanced Farming Technologies; Rising Government Initiative to Boost the Agriculture Industry in Emerging Economies
- 3.4. Market Trends
- 3.4.1. Precision Farming is Expected to Hold Major Market Share
- 4. Market Factor Analysis
- 4.1. Porters Five Forces
- 4.2. Supply/Value Chain
- 4.3. PESTEL analysis
- 4.4. Market Entropy
- 4.5. Patent/Trademark Analysis
- 5. Global Smart Farm Market Analysis, Insights and Forecast, 2019-2031
- 5.1. Market Analysis, Insights and Forecast - by Offering
- 5.1.1. Hardware
- 5.1.2. Software
- 5.1.3. Services
- 5.2. Market Analysis, Insights and Forecast - by Application
- 5.2.1. Precision Farming
- 5.2.2. Livestock Monitoring
- 5.2.3. Smart Greenhouse
- 5.2.4. Field Mapping
- 5.2.5. Farm Labour Management
- 5.2.6. Others
- 5.3. Market Analysis, Insights and Forecast - by Region
- 5.3.1. North America
- 5.3.2. Europe
- 5.3.3. Asia
- 5.3.4. Australia and New Zealand
- 5.3.5. Latin America
- 5.3.6. Middle East and Africa
- 5.1. Market Analysis, Insights and Forecast - by Offering
- 6. North America Smart Farm Market Analysis, Insights and Forecast, 2019-2031
- 6.1. Market Analysis, Insights and Forecast - by Offering
- 6.1.1. Hardware
- 6.1.2. Software
- 6.1.3. Services
- 6.2. Market Analysis, Insights and Forecast - by Application
- 6.2.1. Precision Farming
- 6.2.2. Livestock Monitoring
- 6.2.3. Smart Greenhouse
- 6.2.4. Field Mapping
- 6.2.5. Farm Labour Management
- 6.2.6. Others
- 6.1. Market Analysis, Insights and Forecast - by Offering
- 7. Europe Smart Farm Market Analysis, Insights and Forecast, 2019-2031
- 7.1. Market Analysis, Insights and Forecast - by Offering
- 7.1.1. Hardware
- 7.1.2. Software
- 7.1.3. Services
- 7.2. Market Analysis, Insights and Forecast - by Application
- 7.2.1. Precision Farming
- 7.2.2. Livestock Monitoring
- 7.2.3. Smart Greenhouse
- 7.2.4. Field Mapping
- 7.2.5. Farm Labour Management
- 7.2.6. Others
- 7.1. Market Analysis, Insights and Forecast - by Offering
- 8. Asia Smart Farm Market Analysis, Insights and Forecast, 2019-2031
- 8.1. Market Analysis, Insights and Forecast - by Offering
- 8.1.1. Hardware
- 8.1.2. Software
- 8.1.3. Services
- 8.2. Market Analysis, Insights and Forecast - by Application
- 8.2.1. Precision Farming
- 8.2.2. Livestock Monitoring
- 8.2.3. Smart Greenhouse
- 8.2.4. Field Mapping
- 8.2.5. Farm Labour Management
- 8.2.6. Others
- 8.1. Market Analysis, Insights and Forecast - by Offering
- 9. Australia and New Zealand Smart Farm Market Analysis, Insights and Forecast, 2019-2031
- 9.1. Market Analysis, Insights and Forecast - by Offering
- 9.1.1. Hardware
- 9.1.2. Software
- 9.1.3. Services
- 9.2. Market Analysis, Insights and Forecast - by Application
- 9.2.1. Precision Farming
- 9.2.2. Livestock Monitoring
- 9.2.3. Smart Greenhouse
- 9.2.4. Field Mapping
- 9.2.5. Farm Labour Management
- 9.2.6. Others
- 9.1. Market Analysis, Insights and Forecast - by Offering
- 10. Latin America Smart Farm Market Analysis, Insights and Forecast, 2019-2031
- 10.1. Market Analysis, Insights and Forecast - by Offering
- 10.1.1. Hardware
- 10.1.2. Software
- 10.1.3. Services
- 10.2. Market Analysis, Insights and Forecast - by Application
- 10.2.1. Precision Farming
- 10.2.2. Livestock Monitoring
- 10.2.3. Smart Greenhouse
- 10.2.4. Field Mapping
- 10.2.5. Farm Labour Management
- 10.2.6. Others
- 10.1. Market Analysis, Insights and Forecast - by Offering
- 11. Middle East and Africa Smart Farm Market Analysis, Insights and Forecast, 2019-2031
- 11.1. Market Analysis, Insights and Forecast - by Offering
- 11.1.1. Hardware
- 11.1.2. Software
- 11.1.3. Services
- 11.2. Market Analysis, Insights and Forecast - by Application
- 11.2.1. Precision Farming
- 11.2.2. Livestock Monitoring
- 11.2.3. Smart Greenhouse
- 11.2.4. Field Mapping
- 11.2.5. Farm Labour Management
- 11.2.6. Others
- 11.1. Market Analysis, Insights and Forecast - by Offering
- 12. Competitive Analysis
- 12.1. Global Market Share Analysis 2024
- 12.2. Company Profiles
- 12.2.1 Deere & Company
- 12.2.1.1. Overview
- 12.2.1.2. Products
- 12.2.1.3. SWOT Analysis
- 12.2.1.4. Recent Developments
- 12.2.1.5. Financials (Based on Availability)
- 12.2.2 Trimble Inc
- 12.2.2.1. Overview
- 12.2.2.2. Products
- 12.2.2.3. SWOT Analysis
- 12.2.2.4. Recent Developments
- 12.2.2.5. Financials (Based on Availability)
- 12.2.3 Topcon Positioning Systems
- 12.2.3.1. Overview
- 12.2.3.2. Products
- 12.2.3.3. SWOT Analysis
- 12.2.3.4. Recent Developments
- 12.2.3.5. Financials (Based on Availability)
- 12.2.4 Allflex Livestock Intelligence
- 12.2.4.1. Overview
- 12.2.4.2. Products
- 12.2.4.3. SWOT Analysis
- 12.2.4.4. Recent Developments
- 12.2.4.5. Financials (Based on Availability)
- 12.2.5 Farmers Edge Inc
- 12.2.5.1. Overview
- 12.2.5.2. Products
- 12.2.5.3. SWOT Analysis
- 12.2.5.4. Recent Developments
- 12.2.5.5. Financials (Based on Availability)
- 12.2.6 Innovasea Systems Inc
- 12.2.6.1. Overview
- 12.2.6.2. Products
- 12.2.6.3. SWOT Analysis
- 12.2.6.4. Recent Developments
- 12.2.6.5. Financials (Based on Availability)
- 12.2.7 AgriData Incorporated
- 12.2.7.1. Overview
- 12.2.7.2. Products
- 12.2.7.3. SWOT Analysis
- 12.2.7.4. Recent Developments
- 12.2.7.5. Financials (Based on Availability)
- 12.2.8 AGCO Corporation
- 12.2.8.1. Overview
- 12.2.8.2. Products
- 12.2.8.3. SWOT Analysis
- 12.2.8.4. Recent Developments
- 12.2.8.5. Financials (Based on Availability)
- 12.2.9 Gamaya
- 12.2.9.1. Overview
- 12.2.9.2. Products
- 12.2.9.3. SWOT Analysis
- 12.2.9.4. Recent Developments
- 12.2.9.5. Financials (Based on Availability)
- 12.2.10 IBM Corporatio
- 12.2.10.1. Overview
- 12.2.10.2. Products
- 12.2.10.3. SWOT Analysis
- 12.2.10.4. Recent Developments
- 12.2.10.5. Financials (Based on Availability)
- 12.2.1 Deere & Company
List of Figures
- Figure 1: Global Smart Farm Market Revenue Breakdown (Million, %) by Region 2024 & 2032
- Figure 2: Global Smart Farm Market Volume Breakdown (Billion, %) by Region 2024 & 2032
- Figure 3: North America Smart Farm Market Revenue (Million), by Offering 2024 & 2032
- Figure 4: North America Smart Farm Market Volume (Billion), by Offering 2024 & 2032
- Figure 5: North America Smart Farm Market Revenue Share (%), by Offering 2024 & 2032
- Figure 6: North America Smart Farm Market Volume Share (%), by Offering 2024 & 2032
- Figure 7: North America Smart Farm Market Revenue (Million), by Application 2024 & 2032
- Figure 8: North America Smart Farm Market Volume (Billion), by Application 2024 & 2032
- Figure 9: North America Smart Farm Market Revenue Share (%), by Application 2024 & 2032
- Figure 10: North America Smart Farm Market Volume Share (%), by Application 2024 & 2032
- Figure 11: North America Smart Farm Market Revenue (Million), by Country 2024 & 2032
- Figure 12: North America Smart Farm Market Volume (Billion), by Country 2024 & 2032
- Figure 13: North America Smart Farm Market Revenue Share (%), by Country 2024 & 2032
- Figure 14: North America Smart Farm Market Volume Share (%), by Country 2024 & 2032
- Figure 15: Europe Smart Farm Market Revenue (Million), by Offering 2024 & 2032
- Figure 16: Europe Smart Farm Market Volume (Billion), by Offering 2024 & 2032
- Figure 17: Europe Smart Farm Market Revenue Share (%), by Offering 2024 & 2032
- Figure 18: Europe Smart Farm Market Volume Share (%), by Offering 2024 & 2032
- Figure 19: Europe Smart Farm Market Revenue (Million), by Application 2024 & 2032
- Figure 20: Europe Smart Farm Market Volume (Billion), by Application 2024 & 2032
- Figure 21: Europe Smart Farm Market Revenue Share (%), by Application 2024 & 2032
- Figure 22: Europe Smart Farm Market Volume Share (%), by Application 2024 & 2032
- Figure 23: Europe Smart Farm Market Revenue (Million), by Country 2024 & 2032
- Figure 24: Europe Smart Farm Market Volume (Billion), by Country 2024 & 2032
- Figure 25: Europe Smart Farm Market Revenue Share (%), by Country 2024 & 2032
- Figure 26: Europe Smart Farm Market Volume Share (%), by Country 2024 & 2032
- Figure 27: Asia Smart Farm Market Revenue (Million), by Offering 2024 & 2032
- Figure 28: Asia Smart Farm Market Volume (Billion), by Offering 2024 & 2032
- Figure 29: Asia Smart Farm Market Revenue Share (%), by Offering 2024 & 2032
- Figure 30: Asia Smart Farm Market Volume Share (%), by Offering 2024 & 2032
- Figure 31: Asia Smart Farm Market Revenue (Million), by Application 2024 & 2032
- Figure 32: Asia Smart Farm Market Volume (Billion), by Application 2024 & 2032
- Figure 33: Asia Smart Farm Market Revenue Share (%), by Application 2024 & 2032
- Figure 34: Asia Smart Farm Market Volume Share (%), by Application 2024 & 2032
- Figure 35: Asia Smart Farm Market Revenue (Million), by Country 2024 & 2032
- Figure 36: Asia Smart Farm Market Volume (Billion), by Country 2024 & 2032
- Figure 37: Asia Smart Farm Market Revenue Share (%), by Country 2024 & 2032
- Figure 38: Asia Smart Farm Market Volume Share (%), by Country 2024 & 2032
- Figure 39: Australia and New Zealand Smart Farm Market Revenue (Million), by Offering 2024 & 2032
- Figure 40: Australia and New Zealand Smart Farm Market Volume (Billion), by Offering 2024 & 2032
- Figure 41: Australia and New Zealand Smart Farm Market Revenue Share (%), by Offering 2024 & 2032
- Figure 42: Australia and New Zealand Smart Farm Market Volume Share (%), by Offering 2024 & 2032
- Figure 43: Australia and New Zealand Smart Farm Market Revenue (Million), by Application 2024 & 2032
- Figure 44: Australia and New Zealand Smart Farm Market Volume (Billion), by Application 2024 & 2032
- Figure 45: Australia and New Zealand Smart Farm Market Revenue Share (%), by Application 2024 & 2032
- Figure 46: Australia and New Zealand Smart Farm Market Volume Share (%), by Application 2024 & 2032
- Figure 47: Australia and New Zealand Smart Farm Market Revenue (Million), by Country 2024 & 2032
- Figure 48: Australia and New Zealand Smart Farm Market Volume (Billion), by Country 2024 & 2032
- Figure 49: Australia and New Zealand Smart Farm Market Revenue Share (%), by Country 2024 & 2032
- Figure 50: Australia and New Zealand Smart Farm Market Volume Share (%), by Country 2024 & 2032
- Figure 51: Latin America Smart Farm Market Revenue (Million), by Offering 2024 & 2032
- Figure 52: Latin America Smart Farm Market Volume (Billion), by Offering 2024 & 2032
- Figure 53: Latin America Smart Farm Market Revenue Share (%), by Offering 2024 & 2032
- Figure 54: Latin America Smart Farm Market Volume Share (%), by Offering 2024 & 2032
- Figure 55: Latin America Smart Farm Market Revenue (Million), by Application 2024 & 2032
- Figure 56: Latin America Smart Farm Market Volume (Billion), by Application 2024 & 2032
- Figure 57: Latin America Smart Farm Market Revenue Share (%), by Application 2024 & 2032
- Figure 58: Latin America Smart Farm Market Volume Share (%), by Application 2024 & 2032
- Figure 59: Latin America Smart Farm Market Revenue (Million), by Country 2024 & 2032
- Figure 60: Latin America Smart Farm Market Volume (Billion), by Country 2024 & 2032
- Figure 61: Latin America Smart Farm Market Revenue Share (%), by Country 2024 & 2032
- Figure 62: Latin America Smart Farm Market Volume Share (%), by Country 2024 & 2032
- Figure 63: Middle East and Africa Smart Farm Market Revenue (Million), by Offering 2024 & 2032
- Figure 64: Middle East and Africa Smart Farm Market Volume (Billion), by Offering 2024 & 2032
- Figure 65: Middle East and Africa Smart Farm Market Revenue Share (%), by Offering 2024 & 2032
- Figure 66: Middle East and Africa Smart Farm Market Volume Share (%), by Offering 2024 & 2032
- Figure 67: Middle East and Africa Smart Farm Market Revenue (Million), by Application 2024 & 2032
- Figure 68: Middle East and Africa Smart Farm Market Volume (Billion), by Application 2024 & 2032
- Figure 69: Middle East and Africa Smart Farm Market Revenue Share (%), by Application 2024 & 2032
- Figure 70: Middle East and Africa Smart Farm Market Volume Share (%), by Application 2024 & 2032
- Figure 71: Middle East and Africa Smart Farm Market Revenue (Million), by Country 2024 & 2032
- Figure 72: Middle East and Africa Smart Farm Market Volume (Billion), by Country 2024 & 2032
- Figure 73: Middle East and Africa Smart Farm Market Revenue Share (%), by Country 2024 & 2032
- Figure 74: Middle East and Africa Smart Farm Market Volume Share (%), by Country 2024 & 2032
List of Tables
- Table 1: Global Smart Farm Market Revenue Million Forecast, by Region 2019 & 2032
- Table 2: Global Smart Farm Market Volume Billion Forecast, by Region 2019 & 2032
- Table 3: Global Smart Farm Market Revenue Million Forecast, by Offering 2019 & 2032
- Table 4: Global Smart Farm Market Volume Billion Forecast, by Offering 2019 & 2032
- Table 5: Global Smart Farm Market Revenue Million Forecast, by Application 2019 & 2032
- Table 6: Global Smart Farm Market Volume Billion Forecast, by Application 2019 & 2032
- Table 7: Global Smart Farm Market Revenue Million Forecast, by Region 2019 & 2032
- Table 8: Global Smart Farm Market Volume Billion Forecast, by Region 2019 & 2032
- Table 9: Global Smart Farm Market Revenue Million Forecast, by Offering 2019 & 2032
- Table 10: Global Smart Farm Market Volume Billion Forecast, by Offering 2019 & 2032
- Table 11: Global Smart Farm Market Revenue Million Forecast, by Application 2019 & 2032
- Table 12: Global Smart Farm Market Volume Billion Forecast, by Application 2019 & 2032
- Table 13: Global Smart Farm Market Revenue Million Forecast, by Country 2019 & 2032
- Table 14: Global Smart Farm Market Volume Billion Forecast, by Country 2019 & 2032
- Table 15: Global Smart Farm Market Revenue Million Forecast, by Offering 2019 & 2032
- Table 16: Global Smart Farm Market Volume Billion Forecast, by Offering 2019 & 2032
- Table 17: Global Smart Farm Market Revenue Million Forecast, by Application 2019 & 2032
- Table 18: Global Smart Farm Market Volume Billion Forecast, by Application 2019 & 2032
- Table 19: Global Smart Farm Market Revenue Million Forecast, by Country 2019 & 2032
- Table 20: Global Smart Farm Market Volume Billion Forecast, by Country 2019 & 2032
- Table 21: Global Smart Farm Market Revenue Million Forecast, by Offering 2019 & 2032
- Table 22: Global Smart Farm Market Volume Billion Forecast, by Offering 2019 & 2032
- Table 23: Global Smart Farm Market Revenue Million Forecast, by Application 2019 & 2032
- Table 24: Global Smart Farm Market Volume Billion Forecast, by Application 2019 & 2032
- Table 25: Global Smart Farm Market Revenue Million Forecast, by Country 2019 & 2032
- Table 26: Global Smart Farm Market Volume Billion Forecast, by Country 2019 & 2032
- Table 27: Global Smart Farm Market Revenue Million Forecast, by Offering 2019 & 2032
- Table 28: Global Smart Farm Market Volume Billion Forecast, by Offering 2019 & 2032
- Table 29: Global Smart Farm Market Revenue Million Forecast, by Application 2019 & 2032
- Table 30: Global Smart Farm Market Volume Billion Forecast, by Application 2019 & 2032
- Table 31: Global Smart Farm Market Revenue Million Forecast, by Country 2019 & 2032
- Table 32: Global Smart Farm Market Volume Billion Forecast, by Country 2019 & 2032
- Table 33: Global Smart Farm Market Revenue Million Forecast, by Offering 2019 & 2032
- Table 34: Global Smart Farm Market Volume Billion Forecast, by Offering 2019 & 2032
- Table 35: Global Smart Farm Market Revenue Million Forecast, by Application 2019 & 2032
- Table 36: Global Smart Farm Market Volume Billion Forecast, by Application 2019 & 2032
- Table 37: Global Smart Farm Market Revenue Million Forecast, by Country 2019 & 2032
- Table 38: Global Smart Farm Market Volume Billion Forecast, by Country 2019 & 2032
- Table 39: Global Smart Farm Market Revenue Million Forecast, by Offering 2019 & 2032
- Table 40: Global Smart Farm Market Volume Billion Forecast, by Offering 2019 & 2032
- Table 41: Global Smart Farm Market Revenue Million Forecast, by Application 2019 & 2032
- Table 42: Global Smart Farm Market Volume Billion Forecast, by Application 2019 & 2032
- Table 43: Global Smart Farm Market Revenue Million Forecast, by Country 2019 & 2032
- Table 44: Global Smart Farm Market Volume Billion Forecast, by Country 2019 & 2032
Frequently Asked Questions
1. What is the projected Compound Annual Growth Rate (CAGR) of the Smart Farm Market?
The projected CAGR is approximately 9.80%.
2. Which companies are prominent players in the Smart Farm Market?
Key companies in the market include Deere & Company, Trimble Inc, Topcon Positioning Systems, Allflex Livestock Intelligence, Farmers Edge Inc, Innovasea Systems Inc, AgriData Incorporated, AGCO Corporation, Gamaya, IBM Corporatio.
3. What are the main segments of the Smart Farm Market?
The market segments include Offering, Application.
4. Can you provide details about the market size?
The market size is estimated to be USD 16.82 Million as of 2022.
5. What are some drivers contributing to market growth?
Increasing Adoption of Advanced Farming Technologies; Rising Government Initiative to Boost the Agriculture Industry in Emerging Economies.
6. What are the notable trends driving market growth?
Precision Farming is Expected to Hold Major Market Share.
7. Are there any restraints impacting market growth?
Increasing Adoption of Advanced Farming Technologies; Rising Government Initiative to Boost the Agriculture Industry in Emerging Economies.
8. Can you provide examples of recent developments in the market?
February 2024 - AgriData revealed that its innovative solutions improve agricultural practices for growers by utilizing AI-powered crop monitoring technology specifically tailored for greenhouses. The company obtained further investment from its existing investors. This influx of capital enables the company to accelerate its market’s growth and enhance the development of its camera systems and computer vision software.
9. What pricing options are available for accessing the report?
Pricing options include single-user, multi-user, and enterprise licenses priced at USD 4750, USD 5250, and USD 8750 respectively.
10. Is the market size provided in terms of value or volume?
The market size is provided in terms of value, measured in Million and volume, measured in Billion.
11. Are there any specific market keywords associated with the report?
Yes, the market keyword associated with the report is "Smart Farm Market," which aids in identifying and referencing the specific market segment covered.
12. How do I determine which pricing option suits my needs best?
The pricing options vary based on user requirements and access needs. Individual users may opt for single-user licenses, while businesses requiring broader access may choose multi-user or enterprise licenses for cost-effective access to the report.
13. Are there any additional resources or data provided in the Smart Farm Market report?
While the report offers comprehensive insights, it's advisable to review the specific contents or supplementary materials provided to ascertain if additional resources or data are available.
14. How can I stay updated on further developments or reports in the Smart Farm Market?
To stay informed about further developments, trends, and reports in the Smart Farm Market, consider subscribing to industry newsletters, following relevant companies and organizations, or regularly checking reputable industry news sources and publications.
Methodology
Step 1 - Identification of Relevant Samples Size from Population Database


Step 2 - Approaches for Defining Global Market Size (Value, Volume* & Price*)

Note*: In applicable scenarios
Step 3 - Data Sources
Primary Research
- Web Analytics
- Survey Reports
- Research Institute
- Latest Research Reports
- Opinion Leaders
Secondary Research
- Annual Reports
- White Paper
- Latest Press Release
- Industry Association
- Paid Database
- Investor Presentations

Step 4 - Data Triangulation
Involves using different sources of information in order to increase the validity of a study
These sources are likely to be stakeholders in a program - participants, other researchers, program staff, other community members, and so on.
Then we put all data in single framework & apply various statistical tools to find out the dynamic on the market.
During the analysis stage, feedback from the stakeholder groups would be compared to determine areas of agreement as well as areas of divergence
