

Key Insights
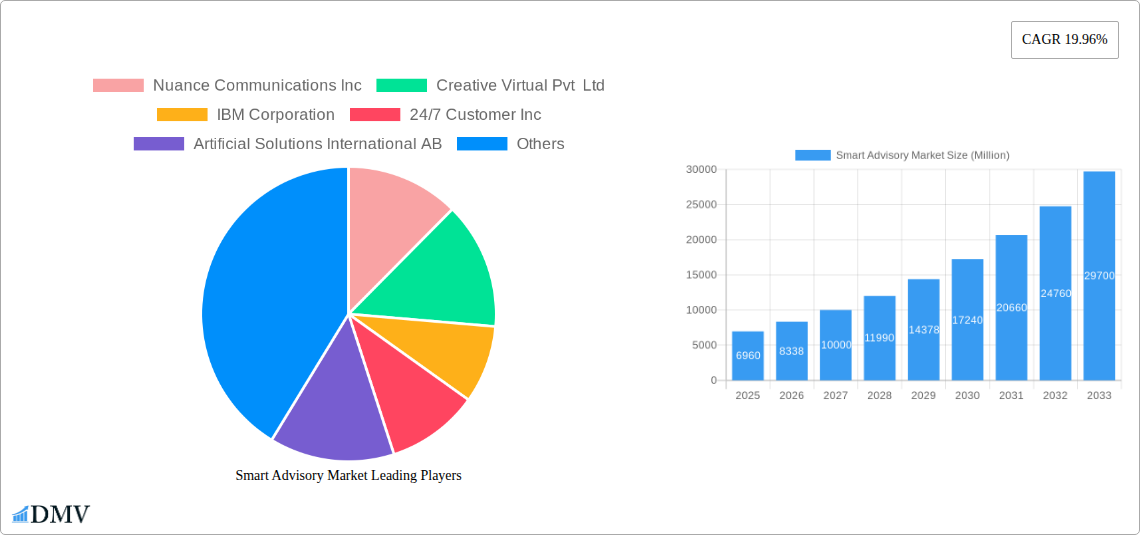
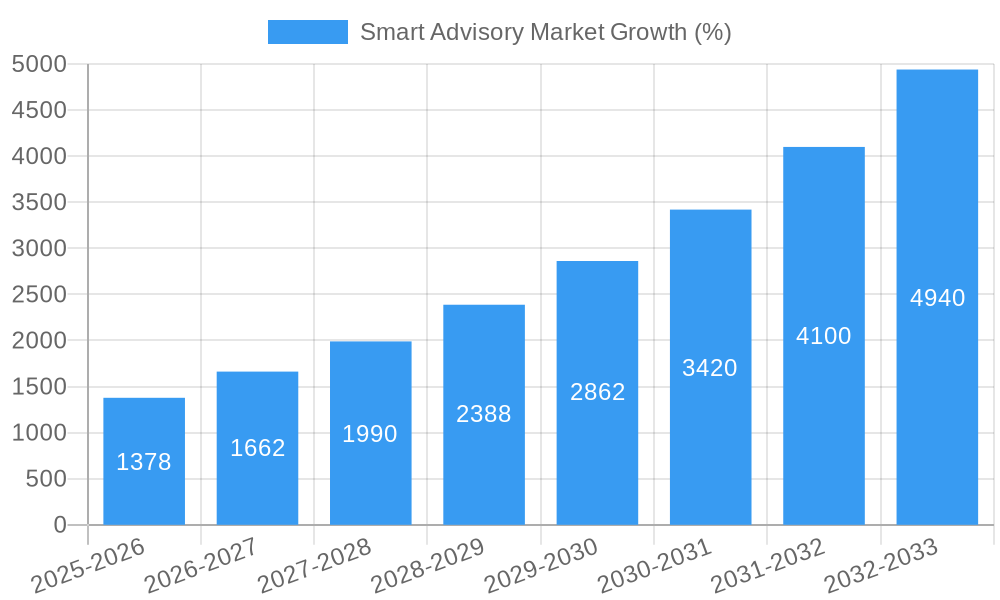
The global smart advisory market is experiencing robust growth, projected to reach \$6.96 billion in 2025 and exhibiting a Compound Annual Growth Rate (CAGR) of 19.96% from 2025 to 2033. This expansion is driven by several key factors. Increasing adoption of AI-powered solutions across diverse sectors like BFSI (Banking, Financial Services, and Insurance), retail, and travel & hospitality is a significant catalyst. Businesses are increasingly leveraging smart advisory systems to enhance customer experience, personalize services, and automate complex decision-making processes. Furthermore, the rising need for improved operational efficiency, cost reduction, and the ability to handle large volumes of data are fueling market growth. Government initiatives promoting digital transformation and technological advancements are also contributing factors. The market is segmented by offerings (software and services) and end-user verticals, with BFSI currently dominating due to its high reliance on data-driven insights and personalized financial advice. However, growth is anticipated across all verticals as businesses recognize the value proposition of smart advisory technologies.
The competitive landscape is characterized by a mix of established players like IBM and Nuance Communications and emerging technology providers. Intense competition is driving innovation and pushing companies to offer more advanced and sophisticated solutions. While the market faces challenges such as high initial investment costs and concerns regarding data security and privacy, these obstacles are being mitigated by technological advancements and the increasing affordability of AI solutions. The market is poised for continued growth, driven by the ongoing digital transformation across various industries and the increasing demand for personalized and efficient advisory services. The expansion into newer sectors, such as healthcare and consumer electronics, presents lucrative opportunities for future market growth.
Smart Advisory Market Report: 2019-2033 Forecast
This comprehensive report provides a detailed analysis of the Smart Advisory Market, projecting a robust growth trajectory from 2019 to 2033. Valued at xx Million in 2025 (Base Year), the market is poised for significant expansion, reaching xx Million by 2033. This in-depth study covers market segmentation, competitive landscape, technological advancements, and key growth drivers, offering invaluable insights for stakeholders across the value chain.
Smart Advisory Market Composition & Trends
The Smart Advisory Market is characterized by moderate concentration, with several key players vying for market share. Innovation is driven by advancements in AI, machine learning, and natural language processing, enabling more sophisticated and personalized advisory services. Regulatory landscapes vary significantly across regions, impacting market access and operational compliance. Substitute products, such as traditional advisory services, continue to exist but face growing competition from the efficiency and scalability of smart advisory solutions. End-user profiles are diverse, ranging from individual investors to large financial institutions. M&A activity is noteworthy, with deals focusing on technology integration and expansion into new markets. For example, the total M&A deal value in 2024 reached xx Million.
- Market Share Distribution (2024): The top five players commanded approximately xx% of the market, with a relatively fragmented landscape among smaller players.
- M&A Deal Values (2019-2024): Total M&A deal value exceeded xx Million, reflecting the strategic importance of consolidating market share and enhancing technological capabilities.
Smart Advisory Market Industry Evolution
The Smart Advisory Market has experienced significant growth throughout the historical period (2019-2024), driven by several factors. The increasing adoption of digital technologies across various sectors and the growing demand for personalized financial and business advice has fuelled market expansion. The compound annual growth rate (CAGR) during the historical period was approximately xx%, indicating consistent and rapid growth. Technological advancements such as AI-powered chatbots, predictive analytics, and automated investment platforms are transforming the delivery of advisory services, enhancing efficiency and accessibility. Shifting consumer demands, particularly the preference for personalized and data-driven solutions, further bolster market growth. The forecast period (2025-2033) projects a continuation of this growth trajectory, with adoption metrics such as the number of users and transactions expected to increase significantly, further propelled by the entry of new players and innovative offerings. By 2033, we anticipate a CAGR of approximately xx%, surpassing xx Million in market value.
Leading Regions, Countries, or Segments in Smart Advisory Market
The BFSI (Banking, Financial Services, and Insurance) segment remains the dominant end-user vertical in the Smart Advisory Market, driven by the substantial need for efficient risk management, personalized investment solutions, and regulatory compliance support. Geographically, North America and Europe currently hold significant market share.
Key Drivers for BFSI Dominance:
- Heavy investment in digital transformation initiatives.
- Stringent regulatory requirements mandating advanced risk management tools.
- Rising demand for personalized wealth management and investment advice.
- Increasing adoption of AI-powered fraud detection and prevention systems.
Other Segments: Retail, travel and hospitality, and government sectors are also exhibiting substantial growth potential, driven by the rising need for data-driven decision-making and enhanced customer experience. The Software segment holds a larger market share compared to Services, reflecting the increasing preference for scalable and cost-effective solutions. However, the Services segment is expected to witness faster growth due to the rising demand for customized consulting services.
Smart Advisory Market Product Innovations
Recent innovations include AI-powered robo-advisors capable of providing personalized investment recommendations, chatbots offering 24/7 customer support, and sophisticated analytics dashboards providing real-time market insights. These products boast unique selling propositions such as enhanced efficiency, cost-effectiveness, and personalized service delivery, driven by advancements in machine learning and natural language processing. The improved accuracy and reduced human error associated with these technologies are driving their wider adoption and fueling market expansion.
Propelling Factors for Smart Advisory Market Growth
Technological advancements, particularly in AI and machine learning, are the primary growth drivers. The increasing adoption of cloud-based solutions is enhancing scalability and accessibility. Economic factors, such as rising disposable incomes and the desire for optimized financial portfolios, are also contributing to market growth. Finally, supportive government policies and regulations promoting financial inclusion and digitalization are further enhancing the market’s trajectory.
Obstacles in the Smart Advisory Market
Data security and privacy concerns pose significant challenges, alongside the complexity of integrating different systems and platforms. Regulatory hurdles vary widely across regions, and the cost of implementation and maintenance can be substantial. Furthermore, the highly competitive landscape necessitates constant innovation and adaptation to retain market share. These factors can create significant restraints for smaller players and overall market growth.
Future Opportunities in Smart Advisory Market
Expansion into emerging markets, such as Africa and parts of Asia, presents significant opportunities. The integration of blockchain technology for enhanced security and transparency, along with the development of specialized solutions for niche markets (e.g., sustainable investing) offers exciting growth avenues. Furthermore, advancements in human-computer interaction, such as natural language processing, will drive wider adoption and improve user experience.
Major Players in the Smart Advisory Market Ecosystem
- Nuance Communications Inc
- Creative Virtual Pvt Ltd
- IBM Corporation
- 24/7 Customer Inc
- Artificial Solutions International AB
- Codebaby Corporation
- eGain Corporation
- Next IT Corporation
- CX Company Limited
- Speakoit Inc
Key Developments in Smart Advisory Market Industry
- November 2023: Nasdaq launches Fundsight, a free online platform for financial advisors, enhancing access to fund discovery and research tools.
- December 2022: Waterfield Advisors expands its reach internationally through a collaboration with Singapore Airlines.
- October 2022: Wazir Advisor partners with ITA Germany, bringing advanced advisory services to the Indian textile industry.
Strategic Smart Advisory Market Forecast
The Smart Advisory Market is poised for continued growth, driven by technological advancements, increasing demand for personalized solutions, and supportive regulatory environments. The expanding adoption of AI-powered tools, coupled with the rise of FinTech, will create substantial opportunities across diverse sectors. The market is expected to witness sustained expansion throughout the forecast period, making it a lucrative space for both established players and new entrants.
Smart Advisory Market Segmentation
-
1. Offerings
- 1.1. Software
- 1.2. Services
-
2. End-user Verticals
- 2.1. BFSI
- 2.2. Retail
- 2.3. Travel and Hospitality
- 2.4. Government
- 2.5. Other En
Smart Advisory Market Segmentation By Geography
- 1. North America
- 2. Europe
- 3. Asia Pacific
- 4. Rest of the World
Smart Advisory Market REPORT HIGHLIGHTS
| Aspects | Details |
|---|---|
| Study Period | 2019-2033 |
| Base Year | 2024 |
| Estimated Year | 2025 |
| Forecast Period | 2025-2033 |
| Historical Period | 2019-2024 |
| Growth Rate | CAGR of 19.96% from 2019-2033 |
| Segmentation |
|
Table of Contents
- 1. Introduction
- 1.1. Research Scope
- 1.2. Market Segmentation
- 1.3. Research Methodology
- 1.4. Definitions and Assumptions
- 2. Executive Summary
- 2.1. Introduction
- 3. Market Dynamics
- 3.1. Introduction
- 3.2. Market Drivers
- 3.2.1. Burgeoning Demand for Intelligent Customer Engagement; Demand for Automation for Cost Management in the Healthcare; Increasing Penetration of Websites and Mobile Applications Integrated with Cloud Computing
- 3.3. Market Restrains
- 3.3.1. Lack of Awareness and Information and Availability as add-in Under Analytics
- 3.4. Market Trends
- 3.4.1. The Retail Segment is Expected to Witness Significant Adoption for Smart Advisor Solutions.
- 4. Market Factor Analysis
- 4.1. Porters Five Forces
- 4.2. Supply/Value Chain
- 4.3. PESTEL analysis
- 4.4. Market Entropy
- 4.5. Patent/Trademark Analysis
- 5. Global Smart Advisory Market Analysis, Insights and Forecast, 2019-2031
- 5.1. Market Analysis, Insights and Forecast - by Offerings
- 5.1.1. Software
- 5.1.2. Services
- 5.2. Market Analysis, Insights and Forecast - by End-user Verticals
- 5.2.1. BFSI
- 5.2.2. Retail
- 5.2.3. Travel and Hospitality
- 5.2.4. Government
- 5.2.5. Other En
- 5.3. Market Analysis, Insights and Forecast - by Region
- 5.3.1. North America
- 5.3.2. Europe
- 5.3.3. Asia Pacific
- 5.3.4. Rest of the World
- 5.1. Market Analysis, Insights and Forecast - by Offerings
- 6. North America Smart Advisory Market Analysis, Insights and Forecast, 2019-2031
- 6.1. Market Analysis, Insights and Forecast - by Offerings
- 6.1.1. Software
- 6.1.2. Services
- 6.2. Market Analysis, Insights and Forecast - by End-user Verticals
- 6.2.1. BFSI
- 6.2.2. Retail
- 6.2.3. Travel and Hospitality
- 6.2.4. Government
- 6.2.5. Other En
- 6.1. Market Analysis, Insights and Forecast - by Offerings
- 7. Europe Smart Advisory Market Analysis, Insights and Forecast, 2019-2031
- 7.1. Market Analysis, Insights and Forecast - by Offerings
- 7.1.1. Software
- 7.1.2. Services
- 7.2. Market Analysis, Insights and Forecast - by End-user Verticals
- 7.2.1. BFSI
- 7.2.2. Retail
- 7.2.3. Travel and Hospitality
- 7.2.4. Government
- 7.2.5. Other En
- 7.1. Market Analysis, Insights and Forecast - by Offerings
- 8. Asia Pacific Smart Advisory Market Analysis, Insights and Forecast, 2019-2031
- 8.1. Market Analysis, Insights and Forecast - by Offerings
- 8.1.1. Software
- 8.1.2. Services
- 8.2. Market Analysis, Insights and Forecast - by End-user Verticals
- 8.2.1. BFSI
- 8.2.2. Retail
- 8.2.3. Travel and Hospitality
- 8.2.4. Government
- 8.2.5. Other En
- 8.1. Market Analysis, Insights and Forecast - by Offerings
- 9. Rest of the World Smart Advisory Market Analysis, Insights and Forecast, 2019-2031
- 9.1. Market Analysis, Insights and Forecast - by Offerings
- 9.1.1. Software
- 9.1.2. Services
- 9.2. Market Analysis, Insights and Forecast - by End-user Verticals
- 9.2.1. BFSI
- 9.2.2. Retail
- 9.2.3. Travel and Hospitality
- 9.2.4. Government
- 9.2.5. Other En
- 9.1. Market Analysis, Insights and Forecast - by Offerings
- 10. North America Smart Advisory Market Analysis, Insights and Forecast, 2019-2031
- 10.1. Market Analysis, Insights and Forecast - By Country/Sub-region
- 10.1.1.
- 11. Europe Smart Advisory Market Analysis, Insights and Forecast, 2019-2031
- 11.1. Market Analysis, Insights and Forecast - By Country/Sub-region
- 11.1.1.
- 12. Asia Pacific Smart Advisory Market Analysis, Insights and Forecast, 2019-2031
- 12.1. Market Analysis, Insights and Forecast - By Country/Sub-region
- 12.1.1.
- 13. Rest of the World Smart Advisory Market Analysis, Insights and Forecast, 2019-2031
- 13.1. Market Analysis, Insights and Forecast - By Country/Sub-region
- 13.1.1.
- 14. Competitive Analysis
- 14.1. Global Market Share Analysis 2024
- 14.2. Company Profiles
- 14.2.1 Nuance Communications Inc
- 14.2.1.1. Overview
- 14.2.1.2. Products
- 14.2.1.3. SWOT Analysis
- 14.2.1.4. Recent Developments
- 14.2.1.5. Financials (Based on Availability)
- 14.2.2 Creative Virtual Pvt Ltd
- 14.2.2.1. Overview
- 14.2.2.2. Products
- 14.2.2.3. SWOT Analysis
- 14.2.2.4. Recent Developments
- 14.2.2.5. Financials (Based on Availability)
- 14.2.3 IBM Corporation
- 14.2.3.1. Overview
- 14.2.3.2. Products
- 14.2.3.3. SWOT Analysis
- 14.2.3.4. Recent Developments
- 14.2.3.5. Financials (Based on Availability)
- 14.2.4 24/7 Customer Inc
- 14.2.4.1. Overview
- 14.2.4.2. Products
- 14.2.4.3. SWOT Analysis
- 14.2.4.4. Recent Developments
- 14.2.4.5. Financials (Based on Availability)
- 14.2.5 Artificial Solutions International AB
- 14.2.5.1. Overview
- 14.2.5.2. Products
- 14.2.5.3. SWOT Analysis
- 14.2.5.4. Recent Developments
- 14.2.5.5. Financials (Based on Availability)
- 14.2.6 Codebaby Corporatio
- 14.2.6.1. Overview
- 14.2.6.2. Products
- 14.2.6.3. SWOT Analysis
- 14.2.6.4. Recent Developments
- 14.2.6.5. Financials (Based on Availability)
- 14.2.7 eGain Corporation
- 14.2.7.1. Overview
- 14.2.7.2. Products
- 14.2.7.3. SWOT Analysis
- 14.2.7.4. Recent Developments
- 14.2.7.5. Financials (Based on Availability)
- 14.2.8 Next IT Corporation
- 14.2.8.1. Overview
- 14.2.8.2. Products
- 14.2.8.3. SWOT Analysis
- 14.2.8.4. Recent Developments
- 14.2.8.5. Financials (Based on Availability)
- 14.2.9 CX Company Limited
- 14.2.9.1. Overview
- 14.2.9.2. Products
- 14.2.9.3. SWOT Analysis
- 14.2.9.4. Recent Developments
- 14.2.9.5. Financials (Based on Availability)
- 14.2.10 Speakoit Inc
- 14.2.10.1. Overview
- 14.2.10.2. Products
- 14.2.10.3. SWOT Analysis
- 14.2.10.4. Recent Developments
- 14.2.10.5. Financials (Based on Availability)
- 14.2.1 Nuance Communications Inc
List of Figures
- Figure 1: Global Smart Advisory Market Revenue Breakdown (Million, %) by Region 2024 & 2032
- Figure 2: North America Smart Advisory Market Revenue (Million), by Country 2024 & 2032
- Figure 3: North America Smart Advisory Market Revenue Share (%), by Country 2024 & 2032
- Figure 4: Europe Smart Advisory Market Revenue (Million), by Country 2024 & 2032
- Figure 5: Europe Smart Advisory Market Revenue Share (%), by Country 2024 & 2032
- Figure 6: Asia Pacific Smart Advisory Market Revenue (Million), by Country 2024 & 2032
- Figure 7: Asia Pacific Smart Advisory Market Revenue Share (%), by Country 2024 & 2032
- Figure 8: Rest of the World Smart Advisory Market Revenue (Million), by Country 2024 & 2032
- Figure 9: Rest of the World Smart Advisory Market Revenue Share (%), by Country 2024 & 2032
- Figure 10: North America Smart Advisory Market Revenue (Million), by Offerings 2024 & 2032
- Figure 11: North America Smart Advisory Market Revenue Share (%), by Offerings 2024 & 2032
- Figure 12: North America Smart Advisory Market Revenue (Million), by End-user Verticals 2024 & 2032
- Figure 13: North America Smart Advisory Market Revenue Share (%), by End-user Verticals 2024 & 2032
- Figure 14: North America Smart Advisory Market Revenue (Million), by Country 2024 & 2032
- Figure 15: North America Smart Advisory Market Revenue Share (%), by Country 2024 & 2032
- Figure 16: Europe Smart Advisory Market Revenue (Million), by Offerings 2024 & 2032
- Figure 17: Europe Smart Advisory Market Revenue Share (%), by Offerings 2024 & 2032
- Figure 18: Europe Smart Advisory Market Revenue (Million), by End-user Verticals 2024 & 2032
- Figure 19: Europe Smart Advisory Market Revenue Share (%), by End-user Verticals 2024 & 2032
- Figure 20: Europe Smart Advisory Market Revenue (Million), by Country 2024 & 2032
- Figure 21: Europe Smart Advisory Market Revenue Share (%), by Country 2024 & 2032
- Figure 22: Asia Pacific Smart Advisory Market Revenue (Million), by Offerings 2024 & 2032
- Figure 23: Asia Pacific Smart Advisory Market Revenue Share (%), by Offerings 2024 & 2032
- Figure 24: Asia Pacific Smart Advisory Market Revenue (Million), by End-user Verticals 2024 & 2032
- Figure 25: Asia Pacific Smart Advisory Market Revenue Share (%), by End-user Verticals 2024 & 2032
- Figure 26: Asia Pacific Smart Advisory Market Revenue (Million), by Country 2024 & 2032
- Figure 27: Asia Pacific Smart Advisory Market Revenue Share (%), by Country 2024 & 2032
- Figure 28: Rest of the World Smart Advisory Market Revenue (Million), by Offerings 2024 & 2032
- Figure 29: Rest of the World Smart Advisory Market Revenue Share (%), by Offerings 2024 & 2032
- Figure 30: Rest of the World Smart Advisory Market Revenue (Million), by End-user Verticals 2024 & 2032
- Figure 31: Rest of the World Smart Advisory Market Revenue Share (%), by End-user Verticals 2024 & 2032
- Figure 32: Rest of the World Smart Advisory Market Revenue (Million), by Country 2024 & 2032
- Figure 33: Rest of the World Smart Advisory Market Revenue Share (%), by Country 2024 & 2032
List of Tables
- Table 1: Global Smart Advisory Market Revenue Million Forecast, by Region 2019 & 2032
- Table 2: Global Smart Advisory Market Revenue Million Forecast, by Offerings 2019 & 2032
- Table 3: Global Smart Advisory Market Revenue Million Forecast, by End-user Verticals 2019 & 2032
- Table 4: Global Smart Advisory Market Revenue Million Forecast, by Region 2019 & 2032
- Table 5: Global Smart Advisory Market Revenue Million Forecast, by Country 2019 & 2032
- Table 6: Smart Advisory Market Revenue (Million) Forecast, by Application 2019 & 2032
- Table 7: Global Smart Advisory Market Revenue Million Forecast, by Country 2019 & 2032
- Table 8: Smart Advisory Market Revenue (Million) Forecast, by Application 2019 & 2032
- Table 9: Global Smart Advisory Market Revenue Million Forecast, by Country 2019 & 2032
- Table 10: Smart Advisory Market Revenue (Million) Forecast, by Application 2019 & 2032
- Table 11: Global Smart Advisory Market Revenue Million Forecast, by Country 2019 & 2032
- Table 12: Smart Advisory Market Revenue (Million) Forecast, by Application 2019 & 2032
- Table 13: Global Smart Advisory Market Revenue Million Forecast, by Offerings 2019 & 2032
- Table 14: Global Smart Advisory Market Revenue Million Forecast, by End-user Verticals 2019 & 2032
- Table 15: Global Smart Advisory Market Revenue Million Forecast, by Country 2019 & 2032
- Table 16: Global Smart Advisory Market Revenue Million Forecast, by Offerings 2019 & 2032
- Table 17: Global Smart Advisory Market Revenue Million Forecast, by End-user Verticals 2019 & 2032
- Table 18: Global Smart Advisory Market Revenue Million Forecast, by Country 2019 & 2032
- Table 19: Global Smart Advisory Market Revenue Million Forecast, by Offerings 2019 & 2032
- Table 20: Global Smart Advisory Market Revenue Million Forecast, by End-user Verticals 2019 & 2032
- Table 21: Global Smart Advisory Market Revenue Million Forecast, by Country 2019 & 2032
- Table 22: Global Smart Advisory Market Revenue Million Forecast, by Offerings 2019 & 2032
- Table 23: Global Smart Advisory Market Revenue Million Forecast, by End-user Verticals 2019 & 2032
- Table 24: Global Smart Advisory Market Revenue Million Forecast, by Country 2019 & 2032
Frequently Asked Questions
1. What is the projected Compound Annual Growth Rate (CAGR) of the Smart Advisory Market?
The projected CAGR is approximately 19.96%.
2. Which companies are prominent players in the Smart Advisory Market?
Key companies in the market include Nuance Communications Inc, Creative Virtual Pvt Ltd, IBM Corporation, 24/7 Customer Inc, Artificial Solutions International AB, Codebaby Corporatio, eGain Corporation, Next IT Corporation, CX Company Limited, Speakoit Inc.
3. What are the main segments of the Smart Advisory Market?
The market segments include Offerings, End-user Verticals.
4. Can you provide details about the market size?
The market size is estimated to be USD 6.96 Million as of 2022.
5. What are some drivers contributing to market growth?
Burgeoning Demand for Intelligent Customer Engagement; Demand for Automation for Cost Management in the Healthcare; Increasing Penetration of Websites and Mobile Applications Integrated with Cloud Computing.
6. What are the notable trends driving market growth?
The Retail Segment is Expected to Witness Significant Adoption for Smart Advisor Solutions..
7. Are there any restraints impacting market growth?
Lack of Awareness and Information and Availability as add-in Under Analytics.
8. Can you provide examples of recent developments in the market?
November 2023 - Nasdaq Launched an Innovative Solution for Financial Advisors in Partnership with Trackinsight. US Advisors now have access to a new tool in their toolbox with the launch of Fundsight, a free online platform created by Nasdaq and Trackinsight. The site, which is accessible through a simple single sign-on that verifies advisors through their FINRA CRD number, provides new and unique tools to advisors, allowing easy access to fund discovery, research, portfolio management, investment ideas, and content, all created with the intent of saving advisors time to focus on clients and grow their business.
9. What pricing options are available for accessing the report?
Pricing options include single-user, multi-user, and enterprise licenses priced at USD 4750, USD 5250, and USD 8750 respectively.
10. Is the market size provided in terms of value or volume?
The market size is provided in terms of value, measured in Million.
11. Are there any specific market keywords associated with the report?
Yes, the market keyword associated with the report is "Smart Advisory Market," which aids in identifying and referencing the specific market segment covered.
12. How do I determine which pricing option suits my needs best?
The pricing options vary based on user requirements and access needs. Individual users may opt for single-user licenses, while businesses requiring broader access may choose multi-user or enterprise licenses for cost-effective access to the report.
13. Are there any additional resources or data provided in the Smart Advisory Market report?
While the report offers comprehensive insights, it's advisable to review the specific contents or supplementary materials provided to ascertain if additional resources or data are available.
14. How can I stay updated on further developments or reports in the Smart Advisory Market?
To stay informed about further developments, trends, and reports in the Smart Advisory Market, consider subscribing to industry newsletters, following relevant companies and organizations, or regularly checking reputable industry news sources and publications.
Methodology
Step 1 - Identification of Relevant Samples Size from Population Database


Step 2 - Approaches for Defining Global Market Size (Value, Volume* & Price*)

Note*: In applicable scenarios
Step 3 - Data Sources
Primary Research
- Web Analytics
- Survey Reports
- Research Institute
- Latest Research Reports
- Opinion Leaders
Secondary Research
- Annual Reports
- White Paper
- Latest Press Release
- Industry Association
- Paid Database
- Investor Presentations

Step 4 - Data Triangulation
Involves using different sources of information in order to increase the validity of a study
These sources are likely to be stakeholders in a program - participants, other researchers, program staff, other community members, and so on.
Then we put all data in single framework & apply various statistical tools to find out the dynamic on the market.
During the analysis stage, feedback from the stakeholder groups would be compared to determine areas of agreement as well as areas of divergence
