

Key Insights
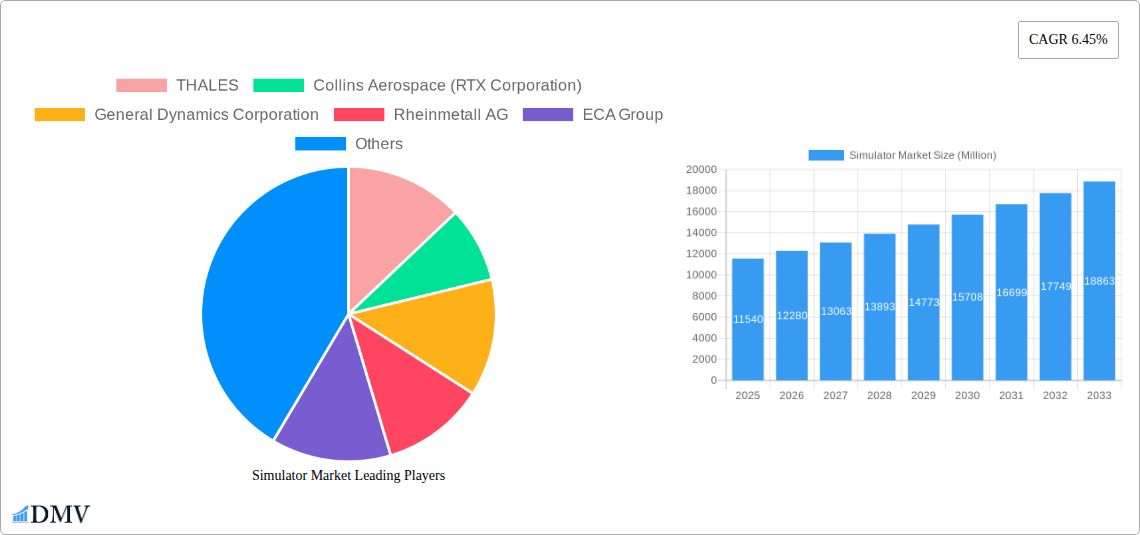
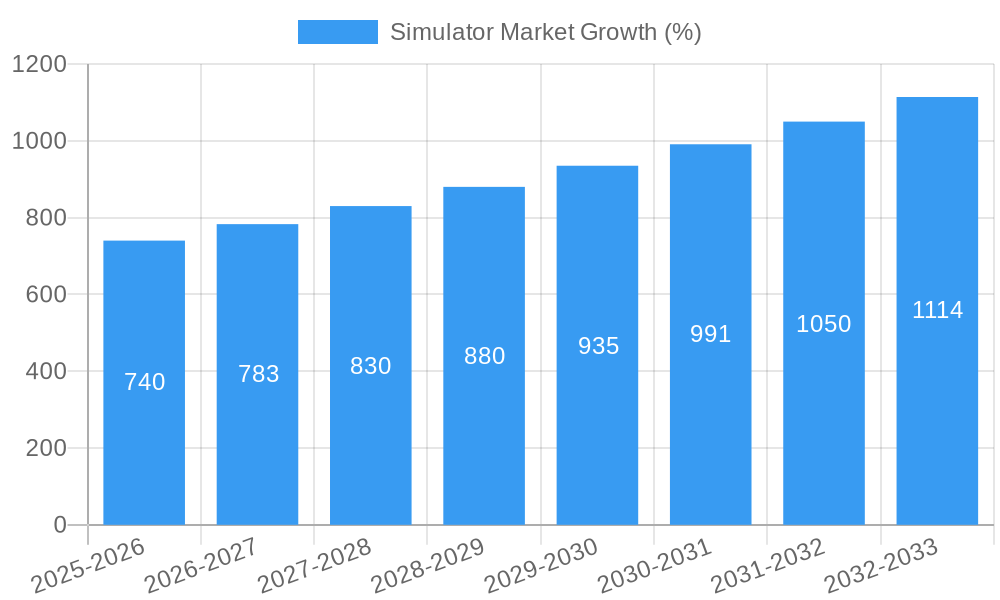
The global simulator market, valued at $11.54 billion in 2025, is projected to experience robust growth, exhibiting a Compound Annual Growth Rate (CAGR) of 6.45% from 2025 to 2033. This expansion is driven by several key factors. The increasing demand for advanced training solutions across various sectors, including aviation, defense, and maritime, is a primary catalyst. The rising adoption of sophisticated simulation technologies, such as high-fidelity visual systems, haptic feedback devices, and advanced software, enhances training effectiveness and reduces the costs associated with real-world training exercises. Furthermore, stringent safety regulations and the need for skilled professionals in these industries are fostering significant investments in simulator technologies. The market is segmented by platform (air, land, and sea), each contributing to the overall growth, with the aviation segment likely dominating due to the high demand for pilot training and the increasing complexity of modern aircraft. Technological advancements like the integration of artificial intelligence and virtual reality are expected to further propel market growth in the coming years.
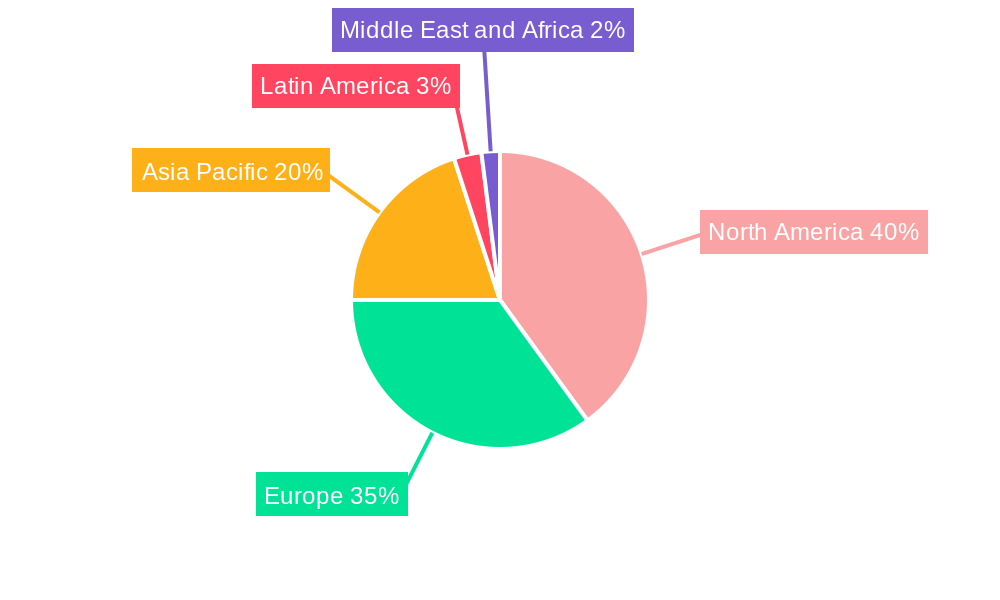
Geographical distribution reveals significant market presence across North America, Europe, and Asia Pacific. North America currently holds a substantial market share, driven by a large defense sector and a well-established aerospace industry. Europe and Asia Pacific follow closely, with substantial growth potential in emerging economies. However, certain restraining factors, such as the high initial investment costs associated with simulator acquisition and maintenance, as well as the need for skilled personnel to operate and maintain these systems, might somewhat moderate market growth. Nevertheless, the long-term prospects for the simulator market remain highly positive, fueled by continuous technological innovation and the sustained demand for efficient and effective training across diverse sectors. Key players like Thales, Collins Aerospace, and CAE are expected to leverage technological advancements and strategic partnerships to maintain their market leadership and capitalize on future growth opportunities.
Simulator Market: A Comprehensive Report (2019-2033)
This insightful report provides a detailed analysis of the global Simulator Market, encompassing its current state, future trajectory, and key players. With a study period spanning from 2019 to 2033, a base year of 2025, and an estimated year of 2025, this report offers invaluable insights for stakeholders seeking to understand and capitalize on the opportunities within this dynamic market. The global market size is estimated at xx Million in 2025 and is projected to reach xx Million by 2033, exhibiting a CAGR of xx%.
Simulator Market Composition & Trends
The Simulator Market is characterized by a moderately concentrated landscape, with key players like THALES, Collins Aerospace (RTX Corporation), General Dynamics Corporation, and CAE Inc holding significant market share. The distribution is estimated as follows: Thales (xx%), Collins Aerospace (xx%), General Dynamics (xx%), CAE Inc (xx%), others (xx%). Innovation is driven by advancements in VR/AR technologies, AI-powered simulation, and the increasing demand for realistic training environments. Stringent safety regulations across various sectors, particularly aviation and defense, significantly influence market dynamics. Substitute products, like on-the-job training, are limited due to cost and safety concerns. End-users span across military, commercial aviation, maritime, and automotive industries. The market has witnessed several notable M&A activities in recent years, with deal values exceeding xx Million in the period 2019-2024.
- Market Concentration: Moderately concentrated, with top 4 players accounting for xx% of the market share.
- Innovation Catalysts: VR/AR integration, AI, and enhanced realism in simulations.
- Regulatory Landscape: Stringent safety regulations across aviation, defense, and other sectors.
- Substitute Products: Limited, due to safety and cost concerns.
- End-User Profiles: Military, commercial aviation, maritime, and automotive industries.
- M&A Activities: Significant activity, with deal values exceeding xx Million between 2019-2024.
Simulator Market Industry Evolution
The Simulator Market has witnessed robust growth during the historical period (2019-2024), driven by increasing defense budgets, the growing need for skilled personnel in various industries, and technological advancements. The market experienced a CAGR of xx% from 2019 to 2024. Technological advancements, such as the incorporation of high-fidelity graphics, haptic feedback systems, and AI-driven adaptive training scenarios, have significantly enhanced the realism and effectiveness of simulators. Consumer demand is shifting towards more immersive and personalized training experiences, leading to the development of sophisticated simulation platforms. The forecast period (2025-2033) is expected to see continued growth, driven by factors like increasing adoption of simulators in emerging markets and the development of innovative simulation technologies. Adoption rates are expected to increase by xx% annually during this period.
Leading Regions, Countries, or Segments in Simulator Market
The Air segment currently dominates the Simulator Market, driven by the substantial investments in commercial and military aviation training. This segment is expected to maintain its leadership throughout the forecast period.
- Key Drivers (Air Segment):
- High investments in pilot training programs globally.
- Stringent aviation safety regulations mandating simulator-based training.
- Continuous technological advancements in flight simulation technologies.
- Dominance Factors: The high demand for skilled pilots and aircrew, coupled with the cost-effectiveness and safety benefits of simulator-based training, have propelled the Air segment to its dominant position. The increasing global air travel volume further fuels this demand.
The Land and Sea segments are also experiencing growth, but at a comparatively slower rate than the Air segment. This is primarily due to the lower adoption rates in these sectors, with several factors such as high initial investment costs and limited government funding impacting growth.
Simulator Market Product Innovations
Recent product innovations have focused on enhanced realism, modularity, and cost-effectiveness. The integration of VR/AR technologies provides more immersive training experiences, while modular designs allow for customization and adaptability to various training needs. Key performance metrics include training effectiveness (measured by proficiency gains), cost-per-hour of training, and system reliability. Unique selling propositions focus on superior realism, customization options, and integration with existing training management systems.
Propelling Factors for Simulator Market Growth
Several factors contribute to the market's growth. Technological advancements like AI and VR/AR are enhancing simulation realism and effectiveness. Economic growth in various sectors fuels demand for skilled personnel, and therefore the need for effective training solutions. Finally, stringent safety regulations in various industries mandate the use of simulators, particularly in aviation and defense.
Obstacles in the Simulator Market Market
The Simulator Market faces several challenges. High initial investment costs can hinder adoption, especially in smaller organizations. Supply chain disruptions can impact manufacturing and delivery schedules. Intense competition among established players and new entrants puts pressure on pricing and margins. Regulatory changes can create uncertainty and impact business plans.
Future Opportunities in Simulator Market
Emerging opportunities include the expansion into new markets (e.g., healthcare, energy), the integration of AI and machine learning for personalized training, and the development of cloud-based simulation platforms to enhance accessibility and reduce infrastructure costs.
Major Players in the Simulator Market Ecosystem
- THALES
- Collins Aerospace (RTX Corporation)
- General Dynamics Corporation
- Rheinmetall AG
- ECA Group
- RUAG Group
- FAAC Incorporated
- FRASCA International Inc
- CAE Inc
- VSTEP BV
- Kongsberg Gruppen AS
- Krauss-Maffei Wegmann GmbH & Co KG
- FlightSafety International Inc
Key Developments in Simulator Market Industry
- 2022 Q4: CAE Inc launched a new generation of flight training devices.
- 2023 Q1: THALES secured a major contract for military simulator systems.
- 2023 Q2: A significant merger between two smaller simulator companies reshaped the competitive landscape. (Further details would be included in the full report.)
Strategic Simulator Market Market Forecast
The Simulator Market is poised for continued growth driven by technological advancements, increasing demand for skilled personnel, and stringent safety regulations. Future opportunities in emerging markets and the development of innovative training solutions promise significant market potential, particularly in the integration of AI-powered personalized training and cloud-based simulation platforms. The global market is expected to witness sustained expansion, creating lucrative avenues for businesses to invest and grow within this dynamic and essential sector.
Simulator Market Segmentation
-
1. Platform
- 1.1. Air
- 1.2. Land
- 1.3. Sea
Simulator Market Segmentation By Geography
-
1. North America
- 1.1. United States
- 1.2. Canada
-
2. Europe
- 2.1. United Kingdom
- 2.2. France
- 2.3. Germany
- 2.4. Rest of Europe
-
3. Asia Pacific
- 3.1. China
- 3.2. India
- 3.3. Japan
- 3.4. South Korea
- 3.5. Rest of Asia Pacific
-
4. Latin America
- 4.1. Brazil
- 4.2. Rest of Latin America
-
5. Middle East and Africa
- 5.1. Saudi Arabia
- 5.2. United Arab Emirates
- 5.3. Turkey
- 5.4. Rest of the Middle East and Africa
Simulator Market REPORT HIGHLIGHTS
| Aspects | Details |
|---|---|
| Study Period | 2019-2033 |
| Base Year | 2024 |
| Estimated Year | 2025 |
| Forecast Period | 2025-2033 |
| Historical Period | 2019-2024 |
| Growth Rate | CAGR of 6.45% from 2019-2033 |
| Segmentation |
|
Table of Contents
- 1. Introduction
- 1.1. Research Scope
- 1.2. Market Segmentation
- 1.3. Research Methodology
- 1.4. Definitions and Assumptions
- 2. Executive Summary
- 2.1. Introduction
- 3. Market Dynamics
- 3.1. Introduction
- 3.2. Market Drivers
- 3.3. Market Restrains
- 3.4. Market Trends
- 3.4.1. Air Segment Will Showcase Remarkable Growth During the Forecast Period
- 4. Market Factor Analysis
- 4.1. Porters Five Forces
- 4.2. Supply/Value Chain
- 4.3. PESTEL analysis
- 4.4. Market Entropy
- 4.5. Patent/Trademark Analysis
- 5. Global Simulator Market Analysis, Insights and Forecast, 2019-2031
- 5.1. Market Analysis, Insights and Forecast - by Platform
- 5.1.1. Air
- 5.1.2. Land
- 5.1.3. Sea
- 5.2. Market Analysis, Insights and Forecast - by Region
- 5.2.1. North America
- 5.2.2. Europe
- 5.2.3. Asia Pacific
- 5.2.4. Latin America
- 5.2.5. Middle East and Africa
- 5.1. Market Analysis, Insights and Forecast - by Platform
- 6. North America Simulator Market Analysis, Insights and Forecast, 2019-2031
- 6.1. Market Analysis, Insights and Forecast - by Platform
- 6.1.1. Air
- 6.1.2. Land
- 6.1.3. Sea
- 6.1. Market Analysis, Insights and Forecast - by Platform
- 7. Europe Simulator Market Analysis, Insights and Forecast, 2019-2031
- 7.1. Market Analysis, Insights and Forecast - by Platform
- 7.1.1. Air
- 7.1.2. Land
- 7.1.3. Sea
- 7.1. Market Analysis, Insights and Forecast - by Platform
- 8. Asia Pacific Simulator Market Analysis, Insights and Forecast, 2019-2031
- 8.1. Market Analysis, Insights and Forecast - by Platform
- 8.1.1. Air
- 8.1.2. Land
- 8.1.3. Sea
- 8.1. Market Analysis, Insights and Forecast - by Platform
- 9. Latin America Simulator Market Analysis, Insights and Forecast, 2019-2031
- 9.1. Market Analysis, Insights and Forecast - by Platform
- 9.1.1. Air
- 9.1.2. Land
- 9.1.3. Sea
- 9.1. Market Analysis, Insights and Forecast - by Platform
- 10. Middle East and Africa Simulator Market Analysis, Insights and Forecast, 2019-2031
- 10.1. Market Analysis, Insights and Forecast - by Platform
- 10.1.1. Air
- 10.1.2. Land
- 10.1.3. Sea
- 10.1. Market Analysis, Insights and Forecast - by Platform
- 11. North America Simulator Market Analysis, Insights and Forecast, 2019-2031
- 11.1. Market Analysis, Insights and Forecast - By Country/Sub-region
- 11.1.1 United States
- 11.1.2 Canada
- 12. Europe Simulator Market Analysis, Insights and Forecast, 2019-2031
- 12.1. Market Analysis, Insights and Forecast - By Country/Sub-region
- 12.1.1 United Kingdom
- 12.1.2 France
- 12.1.3 Germany
- 12.1.4 Rest of Europe
- 13. Asia Pacific Simulator Market Analysis, Insights and Forecast, 2019-2031
- 13.1. Market Analysis, Insights and Forecast - By Country/Sub-region
- 13.1.1 China
- 13.1.2 India
- 13.1.3 Japan
- 13.1.4 South Korea
- 13.1.5 Rest of Asia Pacific
- 14. Latin America Simulator Market Analysis, Insights and Forecast, 2019-2031
- 14.1. Market Analysis, Insights and Forecast - By Country/Sub-region
- 14.1.1 Brazil
- 14.1.2 Rest of Latin America
- 15. Middle East and Africa Simulator Market Analysis, Insights and Forecast, 2019-2031
- 15.1. Market Analysis, Insights and Forecast - By Country/Sub-region
- 15.1.1 Saudi Arabia
- 15.1.2 United Arab Emirates
- 15.1.3 Turkey
- 15.1.4 Rest of the Middle East and Africa
- 16. Competitive Analysis
- 16.1. Global Market Share Analysis 2024
- 16.2. Company Profiles
- 16.2.1 THALES
- 16.2.1.1. Overview
- 16.2.1.2. Products
- 16.2.1.3. SWOT Analysis
- 16.2.1.4. Recent Developments
- 16.2.1.5. Financials (Based on Availability)
- 16.2.2 Collins Aerospace (RTX Corporation)
- 16.2.2.1. Overview
- 16.2.2.2. Products
- 16.2.2.3. SWOT Analysis
- 16.2.2.4. Recent Developments
- 16.2.2.5. Financials (Based on Availability)
- 16.2.3 General Dynamics Corporation
- 16.2.3.1. Overview
- 16.2.3.2. Products
- 16.2.3.3. SWOT Analysis
- 16.2.3.4. Recent Developments
- 16.2.3.5. Financials (Based on Availability)
- 16.2.4 Rheinmetall AG
- 16.2.4.1. Overview
- 16.2.4.2. Products
- 16.2.4.3. SWOT Analysis
- 16.2.4.4. Recent Developments
- 16.2.4.5. Financials (Based on Availability)
- 16.2.5 ECA Group
- 16.2.5.1. Overview
- 16.2.5.2. Products
- 16.2.5.3. SWOT Analysis
- 16.2.5.4. Recent Developments
- 16.2.5.5. Financials (Based on Availability)
- 16.2.6 RUAG Group
- 16.2.6.1. Overview
- 16.2.6.2. Products
- 16.2.6.3. SWOT Analysis
- 16.2.6.4. Recent Developments
- 16.2.6.5. Financials (Based on Availability)
- 16.2.7 FAAC Incorporated
- 16.2.7.1. Overview
- 16.2.7.2. Products
- 16.2.7.3. SWOT Analysis
- 16.2.7.4. Recent Developments
- 16.2.7.5. Financials (Based on Availability)
- 16.2.8 FRASCA International Inc
- 16.2.8.1. Overview
- 16.2.8.2. Products
- 16.2.8.3. SWOT Analysis
- 16.2.8.4. Recent Developments
- 16.2.8.5. Financials (Based on Availability)
- 16.2.9 CAE Inc
- 16.2.9.1. Overview
- 16.2.9.2. Products
- 16.2.9.3. SWOT Analysis
- 16.2.9.4. Recent Developments
- 16.2.9.5. Financials (Based on Availability)
- 16.2.10 VSTEP BV
- 16.2.10.1. Overview
- 16.2.10.2. Products
- 16.2.10.3. SWOT Analysis
- 16.2.10.4. Recent Developments
- 16.2.10.5. Financials (Based on Availability)
- 16.2.11 Kongsberg Gruppen AS
- 16.2.11.1. Overview
- 16.2.11.2. Products
- 16.2.11.3. SWOT Analysis
- 16.2.11.4. Recent Developments
- 16.2.11.5. Financials (Based on Availability)
- 16.2.12 Krauss-Maffei Wegmann GmbH & Co KG
- 16.2.12.1. Overview
- 16.2.12.2. Products
- 16.2.12.3. SWOT Analysis
- 16.2.12.4. Recent Developments
- 16.2.12.5. Financials (Based on Availability)
- 16.2.13 FlightSafety International Inc
- 16.2.13.1. Overview
- 16.2.13.2. Products
- 16.2.13.3. SWOT Analysis
- 16.2.13.4. Recent Developments
- 16.2.13.5. Financials (Based on Availability)
- 16.2.1 THALES
List of Figures
- Figure 1: Global Simulator Market Revenue Breakdown (Million, %) by Region 2024 & 2032
- Figure 2: North America Simulator Market Revenue (Million), by Country 2024 & 2032
- Figure 3: North America Simulator Market Revenue Share (%), by Country 2024 & 2032
- Figure 4: Europe Simulator Market Revenue (Million), by Country 2024 & 2032
- Figure 5: Europe Simulator Market Revenue Share (%), by Country 2024 & 2032
- Figure 6: Asia Pacific Simulator Market Revenue (Million), by Country 2024 & 2032
- Figure 7: Asia Pacific Simulator Market Revenue Share (%), by Country 2024 & 2032
- Figure 8: Latin America Simulator Market Revenue (Million), by Country 2024 & 2032
- Figure 9: Latin America Simulator Market Revenue Share (%), by Country 2024 & 2032
- Figure 10: Middle East and Africa Simulator Market Revenue (Million), by Country 2024 & 2032
- Figure 11: Middle East and Africa Simulator Market Revenue Share (%), by Country 2024 & 2032
- Figure 12: North America Simulator Market Revenue (Million), by Platform 2024 & 2032
- Figure 13: North America Simulator Market Revenue Share (%), by Platform 2024 & 2032
- Figure 14: North America Simulator Market Revenue (Million), by Country 2024 & 2032
- Figure 15: North America Simulator Market Revenue Share (%), by Country 2024 & 2032
- Figure 16: Europe Simulator Market Revenue (Million), by Platform 2024 & 2032
- Figure 17: Europe Simulator Market Revenue Share (%), by Platform 2024 & 2032
- Figure 18: Europe Simulator Market Revenue (Million), by Country 2024 & 2032
- Figure 19: Europe Simulator Market Revenue Share (%), by Country 2024 & 2032
- Figure 20: Asia Pacific Simulator Market Revenue (Million), by Platform 2024 & 2032
- Figure 21: Asia Pacific Simulator Market Revenue Share (%), by Platform 2024 & 2032
- Figure 22: Asia Pacific Simulator Market Revenue (Million), by Country 2024 & 2032
- Figure 23: Asia Pacific Simulator Market Revenue Share (%), by Country 2024 & 2032
- Figure 24: Latin America Simulator Market Revenue (Million), by Platform 2024 & 2032
- Figure 25: Latin America Simulator Market Revenue Share (%), by Platform 2024 & 2032
- Figure 26: Latin America Simulator Market Revenue (Million), by Country 2024 & 2032
- Figure 27: Latin America Simulator Market Revenue Share (%), by Country 2024 & 2032
- Figure 28: Middle East and Africa Simulator Market Revenue (Million), by Platform 2024 & 2032
- Figure 29: Middle East and Africa Simulator Market Revenue Share (%), by Platform 2024 & 2032
- Figure 30: Middle East and Africa Simulator Market Revenue (Million), by Country 2024 & 2032
- Figure 31: Middle East and Africa Simulator Market Revenue Share (%), by Country 2024 & 2032
List of Tables
- Table 1: Global Simulator Market Revenue Million Forecast, by Region 2019 & 2032
- Table 2: Global Simulator Market Revenue Million Forecast, by Platform 2019 & 2032
- Table 3: Global Simulator Market Revenue Million Forecast, by Region 2019 & 2032
- Table 4: Global Simulator Market Revenue Million Forecast, by Country 2019 & 2032
- Table 5: United States Simulator Market Revenue (Million) Forecast, by Application 2019 & 2032
- Table 6: Canada Simulator Market Revenue (Million) Forecast, by Application 2019 & 2032
- Table 7: Global Simulator Market Revenue Million Forecast, by Country 2019 & 2032
- Table 8: United Kingdom Simulator Market Revenue (Million) Forecast, by Application 2019 & 2032
- Table 9: France Simulator Market Revenue (Million) Forecast, by Application 2019 & 2032
- Table 10: Germany Simulator Market Revenue (Million) Forecast, by Application 2019 & 2032
- Table 11: Rest of Europe Simulator Market Revenue (Million) Forecast, by Application 2019 & 2032
- Table 12: Global Simulator Market Revenue Million Forecast, by Country 2019 & 2032
- Table 13: China Simulator Market Revenue (Million) Forecast, by Application 2019 & 2032
- Table 14: India Simulator Market Revenue (Million) Forecast, by Application 2019 & 2032
- Table 15: Japan Simulator Market Revenue (Million) Forecast, by Application 2019 & 2032
- Table 16: South Korea Simulator Market Revenue (Million) Forecast, by Application 2019 & 2032
- Table 17: Rest of Asia Pacific Simulator Market Revenue (Million) Forecast, by Application 2019 & 2032
- Table 18: Global Simulator Market Revenue Million Forecast, by Country 2019 & 2032
- Table 19: Brazil Simulator Market Revenue (Million) Forecast, by Application 2019 & 2032
- Table 20: Rest of Latin America Simulator Market Revenue (Million) Forecast, by Application 2019 & 2032
- Table 21: Global Simulator Market Revenue Million Forecast, by Country 2019 & 2032
- Table 22: Saudi Arabia Simulator Market Revenue (Million) Forecast, by Application 2019 & 2032
- Table 23: United Arab Emirates Simulator Market Revenue (Million) Forecast, by Application 2019 & 2032
- Table 24: Turkey Simulator Market Revenue (Million) Forecast, by Application 2019 & 2032
- Table 25: Rest of the Middle East and Africa Simulator Market Revenue (Million) Forecast, by Application 2019 & 2032
- Table 26: Global Simulator Market Revenue Million Forecast, by Platform 2019 & 2032
- Table 27: Global Simulator Market Revenue Million Forecast, by Country 2019 & 2032
- Table 28: United States Simulator Market Revenue (Million) Forecast, by Application 2019 & 2032
- Table 29: Canada Simulator Market Revenue (Million) Forecast, by Application 2019 & 2032
- Table 30: Global Simulator Market Revenue Million Forecast, by Platform 2019 & 2032
- Table 31: Global Simulator Market Revenue Million Forecast, by Country 2019 & 2032
- Table 32: United Kingdom Simulator Market Revenue (Million) Forecast, by Application 2019 & 2032
- Table 33: France Simulator Market Revenue (Million) Forecast, by Application 2019 & 2032
- Table 34: Germany Simulator Market Revenue (Million) Forecast, by Application 2019 & 2032
- Table 35: Rest of Europe Simulator Market Revenue (Million) Forecast, by Application 2019 & 2032
- Table 36: Global Simulator Market Revenue Million Forecast, by Platform 2019 & 2032
- Table 37: Global Simulator Market Revenue Million Forecast, by Country 2019 & 2032
- Table 38: China Simulator Market Revenue (Million) Forecast, by Application 2019 & 2032
- Table 39: India Simulator Market Revenue (Million) Forecast, by Application 2019 & 2032
- Table 40: Japan Simulator Market Revenue (Million) Forecast, by Application 2019 & 2032
- Table 41: South Korea Simulator Market Revenue (Million) Forecast, by Application 2019 & 2032
- Table 42: Rest of Asia Pacific Simulator Market Revenue (Million) Forecast, by Application 2019 & 2032
- Table 43: Global Simulator Market Revenue Million Forecast, by Platform 2019 & 2032
- Table 44: Global Simulator Market Revenue Million Forecast, by Country 2019 & 2032
- Table 45: Brazil Simulator Market Revenue (Million) Forecast, by Application 2019 & 2032
- Table 46: Rest of Latin America Simulator Market Revenue (Million) Forecast, by Application 2019 & 2032
- Table 47: Global Simulator Market Revenue Million Forecast, by Platform 2019 & 2032
- Table 48: Global Simulator Market Revenue Million Forecast, by Country 2019 & 2032
- Table 49: Saudi Arabia Simulator Market Revenue (Million) Forecast, by Application 2019 & 2032
- Table 50: United Arab Emirates Simulator Market Revenue (Million) Forecast, by Application 2019 & 2032
- Table 51: Turkey Simulator Market Revenue (Million) Forecast, by Application 2019 & 2032
- Table 52: Rest of the Middle East and Africa Simulator Market Revenue (Million) Forecast, by Application 2019 & 2032
Frequently Asked Questions
1. What is the projected Compound Annual Growth Rate (CAGR) of the Simulator Market?
The projected CAGR is approximately 6.45%.
2. Which companies are prominent players in the Simulator Market?
Key companies in the market include THALES, Collins Aerospace (RTX Corporation), General Dynamics Corporation, Rheinmetall AG, ECA Group, RUAG Group, FAAC Incorporated, FRASCA International Inc, CAE Inc, VSTEP BV, Kongsberg Gruppen AS, Krauss-Maffei Wegmann GmbH & Co KG, FlightSafety International Inc.
3. What are the main segments of the Simulator Market?
The market segments include Platform.
4. Can you provide details about the market size?
The market size is estimated to be USD 11.54 Million as of 2022.
5. What are some drivers contributing to market growth?
N/A
6. What are the notable trends driving market growth?
Air Segment Will Showcase Remarkable Growth During the Forecast Period.
7. Are there any restraints impacting market growth?
N/A
8. Can you provide examples of recent developments in the market?
N/A
9. What pricing options are available for accessing the report?
Pricing options include single-user, multi-user, and enterprise licenses priced at USD 4750, USD 5250, and USD 8750 respectively.
10. Is the market size provided in terms of value or volume?
The market size is provided in terms of value, measured in Million.
11. Are there any specific market keywords associated with the report?
Yes, the market keyword associated with the report is "Simulator Market," which aids in identifying and referencing the specific market segment covered.
12. How do I determine which pricing option suits my needs best?
The pricing options vary based on user requirements and access needs. Individual users may opt for single-user licenses, while businesses requiring broader access may choose multi-user or enterprise licenses for cost-effective access to the report.
13. Are there any additional resources or data provided in the Simulator Market report?
While the report offers comprehensive insights, it's advisable to review the specific contents or supplementary materials provided to ascertain if additional resources or data are available.
14. How can I stay updated on further developments or reports in the Simulator Market?
To stay informed about further developments, trends, and reports in the Simulator Market, consider subscribing to industry newsletters, following relevant companies and organizations, or regularly checking reputable industry news sources and publications.
Methodology
Step 1 - Identification of Relevant Samples Size from Population Database


Step 2 - Approaches for Defining Global Market Size (Value, Volume* & Price*)

Note*: In applicable scenarios
Step 3 - Data Sources
Primary Research
- Web Analytics
- Survey Reports
- Research Institute
- Latest Research Reports
- Opinion Leaders
Secondary Research
- Annual Reports
- White Paper
- Latest Press Release
- Industry Association
- Paid Database
- Investor Presentations

Step 4 - Data Triangulation
Involves using different sources of information in order to increase the validity of a study
These sources are likely to be stakeholders in a program - participants, other researchers, program staff, other community members, and so on.
Then we put all data in single framework & apply various statistical tools to find out the dynamic on the market.
During the analysis stage, feedback from the stakeholder groups would be compared to determine areas of agreement as well as areas of divergence
