

Key Insights
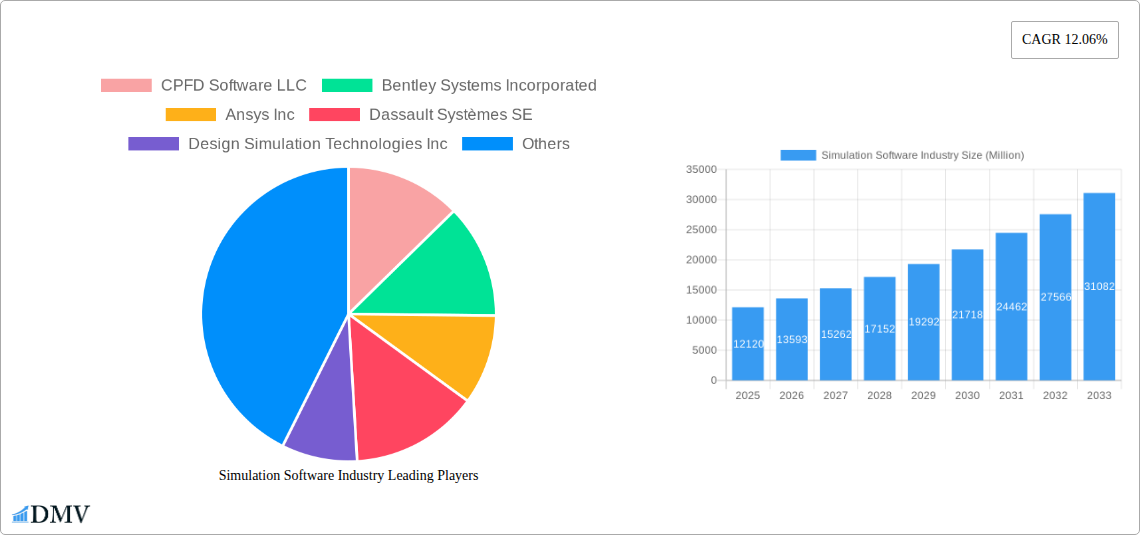
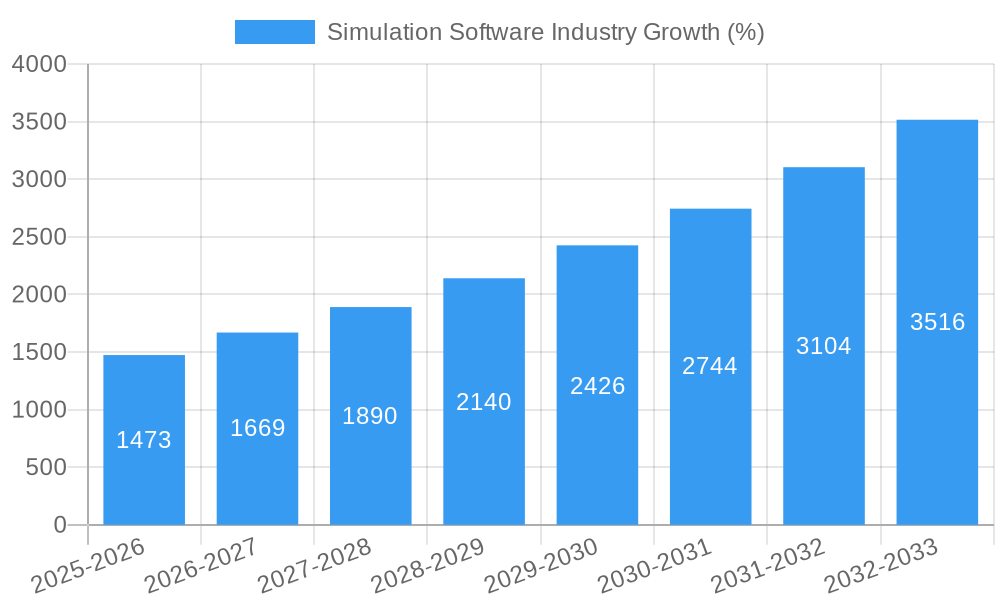
The simulation software market, valued at $12.12 billion in 2025, is projected to experience robust growth, driven by a Compound Annual Growth Rate (CAGR) of 12.06% from 2025 to 2033. This expansion is fueled by several key factors. Increasing adoption across diverse industries like automotive, aerospace, and energy is a major driver, as simulation software enables efficient product design, testing, and optimization, reducing development costs and time-to-market. Furthermore, the shift towards cloud-based deployment models offers enhanced accessibility, scalability, and cost-effectiveness, contributing to market growth. Advancements in simulation technologies, including high-fidelity modeling and AI-powered analysis, are further propelling innovation and adoption. While data security concerns and the complexity of implementing sophisticated simulation tools present some challenges, the overall market outlook remains positive, underpinned by continuous technological advancements and the expanding need for virtual prototyping across various sectors.
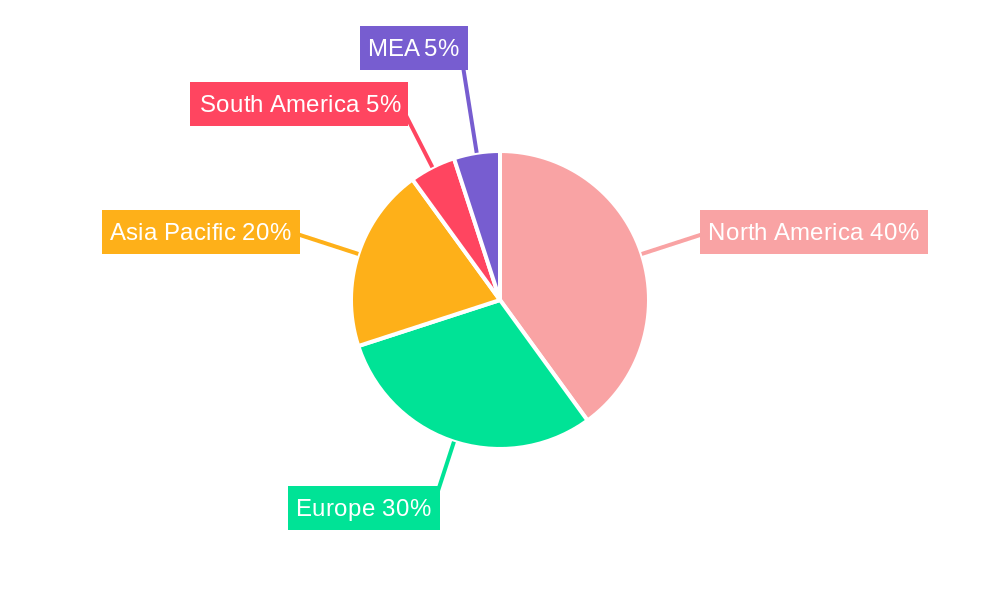
The market segmentation reveals significant opportunities within specific end-user industries. The automotive sector, with its emphasis on advanced driver-assistance systems (ADAS) and electric vehicle (EV) development, is a key growth driver. Similarly, the aerospace and defense industries rely heavily on simulation for complex system design and testing. The increasing complexity of products and systems necessitates sophisticated simulation tools, further driving market growth. Geographic distribution highlights North America and Europe as leading regions, reflecting the high concentration of key players and substantial R&D investment. However, the Asia-Pacific region is anticipated to witness significant growth due to rising industrialization and technological advancements in countries like China and India. Competitive rivalry among established players like ANSYS, Dassault Systèmes, and Siemens, alongside the emergence of innovative startups, fosters continuous innovation and enhances market dynamism. The projected market size in 2033 can be estimated by applying the CAGR to the 2025 value, indicating substantial future potential.
Simulation Software Industry Market Report: 2019-2033 Forecast
This comprehensive report provides a detailed analysis of the Simulation Software industry, projecting a market value of $xx Million by 2033. It delves into market dynamics, competitive landscapes, technological advancements, and future growth opportunities, offering invaluable insights for stakeholders. The study period covers 2019-2033, with 2025 as the base and estimated year.
Simulation Software Industry Market Composition & Trends
The simulation software market, valued at $xx Million in 2025, is characterized by moderate concentration, with key players like Ansys Inc, Dassault Systèmes SE, and Autodesk Inc holding significant market share. However, a number of smaller, specialized firms like CPFD Software LLC and Simio LLC are also making notable contributions. Innovation is driven by the increasing demand for accurate and efficient simulations across diverse industries. Regulatory landscapes, particularly concerning data privacy and cybersecurity, are evolving and influencing market practices. Substitute products, such as physical prototyping, still exist but are gradually being replaced due to cost and time efficiency advantages offered by simulation software. The market is witnessing significant M&A activity, with deal values exceeding $xx Million in recent years.
- Market Share Distribution (2025): Ansys Inc (xx%), Dassault Systèmes SE (xx%), Autodesk Inc (xx%), Others (xx%).
- M&A Activity (2019-2024): Total deal value exceeding $xx Million, with a focus on expanding capabilities and market reach.
- Key End-User Profiles: Automotive, Aerospace & Defense, and IT & Telecommunications sectors are major adopters.
Simulation Software Industry Industry Evolution
The simulation software industry has experienced robust growth, expanding at a CAGR of xx% during the historical period (2019-2024). This growth is primarily fueled by technological advancements such as the rise of Artificial Intelligence (AI) and Machine Learning (ML) integration, enhancing simulation accuracy and efficiency. The increasing complexity of products and systems across various industries necessitates the use of simulation software for optimization and risk mitigation. Shifting consumer demands towards faster product development cycles and enhanced product performance are further driving the adoption of these solutions. Cloud-based deployment models are gaining traction, offering scalability and accessibility benefits. Adoption metrics show a steady increase in the number of licenses sold and overall usage across sectors. The forecast period (2025-2033) anticipates a continued, albeit slightly moderated, growth trajectory, reaching $xx Million by 2033, driven by ongoing technological advancements and expanding applications across new end-user industries.
Leading Regions, Countries, or Segments in Simulation Software Industry
North America currently dominates the simulation software market, driven by robust R&D investments, a strong presence of major players, and high technological adoption rates. The region accounts for xx% of global market share. Europe and Asia-Pacific are also witnessing substantial growth, fueled by increasing industrialization and technological advancements.
- Key Drivers in North America: High R&D spending, early adoption of new technologies, presence of major industry players.
- Key Drivers in Europe: Growing industrial automation, increasing investments in digital transformation initiatives, stringent environmental regulations.
- Key Drivers in Asia-Pacific: Expanding manufacturing base, rising adoption of advanced technologies, government support for technological innovation.
- Dominant Deployment Type: Cloud deployment is gaining rapid adoption due to its flexibility and cost-effectiveness.
- Dominant End-User Industry: The Automotive industry leads in simulation software adoption due to its complexity and demand for high-precision designs.
Simulation Software Industry Product Innovations
Recent innovations include the integration of AI and ML for improved simulation accuracy and speed, the development of specialized simulation tools for specific industries (e.g., pharmaceutical development), and the introduction of cloud-based platforms for enhanced accessibility and scalability. These advancements offer unique selling propositions such as reduced development time, improved product performance, and optimized resource allocation. Performance metrics reflect significant improvements in simulation speed, accuracy, and user experience.
Propelling Factors for Simulation Software Industry Growth
Several factors fuel the simulation software industry's growth. Technological advancements, particularly AI and ML integration, are enhancing accuracy and efficiency. Economic factors, like the need for optimized product development and cost reduction, are driving adoption. Favorable regulatory environments supporting digital transformation and innovation are also contributing to growth. For example, government initiatives to promote Industry 4.0 are stimulating demand in several regions.
Obstacles in the Simulation Software Industry Market
The industry faces challenges such as high initial investment costs for software and hardware, the complexity of software implementation and training, and potential supply chain disruptions affecting hardware availability. Competitive pressures from established players and new entrants also present obstacles. The impact of these challenges can be measured by slower-than-expected adoption rates in certain industries and regions.
Future Opportunities in Simulation Software Industry
Emerging opportunities lie in expanding into new sectors such as renewable energy and personalized medicine. The development of more sophisticated simulation tools tailored to specific industry needs and integration with other technologies like digital twins presents significant potential. Furthermore, growing demand for simulation in areas like virtual and augmented reality applications will drive growth.
Major Players in the Simulation Software Industry Ecosystem
- CPFD Software LLC
- Bentley Systems Incorporated
- Ansys Inc
- Dassault Systèmes SE
- Design Simulation Technologies Inc
- Schneider Electric SE
- SolidWorks Corporation
- SIMUL8 Corporation
- Cybernet Systems Corp
- Simio LLC
- Siemens AG
- Altair Engineering Inc
- CONSELF Srl
- PTC Inc
- The MathWorks Inc
- Autodesk Inc
- Synopsys Inc
- Rockwell Automation Inc
- The COMSOL Group
- Lanner Group Ltd
Key Developments in Simulation Software Industry Industry
- March 2023: Simulations Plus, Inc. announced a cooperative research contract with the Institute of Medical Biology of the Polish Academy of Sciences to leverage AI/ML in pharmaceutical development. This highlights the increasing use of AI in simulation software.
- January 2023: Real-Time Innovations (RTI) partnered with Ansys to accelerate the development and testing of high-performance distributed systems through simulation. This signifies the growing importance of simulation in complex system development.
Strategic Simulation Software Industry Market Forecast
The simulation software market is poised for continued growth driven by technological innovation, increasing adoption across diverse industries, and the expansion of cloud-based solutions. The forecast period (2025-2033) promises significant market expansion, with substantial opportunities for players that can effectively leverage technological advancements and cater to the evolving needs of various end-user segments. The market is expected to achieve significant growth, exceeding $xx Million by 2033.
Simulation Software Industry Segmentation
-
1. Deployment Type
- 1.1. On-premise
- 1.2. Cloud
-
2. End-user Industry
- 2.1. Automotive
- 2.2. IT and Telecommunication
- 2.3. Aerospace and Defense
- 2.4. Energy and Mining
- 2.5. Education and Research
- 2.6. Electrical and Electronics
- 2.7. Other End-user Industries
Simulation Software Industry Segmentation By Geography
- 1. North America
- 2. Europe
- 3. Asia
- 4. Australia and New Zealand
- 5. Latin America
- 6. Middle East and Africa
Simulation Software Industry REPORT HIGHLIGHTS
| Aspects | Details |
|---|---|
| Study Period | 2019-2033 |
| Base Year | 2024 |
| Estimated Year | 2025 |
| Forecast Period | 2025-2033 |
| Historical Period | 2019-2024 |
| Growth Rate | CAGR of 12.06% from 2019-2033 |
| Segmentation |
|
Table of Contents
- 1. Introduction
- 1.1. Research Scope
- 1.2. Market Segmentation
- 1.3. Research Methodology
- 1.4. Definitions and Assumptions
- 2. Executive Summary
- 2.1. Introduction
- 3. Market Dynamics
- 3.1. Introduction
- 3.2. Market Drivers
- 3.2.1. Growing Automotive Sector
- 3.3. Market Restrains
- 3.3.1. Fluctuating Market Demands and Customization Issues
- 3.4. Market Trends
- 3.4.1. Automotive Segment is expected grow at a faster pace.
- 4. Market Factor Analysis
- 4.1. Porters Five Forces
- 4.2. Supply/Value Chain
- 4.3. PESTEL analysis
- 4.4. Market Entropy
- 4.5. Patent/Trademark Analysis
- 5. Global Simulation Software Industry Analysis, Insights and Forecast, 2019-2031
- 5.1. Market Analysis, Insights and Forecast - by Deployment Type
- 5.1.1. On-premise
- 5.1.2. Cloud
- 5.2. Market Analysis, Insights and Forecast - by End-user Industry
- 5.2.1. Automotive
- 5.2.2. IT and Telecommunication
- 5.2.3. Aerospace and Defense
- 5.2.4. Energy and Mining
- 5.2.5. Education and Research
- 5.2.6. Electrical and Electronics
- 5.2.7. Other End-user Industries
- 5.3. Market Analysis, Insights and Forecast - by Region
- 5.3.1. North America
- 5.3.2. Europe
- 5.3.3. Asia
- 5.3.4. Australia and New Zealand
- 5.3.5. Latin America
- 5.3.6. Middle East and Africa
- 5.1. Market Analysis, Insights and Forecast - by Deployment Type
- 6. North America Simulation Software Industry Analysis, Insights and Forecast, 2019-2031
- 6.1. Market Analysis, Insights and Forecast - by Deployment Type
- 6.1.1. On-premise
- 6.1.2. Cloud
- 6.2. Market Analysis, Insights and Forecast - by End-user Industry
- 6.2.1. Automotive
- 6.2.2. IT and Telecommunication
- 6.2.3. Aerospace and Defense
- 6.2.4. Energy and Mining
- 6.2.5. Education and Research
- 6.2.6. Electrical and Electronics
- 6.2.7. Other End-user Industries
- 6.1. Market Analysis, Insights and Forecast - by Deployment Type
- 7. Europe Simulation Software Industry Analysis, Insights and Forecast, 2019-2031
- 7.1. Market Analysis, Insights and Forecast - by Deployment Type
- 7.1.1. On-premise
- 7.1.2. Cloud
- 7.2. Market Analysis, Insights and Forecast - by End-user Industry
- 7.2.1. Automotive
- 7.2.2. IT and Telecommunication
- 7.2.3. Aerospace and Defense
- 7.2.4. Energy and Mining
- 7.2.5. Education and Research
- 7.2.6. Electrical and Electronics
- 7.2.7. Other End-user Industries
- 7.1. Market Analysis, Insights and Forecast - by Deployment Type
- 8. Asia Simulation Software Industry Analysis, Insights and Forecast, 2019-2031
- 8.1. Market Analysis, Insights and Forecast - by Deployment Type
- 8.1.1. On-premise
- 8.1.2. Cloud
- 8.2. Market Analysis, Insights and Forecast - by End-user Industry
- 8.2.1. Automotive
- 8.2.2. IT and Telecommunication
- 8.2.3. Aerospace and Defense
- 8.2.4. Energy and Mining
- 8.2.5. Education and Research
- 8.2.6. Electrical and Electronics
- 8.2.7. Other End-user Industries
- 8.1. Market Analysis, Insights and Forecast - by Deployment Type
- 9. Australia and New Zealand Simulation Software Industry Analysis, Insights and Forecast, 2019-2031
- 9.1. Market Analysis, Insights and Forecast - by Deployment Type
- 9.1.1. On-premise
- 9.1.2. Cloud
- 9.2. Market Analysis, Insights and Forecast - by End-user Industry
- 9.2.1. Automotive
- 9.2.2. IT and Telecommunication
- 9.2.3. Aerospace and Defense
- 9.2.4. Energy and Mining
- 9.2.5. Education and Research
- 9.2.6. Electrical and Electronics
- 9.2.7. Other End-user Industries
- 9.1. Market Analysis, Insights and Forecast - by Deployment Type
- 10. Latin America Simulation Software Industry Analysis, Insights and Forecast, 2019-2031
- 10.1. Market Analysis, Insights and Forecast - by Deployment Type
- 10.1.1. On-premise
- 10.1.2. Cloud
- 10.2. Market Analysis, Insights and Forecast - by End-user Industry
- 10.2.1. Automotive
- 10.2.2. IT and Telecommunication
- 10.2.3. Aerospace and Defense
- 10.2.4. Energy and Mining
- 10.2.5. Education and Research
- 10.2.6. Electrical and Electronics
- 10.2.7. Other End-user Industries
- 10.1. Market Analysis, Insights and Forecast - by Deployment Type
- 11. Middle East and Africa Simulation Software Industry Analysis, Insights and Forecast, 2019-2031
- 11.1. Market Analysis, Insights and Forecast - by Deployment Type
- 11.1.1. On-premise
- 11.1.2. Cloud
- 11.2. Market Analysis, Insights and Forecast - by End-user Industry
- 11.2.1. Automotive
- 11.2.2. IT and Telecommunication
- 11.2.3. Aerospace and Defense
- 11.2.4. Energy and Mining
- 11.2.5. Education and Research
- 11.2.6. Electrical and Electronics
- 11.2.7. Other End-user Industries
- 11.1. Market Analysis, Insights and Forecast - by Deployment Type
- 12. North America Simulation Software Industry Analysis, Insights and Forecast, 2019-2031
- 12.1. Market Analysis, Insights and Forecast - By Country/Sub-region
- 12.1.1 United States
- 12.1.2 Canada
- 12.1.3 Mexico
- 13. Europe Simulation Software Industry Analysis, Insights and Forecast, 2019-2031
- 13.1. Market Analysis, Insights and Forecast - By Country/Sub-region
- 13.1.1 Germany
- 13.1.2 United Kingdom
- 13.1.3 France
- 13.1.4 Spain
- 13.1.5 Italy
- 13.1.6 Spain
- 13.1.7 Belgium
- 13.1.8 Netherland
- 13.1.9 Nordics
- 13.1.10 Rest of Europe
- 14. Asia Pacific Simulation Software Industry Analysis, Insights and Forecast, 2019-2031
- 14.1. Market Analysis, Insights and Forecast - By Country/Sub-region
- 14.1.1 China
- 14.1.2 Japan
- 14.1.3 India
- 14.1.4 South Korea
- 14.1.5 Southeast Asia
- 14.1.6 Australia
- 14.1.7 Indonesia
- 14.1.8 Phillipes
- 14.1.9 Singapore
- 14.1.10 Thailandc
- 14.1.11 Rest of Asia Pacific
- 15. South America Simulation Software Industry Analysis, Insights and Forecast, 2019-2031
- 15.1. Market Analysis, Insights and Forecast - By Country/Sub-region
- 15.1.1 Brazil
- 15.1.2 Argentina
- 15.1.3 Peru
- 15.1.4 Chile
- 15.1.5 Colombia
- 15.1.6 Ecuador
- 15.1.7 Venezuela
- 15.1.8 Rest of South America
- 16. North America Simulation Software Industry Analysis, Insights and Forecast, 2019-2031
- 16.1. Market Analysis, Insights and Forecast - By Country/Sub-region
- 16.1.1 United States
- 16.1.2 Canada
- 16.1.3 Mexico
- 17. MEA Simulation Software Industry Analysis, Insights and Forecast, 2019-2031
- 17.1. Market Analysis, Insights and Forecast - By Country/Sub-region
- 17.1.1 United Arab Emirates
- 17.1.2 Saudi Arabia
- 17.1.3 South Africa
- 17.1.4 Rest of Middle East and Africa
- 18. Competitive Analysis
- 18.1. Global Market Share Analysis 2024
- 18.2. Company Profiles
- 18.2.1 CPFD Software LLC
- 18.2.1.1. Overview
- 18.2.1.2. Products
- 18.2.1.3. SWOT Analysis
- 18.2.1.4. Recent Developments
- 18.2.1.5. Financials (Based on Availability)
- 18.2.2 Bentley Systems Incorporated
- 18.2.2.1. Overview
- 18.2.2.2. Products
- 18.2.2.3. SWOT Analysis
- 18.2.2.4. Recent Developments
- 18.2.2.5. Financials (Based on Availability)
- 18.2.3 Ansys Inc
- 18.2.3.1. Overview
- 18.2.3.2. Products
- 18.2.3.3. SWOT Analysis
- 18.2.3.4. Recent Developments
- 18.2.3.5. Financials (Based on Availability)
- 18.2.4 Dassault Systèmes SE
- 18.2.4.1. Overview
- 18.2.4.2. Products
- 18.2.4.3. SWOT Analysis
- 18.2.4.4. Recent Developments
- 18.2.4.5. Financials (Based on Availability)
- 18.2.5 Design Simulation Technologies Inc
- 18.2.5.1. Overview
- 18.2.5.2. Products
- 18.2.5.3. SWOT Analysis
- 18.2.5.4. Recent Developments
- 18.2.5.5. Financials (Based on Availability)
- 18.2.6 Schneider Electric SE
- 18.2.6.1. Overview
- 18.2.6.2. Products
- 18.2.6.3. SWOT Analysis
- 18.2.6.4. Recent Developments
- 18.2.6.5. Financials (Based on Availability)
- 18.2.7 SolidWorks Corporation
- 18.2.7.1. Overview
- 18.2.7.2. Products
- 18.2.7.3. SWOT Analysis
- 18.2.7.4. Recent Developments
- 18.2.7.5. Financials (Based on Availability)
- 18.2.8 SIMUL8 Corporation
- 18.2.8.1. Overview
- 18.2.8.2. Products
- 18.2.8.3. SWOT Analysis
- 18.2.8.4. Recent Developments
- 18.2.8.5. Financials (Based on Availability)
- 18.2.9 Cybernet Systems Corp
- 18.2.9.1. Overview
- 18.2.9.2. Products
- 18.2.9.3. SWOT Analysis
- 18.2.9.4. Recent Developments
- 18.2.9.5. Financials (Based on Availability)
- 18.2.10 Simio LLC
- 18.2.10.1. Overview
- 18.2.10.2. Products
- 18.2.10.3. SWOT Analysis
- 18.2.10.4. Recent Developments
- 18.2.10.5. Financials (Based on Availability)
- 18.2.11 Siemens AG
- 18.2.11.1. Overview
- 18.2.11.2. Products
- 18.2.11.3. SWOT Analysis
- 18.2.11.4. Recent Developments
- 18.2.11.5. Financials (Based on Availability)
- 18.2.12 Altair Engineering Inc
- 18.2.12.1. Overview
- 18.2.12.2. Products
- 18.2.12.3. SWOT Analysis
- 18.2.12.4. Recent Developments
- 18.2.12.5. Financials (Based on Availability)
- 18.2.13 CONSELF Srl
- 18.2.13.1. Overview
- 18.2.13.2. Products
- 18.2.13.3. SWOT Analysis
- 18.2.13.4. Recent Developments
- 18.2.13.5. Financials (Based on Availability)
- 18.2.14 PTC Inc
- 18.2.14.1. Overview
- 18.2.14.2. Products
- 18.2.14.3. SWOT Analysis
- 18.2.14.4. Recent Developments
- 18.2.14.5. Financials (Based on Availability)
- 18.2.15 The MathWorks Inc
- 18.2.15.1. Overview
- 18.2.15.2. Products
- 18.2.15.3. SWOT Analysis
- 18.2.15.4. Recent Developments
- 18.2.15.5. Financials (Based on Availability)
- 18.2.16 Autodesk Inc
- 18.2.16.1. Overview
- 18.2.16.2. Products
- 18.2.16.3. SWOT Analysis
- 18.2.16.4. Recent Developments
- 18.2.16.5. Financials (Based on Availability)
- 18.2.17 Synopsys Inc
- 18.2.17.1. Overview
- 18.2.17.2. Products
- 18.2.17.3. SWOT Analysis
- 18.2.17.4. Recent Developments
- 18.2.17.5. Financials (Based on Availability)
- 18.2.18 Rockwell Automation Inc
- 18.2.18.1. Overview
- 18.2.18.2. Products
- 18.2.18.3. SWOT Analysis
- 18.2.18.4. Recent Developments
- 18.2.18.5. Financials (Based on Availability)
- 18.2.19 The COMSOL Group
- 18.2.19.1. Overview
- 18.2.19.2. Products
- 18.2.19.3. SWOT Analysis
- 18.2.19.4. Recent Developments
- 18.2.19.5. Financials (Based on Availability)
- 18.2.20 Lanner Group Ltd
- 18.2.20.1. Overview
- 18.2.20.2. Products
- 18.2.20.3. SWOT Analysis
- 18.2.20.4. Recent Developments
- 18.2.20.5. Financials (Based on Availability)
- 18.2.1 CPFD Software LLC
List of Figures
- Figure 1: Global Simulation Software Industry Revenue Breakdown (Million, %) by Region 2024 & 2032
- Figure 2: Global Simulation Software Industry Volume Breakdown (K Unit, %) by Region 2024 & 2032
- Figure 3: North America Simulation Software Industry Revenue (Million), by Country 2024 & 2032
- Figure 4: North America Simulation Software Industry Volume (K Unit), by Country 2024 & 2032
- Figure 5: North America Simulation Software Industry Revenue Share (%), by Country 2024 & 2032
- Figure 6: North America Simulation Software Industry Volume Share (%), by Country 2024 & 2032
- Figure 7: Europe Simulation Software Industry Revenue (Million), by Country 2024 & 2032
- Figure 8: Europe Simulation Software Industry Volume (K Unit), by Country 2024 & 2032
- Figure 9: Europe Simulation Software Industry Revenue Share (%), by Country 2024 & 2032
- Figure 10: Europe Simulation Software Industry Volume Share (%), by Country 2024 & 2032
- Figure 11: Asia Pacific Simulation Software Industry Revenue (Million), by Country 2024 & 2032
- Figure 12: Asia Pacific Simulation Software Industry Volume (K Unit), by Country 2024 & 2032
- Figure 13: Asia Pacific Simulation Software Industry Revenue Share (%), by Country 2024 & 2032
- Figure 14: Asia Pacific Simulation Software Industry Volume Share (%), by Country 2024 & 2032
- Figure 15: South America Simulation Software Industry Revenue (Million), by Country 2024 & 2032
- Figure 16: South America Simulation Software Industry Volume (K Unit), by Country 2024 & 2032
- Figure 17: South America Simulation Software Industry Revenue Share (%), by Country 2024 & 2032
- Figure 18: South America Simulation Software Industry Volume Share (%), by Country 2024 & 2032
- Figure 19: North America Simulation Software Industry Revenue (Million), by Country 2024 & 2032
- Figure 20: North America Simulation Software Industry Volume (K Unit), by Country 2024 & 2032
- Figure 21: North America Simulation Software Industry Revenue Share (%), by Country 2024 & 2032
- Figure 22: North America Simulation Software Industry Volume Share (%), by Country 2024 & 2032
- Figure 23: MEA Simulation Software Industry Revenue (Million), by Country 2024 & 2032
- Figure 24: MEA Simulation Software Industry Volume (K Unit), by Country 2024 & 2032
- Figure 25: MEA Simulation Software Industry Revenue Share (%), by Country 2024 & 2032
- Figure 26: MEA Simulation Software Industry Volume Share (%), by Country 2024 & 2032
- Figure 27: North America Simulation Software Industry Revenue (Million), by Deployment Type 2024 & 2032
- Figure 28: North America Simulation Software Industry Volume (K Unit), by Deployment Type 2024 & 2032
- Figure 29: North America Simulation Software Industry Revenue Share (%), by Deployment Type 2024 & 2032
- Figure 30: North America Simulation Software Industry Volume Share (%), by Deployment Type 2024 & 2032
- Figure 31: North America Simulation Software Industry Revenue (Million), by End-user Industry 2024 & 2032
- Figure 32: North America Simulation Software Industry Volume (K Unit), by End-user Industry 2024 & 2032
- Figure 33: North America Simulation Software Industry Revenue Share (%), by End-user Industry 2024 & 2032
- Figure 34: North America Simulation Software Industry Volume Share (%), by End-user Industry 2024 & 2032
- Figure 35: North America Simulation Software Industry Revenue (Million), by Country 2024 & 2032
- Figure 36: North America Simulation Software Industry Volume (K Unit), by Country 2024 & 2032
- Figure 37: North America Simulation Software Industry Revenue Share (%), by Country 2024 & 2032
- Figure 38: North America Simulation Software Industry Volume Share (%), by Country 2024 & 2032
- Figure 39: Europe Simulation Software Industry Revenue (Million), by Deployment Type 2024 & 2032
- Figure 40: Europe Simulation Software Industry Volume (K Unit), by Deployment Type 2024 & 2032
- Figure 41: Europe Simulation Software Industry Revenue Share (%), by Deployment Type 2024 & 2032
- Figure 42: Europe Simulation Software Industry Volume Share (%), by Deployment Type 2024 & 2032
- Figure 43: Europe Simulation Software Industry Revenue (Million), by End-user Industry 2024 & 2032
- Figure 44: Europe Simulation Software Industry Volume (K Unit), by End-user Industry 2024 & 2032
- Figure 45: Europe Simulation Software Industry Revenue Share (%), by End-user Industry 2024 & 2032
- Figure 46: Europe Simulation Software Industry Volume Share (%), by End-user Industry 2024 & 2032
- Figure 47: Europe Simulation Software Industry Revenue (Million), by Country 2024 & 2032
- Figure 48: Europe Simulation Software Industry Volume (K Unit), by Country 2024 & 2032
- Figure 49: Europe Simulation Software Industry Revenue Share (%), by Country 2024 & 2032
- Figure 50: Europe Simulation Software Industry Volume Share (%), by Country 2024 & 2032
- Figure 51: Asia Simulation Software Industry Revenue (Million), by Deployment Type 2024 & 2032
- Figure 52: Asia Simulation Software Industry Volume (K Unit), by Deployment Type 2024 & 2032
- Figure 53: Asia Simulation Software Industry Revenue Share (%), by Deployment Type 2024 & 2032
- Figure 54: Asia Simulation Software Industry Volume Share (%), by Deployment Type 2024 & 2032
- Figure 55: Asia Simulation Software Industry Revenue (Million), by End-user Industry 2024 & 2032
- Figure 56: Asia Simulation Software Industry Volume (K Unit), by End-user Industry 2024 & 2032
- Figure 57: Asia Simulation Software Industry Revenue Share (%), by End-user Industry 2024 & 2032
- Figure 58: Asia Simulation Software Industry Volume Share (%), by End-user Industry 2024 & 2032
- Figure 59: Asia Simulation Software Industry Revenue (Million), by Country 2024 & 2032
- Figure 60: Asia Simulation Software Industry Volume (K Unit), by Country 2024 & 2032
- Figure 61: Asia Simulation Software Industry Revenue Share (%), by Country 2024 & 2032
- Figure 62: Asia Simulation Software Industry Volume Share (%), by Country 2024 & 2032
- Figure 63: Australia and New Zealand Simulation Software Industry Revenue (Million), by Deployment Type 2024 & 2032
- Figure 64: Australia and New Zealand Simulation Software Industry Volume (K Unit), by Deployment Type 2024 & 2032
- Figure 65: Australia and New Zealand Simulation Software Industry Revenue Share (%), by Deployment Type 2024 & 2032
- Figure 66: Australia and New Zealand Simulation Software Industry Volume Share (%), by Deployment Type 2024 & 2032
- Figure 67: Australia and New Zealand Simulation Software Industry Revenue (Million), by End-user Industry 2024 & 2032
- Figure 68: Australia and New Zealand Simulation Software Industry Volume (K Unit), by End-user Industry 2024 & 2032
- Figure 69: Australia and New Zealand Simulation Software Industry Revenue Share (%), by End-user Industry 2024 & 2032
- Figure 70: Australia and New Zealand Simulation Software Industry Volume Share (%), by End-user Industry 2024 & 2032
- Figure 71: Australia and New Zealand Simulation Software Industry Revenue (Million), by Country 2024 & 2032
- Figure 72: Australia and New Zealand Simulation Software Industry Volume (K Unit), by Country 2024 & 2032
- Figure 73: Australia and New Zealand Simulation Software Industry Revenue Share (%), by Country 2024 & 2032
- Figure 74: Australia and New Zealand Simulation Software Industry Volume Share (%), by Country 2024 & 2032
- Figure 75: Latin America Simulation Software Industry Revenue (Million), by Deployment Type 2024 & 2032
- Figure 76: Latin America Simulation Software Industry Volume (K Unit), by Deployment Type 2024 & 2032
- Figure 77: Latin America Simulation Software Industry Revenue Share (%), by Deployment Type 2024 & 2032
- Figure 78: Latin America Simulation Software Industry Volume Share (%), by Deployment Type 2024 & 2032
- Figure 79: Latin America Simulation Software Industry Revenue (Million), by End-user Industry 2024 & 2032
- Figure 80: Latin America Simulation Software Industry Volume (K Unit), by End-user Industry 2024 & 2032
- Figure 81: Latin America Simulation Software Industry Revenue Share (%), by End-user Industry 2024 & 2032
- Figure 82: Latin America Simulation Software Industry Volume Share (%), by End-user Industry 2024 & 2032
- Figure 83: Latin America Simulation Software Industry Revenue (Million), by Country 2024 & 2032
- Figure 84: Latin America Simulation Software Industry Volume (K Unit), by Country 2024 & 2032
- Figure 85: Latin America Simulation Software Industry Revenue Share (%), by Country 2024 & 2032
- Figure 86: Latin America Simulation Software Industry Volume Share (%), by Country 2024 & 2032
- Figure 87: Middle East and Africa Simulation Software Industry Revenue (Million), by Deployment Type 2024 & 2032
- Figure 88: Middle East and Africa Simulation Software Industry Volume (K Unit), by Deployment Type 2024 & 2032
- Figure 89: Middle East and Africa Simulation Software Industry Revenue Share (%), by Deployment Type 2024 & 2032
- Figure 90: Middle East and Africa Simulation Software Industry Volume Share (%), by Deployment Type 2024 & 2032
- Figure 91: Middle East and Africa Simulation Software Industry Revenue (Million), by End-user Industry 2024 & 2032
- Figure 92: Middle East and Africa Simulation Software Industry Volume (K Unit), by End-user Industry 2024 & 2032
- Figure 93: Middle East and Africa Simulation Software Industry Revenue Share (%), by End-user Industry 2024 & 2032
- Figure 94: Middle East and Africa Simulation Software Industry Volume Share (%), by End-user Industry 2024 & 2032
- Figure 95: Middle East and Africa Simulation Software Industry Revenue (Million), by Country 2024 & 2032
- Figure 96: Middle East and Africa Simulation Software Industry Volume (K Unit), by Country 2024 & 2032
- Figure 97: Middle East and Africa Simulation Software Industry Revenue Share (%), by Country 2024 & 2032
- Figure 98: Middle East and Africa Simulation Software Industry Volume Share (%), by Country 2024 & 2032
List of Tables
- Table 1: Global Simulation Software Industry Revenue Million Forecast, by Region 2019 & 2032
- Table 2: Global Simulation Software Industry Volume K Unit Forecast, by Region 2019 & 2032
- Table 3: Global Simulation Software Industry Revenue Million Forecast, by Deployment Type 2019 & 2032
- Table 4: Global Simulation Software Industry Volume K Unit Forecast, by Deployment Type 2019 & 2032
- Table 5: Global Simulation Software Industry Revenue Million Forecast, by End-user Industry 2019 & 2032
- Table 6: Global Simulation Software Industry Volume K Unit Forecast, by End-user Industry 2019 & 2032
- Table 7: Global Simulation Software Industry Revenue Million Forecast, by Region 2019 & 2032
- Table 8: Global Simulation Software Industry Volume K Unit Forecast, by Region 2019 & 2032
- Table 9: Global Simulation Software Industry Revenue Million Forecast, by Country 2019 & 2032
- Table 10: Global Simulation Software Industry Volume K Unit Forecast, by Country 2019 & 2032
- Table 11: United States Simulation Software Industry Revenue (Million) Forecast, by Application 2019 & 2032
- Table 12: United States Simulation Software Industry Volume (K Unit) Forecast, by Application 2019 & 2032
- Table 13: Canada Simulation Software Industry Revenue (Million) Forecast, by Application 2019 & 2032
- Table 14: Canada Simulation Software Industry Volume (K Unit) Forecast, by Application 2019 & 2032
- Table 15: Mexico Simulation Software Industry Revenue (Million) Forecast, by Application 2019 & 2032
- Table 16: Mexico Simulation Software Industry Volume (K Unit) Forecast, by Application 2019 & 2032
- Table 17: Global Simulation Software Industry Revenue Million Forecast, by Country 2019 & 2032
- Table 18: Global Simulation Software Industry Volume K Unit Forecast, by Country 2019 & 2032
- Table 19: Germany Simulation Software Industry Revenue (Million) Forecast, by Application 2019 & 2032
- Table 20: Germany Simulation Software Industry Volume (K Unit) Forecast, by Application 2019 & 2032
- Table 21: United Kingdom Simulation Software Industry Revenue (Million) Forecast, by Application 2019 & 2032
- Table 22: United Kingdom Simulation Software Industry Volume (K Unit) Forecast, by Application 2019 & 2032
- Table 23: France Simulation Software Industry Revenue (Million) Forecast, by Application 2019 & 2032
- Table 24: France Simulation Software Industry Volume (K Unit) Forecast, by Application 2019 & 2032
- Table 25: Spain Simulation Software Industry Revenue (Million) Forecast, by Application 2019 & 2032
- Table 26: Spain Simulation Software Industry Volume (K Unit) Forecast, by Application 2019 & 2032
- Table 27: Italy Simulation Software Industry Revenue (Million) Forecast, by Application 2019 & 2032
- Table 28: Italy Simulation Software Industry Volume (K Unit) Forecast, by Application 2019 & 2032
- Table 29: Spain Simulation Software Industry Revenue (Million) Forecast, by Application 2019 & 2032
- Table 30: Spain Simulation Software Industry Volume (K Unit) Forecast, by Application 2019 & 2032
- Table 31: Belgium Simulation Software Industry Revenue (Million) Forecast, by Application 2019 & 2032
- Table 32: Belgium Simulation Software Industry Volume (K Unit) Forecast, by Application 2019 & 2032
- Table 33: Netherland Simulation Software Industry Revenue (Million) Forecast, by Application 2019 & 2032
- Table 34: Netherland Simulation Software Industry Volume (K Unit) Forecast, by Application 2019 & 2032
- Table 35: Nordics Simulation Software Industry Revenue (Million) Forecast, by Application 2019 & 2032
- Table 36: Nordics Simulation Software Industry Volume (K Unit) Forecast, by Application 2019 & 2032
- Table 37: Rest of Europe Simulation Software Industry Revenue (Million) Forecast, by Application 2019 & 2032
- Table 38: Rest of Europe Simulation Software Industry Volume (K Unit) Forecast, by Application 2019 & 2032
- Table 39: Global Simulation Software Industry Revenue Million Forecast, by Country 2019 & 2032
- Table 40: Global Simulation Software Industry Volume K Unit Forecast, by Country 2019 & 2032
- Table 41: China Simulation Software Industry Revenue (Million) Forecast, by Application 2019 & 2032
- Table 42: China Simulation Software Industry Volume (K Unit) Forecast, by Application 2019 & 2032
- Table 43: Japan Simulation Software Industry Revenue (Million) Forecast, by Application 2019 & 2032
- Table 44: Japan Simulation Software Industry Volume (K Unit) Forecast, by Application 2019 & 2032
- Table 45: India Simulation Software Industry Revenue (Million) Forecast, by Application 2019 & 2032
- Table 46: India Simulation Software Industry Volume (K Unit) Forecast, by Application 2019 & 2032
- Table 47: South Korea Simulation Software Industry Revenue (Million) Forecast, by Application 2019 & 2032
- Table 48: South Korea Simulation Software Industry Volume (K Unit) Forecast, by Application 2019 & 2032
- Table 49: Southeast Asia Simulation Software Industry Revenue (Million) Forecast, by Application 2019 & 2032
- Table 50: Southeast Asia Simulation Software Industry Volume (K Unit) Forecast, by Application 2019 & 2032
- Table 51: Australia Simulation Software Industry Revenue (Million) Forecast, by Application 2019 & 2032
- Table 52: Australia Simulation Software Industry Volume (K Unit) Forecast, by Application 2019 & 2032
- Table 53: Indonesia Simulation Software Industry Revenue (Million) Forecast, by Application 2019 & 2032
- Table 54: Indonesia Simulation Software Industry Volume (K Unit) Forecast, by Application 2019 & 2032
- Table 55: Phillipes Simulation Software Industry Revenue (Million) Forecast, by Application 2019 & 2032
- Table 56: Phillipes Simulation Software Industry Volume (K Unit) Forecast, by Application 2019 & 2032
- Table 57: Singapore Simulation Software Industry Revenue (Million) Forecast, by Application 2019 & 2032
- Table 58: Singapore Simulation Software Industry Volume (K Unit) Forecast, by Application 2019 & 2032
- Table 59: Thailandc Simulation Software Industry Revenue (Million) Forecast, by Application 2019 & 2032
- Table 60: Thailandc Simulation Software Industry Volume (K Unit) Forecast, by Application 2019 & 2032
- Table 61: Rest of Asia Pacific Simulation Software Industry Revenue (Million) Forecast, by Application 2019 & 2032
- Table 62: Rest of Asia Pacific Simulation Software Industry Volume (K Unit) Forecast, by Application 2019 & 2032
- Table 63: Global Simulation Software Industry Revenue Million Forecast, by Country 2019 & 2032
- Table 64: Global Simulation Software Industry Volume K Unit Forecast, by Country 2019 & 2032
- Table 65: Brazil Simulation Software Industry Revenue (Million) Forecast, by Application 2019 & 2032
- Table 66: Brazil Simulation Software Industry Volume (K Unit) Forecast, by Application 2019 & 2032
- Table 67: Argentina Simulation Software Industry Revenue (Million) Forecast, by Application 2019 & 2032
- Table 68: Argentina Simulation Software Industry Volume (K Unit) Forecast, by Application 2019 & 2032
- Table 69: Peru Simulation Software Industry Revenue (Million) Forecast, by Application 2019 & 2032
- Table 70: Peru Simulation Software Industry Volume (K Unit) Forecast, by Application 2019 & 2032
- Table 71: Chile Simulation Software Industry Revenue (Million) Forecast, by Application 2019 & 2032
- Table 72: Chile Simulation Software Industry Volume (K Unit) Forecast, by Application 2019 & 2032
- Table 73: Colombia Simulation Software Industry Revenue (Million) Forecast, by Application 2019 & 2032
- Table 74: Colombia Simulation Software Industry Volume (K Unit) Forecast, by Application 2019 & 2032
- Table 75: Ecuador Simulation Software Industry Revenue (Million) Forecast, by Application 2019 & 2032
- Table 76: Ecuador Simulation Software Industry Volume (K Unit) Forecast, by Application 2019 & 2032
- Table 77: Venezuela Simulation Software Industry Revenue (Million) Forecast, by Application 2019 & 2032
- Table 78: Venezuela Simulation Software Industry Volume (K Unit) Forecast, by Application 2019 & 2032
- Table 79: Rest of South America Simulation Software Industry Revenue (Million) Forecast, by Application 2019 & 2032
- Table 80: Rest of South America Simulation Software Industry Volume (K Unit) Forecast, by Application 2019 & 2032
- Table 81: Global Simulation Software Industry Revenue Million Forecast, by Country 2019 & 2032
- Table 82: Global Simulation Software Industry Volume K Unit Forecast, by Country 2019 & 2032
- Table 83: United States Simulation Software Industry Revenue (Million) Forecast, by Application 2019 & 2032
- Table 84: United States Simulation Software Industry Volume (K Unit) Forecast, by Application 2019 & 2032
- Table 85: Canada Simulation Software Industry Revenue (Million) Forecast, by Application 2019 & 2032
- Table 86: Canada Simulation Software Industry Volume (K Unit) Forecast, by Application 2019 & 2032
- Table 87: Mexico Simulation Software Industry Revenue (Million) Forecast, by Application 2019 & 2032
- Table 88: Mexico Simulation Software Industry Volume (K Unit) Forecast, by Application 2019 & 2032
- Table 89: Global Simulation Software Industry Revenue Million Forecast, by Country 2019 & 2032
- Table 90: Global Simulation Software Industry Volume K Unit Forecast, by Country 2019 & 2032
- Table 91: United Arab Emirates Simulation Software Industry Revenue (Million) Forecast, by Application 2019 & 2032
- Table 92: United Arab Emirates Simulation Software Industry Volume (K Unit) Forecast, by Application 2019 & 2032
- Table 93: Saudi Arabia Simulation Software Industry Revenue (Million) Forecast, by Application 2019 & 2032
- Table 94: Saudi Arabia Simulation Software Industry Volume (K Unit) Forecast, by Application 2019 & 2032
- Table 95: South Africa Simulation Software Industry Revenue (Million) Forecast, by Application 2019 & 2032
- Table 96: South Africa Simulation Software Industry Volume (K Unit) Forecast, by Application 2019 & 2032
- Table 97: Rest of Middle East and Africa Simulation Software Industry Revenue (Million) Forecast, by Application 2019 & 2032
- Table 98: Rest of Middle East and Africa Simulation Software Industry Volume (K Unit) Forecast, by Application 2019 & 2032
- Table 99: Global Simulation Software Industry Revenue Million Forecast, by Deployment Type 2019 & 2032
- Table 100: Global Simulation Software Industry Volume K Unit Forecast, by Deployment Type 2019 & 2032
- Table 101: Global Simulation Software Industry Revenue Million Forecast, by End-user Industry 2019 & 2032
- Table 102: Global Simulation Software Industry Volume K Unit Forecast, by End-user Industry 2019 & 2032
- Table 103: Global Simulation Software Industry Revenue Million Forecast, by Country 2019 & 2032
- Table 104: Global Simulation Software Industry Volume K Unit Forecast, by Country 2019 & 2032
- Table 105: Global Simulation Software Industry Revenue Million Forecast, by Deployment Type 2019 & 2032
- Table 106: Global Simulation Software Industry Volume K Unit Forecast, by Deployment Type 2019 & 2032
- Table 107: Global Simulation Software Industry Revenue Million Forecast, by End-user Industry 2019 & 2032
- Table 108: Global Simulation Software Industry Volume K Unit Forecast, by End-user Industry 2019 & 2032
- Table 109: Global Simulation Software Industry Revenue Million Forecast, by Country 2019 & 2032
- Table 110: Global Simulation Software Industry Volume K Unit Forecast, by Country 2019 & 2032
- Table 111: Global Simulation Software Industry Revenue Million Forecast, by Deployment Type 2019 & 2032
- Table 112: Global Simulation Software Industry Volume K Unit Forecast, by Deployment Type 2019 & 2032
- Table 113: Global Simulation Software Industry Revenue Million Forecast, by End-user Industry 2019 & 2032
- Table 114: Global Simulation Software Industry Volume K Unit Forecast, by End-user Industry 2019 & 2032
- Table 115: Global Simulation Software Industry Revenue Million Forecast, by Country 2019 & 2032
- Table 116: Global Simulation Software Industry Volume K Unit Forecast, by Country 2019 & 2032
- Table 117: Global Simulation Software Industry Revenue Million Forecast, by Deployment Type 2019 & 2032
- Table 118: Global Simulation Software Industry Volume K Unit Forecast, by Deployment Type 2019 & 2032
- Table 119: Global Simulation Software Industry Revenue Million Forecast, by End-user Industry 2019 & 2032
- Table 120: Global Simulation Software Industry Volume K Unit Forecast, by End-user Industry 2019 & 2032
- Table 121: Global Simulation Software Industry Revenue Million Forecast, by Country 2019 & 2032
- Table 122: Global Simulation Software Industry Volume K Unit Forecast, by Country 2019 & 2032
- Table 123: Global Simulation Software Industry Revenue Million Forecast, by Deployment Type 2019 & 2032
- Table 124: Global Simulation Software Industry Volume K Unit Forecast, by Deployment Type 2019 & 2032
- Table 125: Global Simulation Software Industry Revenue Million Forecast, by End-user Industry 2019 & 2032
- Table 126: Global Simulation Software Industry Volume K Unit Forecast, by End-user Industry 2019 & 2032
- Table 127: Global Simulation Software Industry Revenue Million Forecast, by Country 2019 & 2032
- Table 128: Global Simulation Software Industry Volume K Unit Forecast, by Country 2019 & 2032
- Table 129: Global Simulation Software Industry Revenue Million Forecast, by Deployment Type 2019 & 2032
- Table 130: Global Simulation Software Industry Volume K Unit Forecast, by Deployment Type 2019 & 2032
- Table 131: Global Simulation Software Industry Revenue Million Forecast, by End-user Industry 2019 & 2032
- Table 132: Global Simulation Software Industry Volume K Unit Forecast, by End-user Industry 2019 & 2032
- Table 133: Global Simulation Software Industry Revenue Million Forecast, by Country 2019 & 2032
- Table 134: Global Simulation Software Industry Volume K Unit Forecast, by Country 2019 & 2032
Frequently Asked Questions
1. What is the projected Compound Annual Growth Rate (CAGR) of the Simulation Software Industry?
The projected CAGR is approximately 12.06%.
2. Which companies are prominent players in the Simulation Software Industry?
Key companies in the market include CPFD Software LLC, Bentley Systems Incorporated, Ansys Inc, Dassault Systèmes SE, Design Simulation Technologies Inc, Schneider Electric SE, SolidWorks Corporation, SIMUL8 Corporation, Cybernet Systems Corp, Simio LLC, Siemens AG, Altair Engineering Inc, CONSELF Srl, PTC Inc, The MathWorks Inc, Autodesk Inc, Synopsys Inc, Rockwell Automation Inc, The COMSOL Group, Lanner Group Ltd.
3. What are the main segments of the Simulation Software Industry?
The market segments include Deployment Type, End-user Industry.
4. Can you provide details about the market size?
The market size is estimated to be USD 12.12 Million as of 2022.
5. What are some drivers contributing to market growth?
Growing Automotive Sector.
6. What are the notable trends driving market growth?
Automotive Segment is expected grow at a faster pace..
7. Are there any restraints impacting market growth?
Fluctuating Market Demands and Customization Issues.
8. Can you provide examples of recent developments in the market?
In March 2023, Simulations Plus, Inc., a provider of modeling and simulation software and services for pharmaceutical protection and effectiveness, announced that it joined into a cooperative research contract with the Institute of Medical Biology of the Polish Academy of Sciences to develop new compounds for the RORγ/RORγT nuclear receptors using its advanced artificial intelligence machine learning technology in the ADMET Predictor software platform.
9. What pricing options are available for accessing the report?
Pricing options include single-user, multi-user, and enterprise licenses priced at USD 4750, USD 5250, and USD 8750 respectively.
10. Is the market size provided in terms of value or volume?
The market size is provided in terms of value, measured in Million and volume, measured in K Unit.
11. Are there any specific market keywords associated with the report?
Yes, the market keyword associated with the report is "Simulation Software Industry," which aids in identifying and referencing the specific market segment covered.
12. How do I determine which pricing option suits my needs best?
The pricing options vary based on user requirements and access needs. Individual users may opt for single-user licenses, while businesses requiring broader access may choose multi-user or enterprise licenses for cost-effective access to the report.
13. Are there any additional resources or data provided in the Simulation Software Industry report?
While the report offers comprehensive insights, it's advisable to review the specific contents or supplementary materials provided to ascertain if additional resources or data are available.
14. How can I stay updated on further developments or reports in the Simulation Software Industry?
To stay informed about further developments, trends, and reports in the Simulation Software Industry, consider subscribing to industry newsletters, following relevant companies and organizations, or regularly checking reputable industry news sources and publications.
Methodology
Step 1 - Identification of Relevant Samples Size from Population Database


Step 2 - Approaches for Defining Global Market Size (Value, Volume* & Price*)

Note*: In applicable scenarios
Step 3 - Data Sources
Primary Research
- Web Analytics
- Survey Reports
- Research Institute
- Latest Research Reports
- Opinion Leaders
Secondary Research
- Annual Reports
- White Paper
- Latest Press Release
- Industry Association
- Paid Database
- Investor Presentations

Step 4 - Data Triangulation
Involves using different sources of information in order to increase the validity of a study
These sources are likely to be stakeholders in a program - participants, other researchers, program staff, other community members, and so on.
Then we put all data in single framework & apply various statistical tools to find out the dynamic on the market.
During the analysis stage, feedback from the stakeholder groups would be compared to determine areas of agreement as well as areas of divergence
