

Key Insights
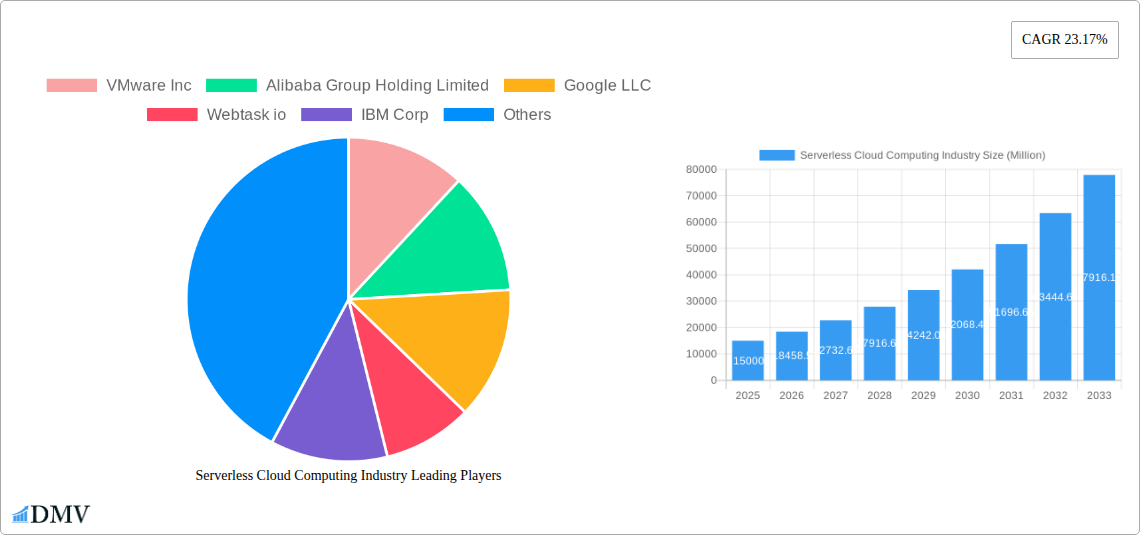
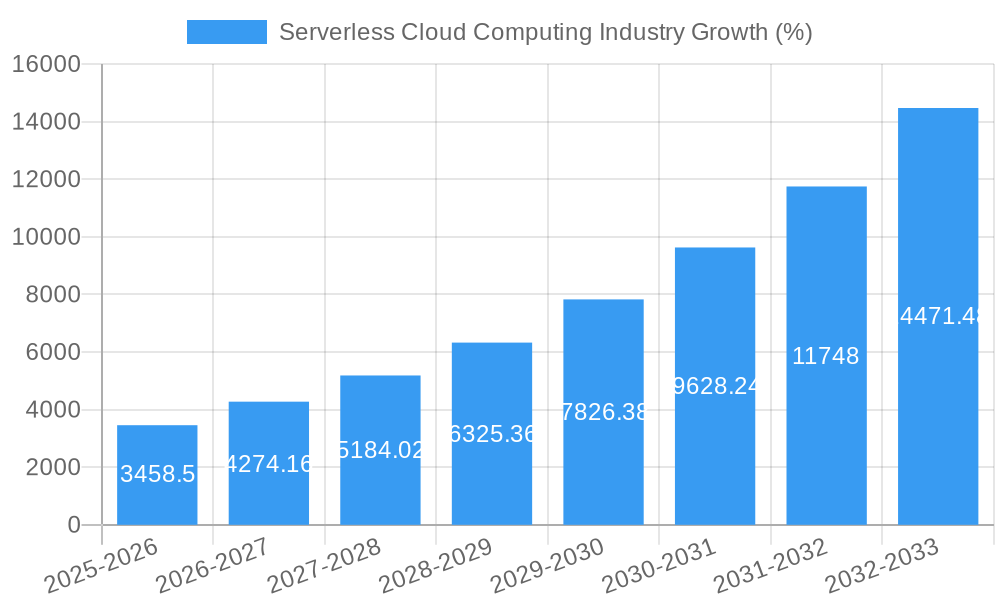
The serverless cloud computing market is experiencing explosive growth, projected to reach a substantial size by 2033. Driven by the increasing demand for scalability, cost optimization, and faster application deployment, the market's Compound Annual Growth Rate (CAGR) of 23.17% reflects a strong upward trajectory. Key drivers include the rising adoption of microservices architecture, the need for efficient resource utilization, and the increasing complexity of modern applications. The shift towards hybrid and multi-cloud environments is further fueling this growth, as businesses seek greater flexibility and resilience in their IT infrastructure. Significant market segments include professional and managed services, with hybrid and multi-cloud deployments leading the way across diverse end-user industries like IT & Telecommunications, BFSI (Banking, Financial Services, and Insurance), Retail, and Government. Leading players such as Amazon Web Services (AWS), Microsoft Azure, Google Cloud Platform (GCP), and others are actively shaping the market landscape through continuous innovation and aggressive expansion strategies. The market is witnessing a surge in the adoption of serverless functions across various applications, including mobile backends, data processing, and IoT (Internet of Things) solutions. While challenges like security concerns and vendor lock-in exist, the overall trend points toward sustained and rapid growth, driven by the compelling advantages of serverless computing.
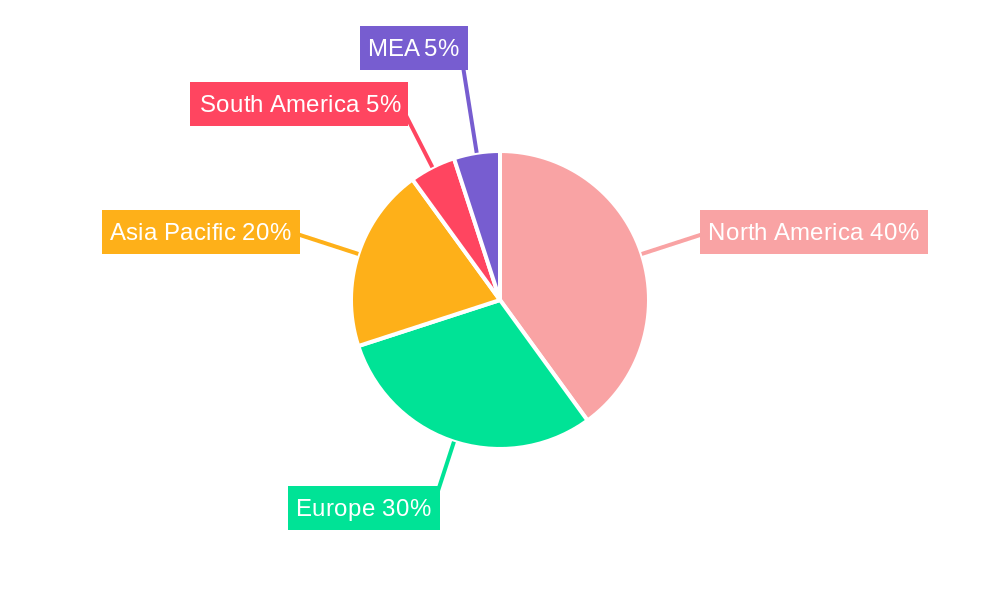
The geographical distribution of the serverless cloud computing market demonstrates a strong presence in North America and Europe, with Asia-Pacific emerging as a rapidly expanding region. The United States, Canada, the United Kingdom, Germany, and China are key contributors to market revenue. However, significant growth opportunities exist in other regions, particularly in developing economies experiencing rapid digital transformation. The competitive landscape is highly dynamic, with major cloud providers continuously expanding their serverless offerings and startups innovating with specialized solutions. This dynamic competition fosters innovation and drives down costs, making serverless technology accessible to a broader range of businesses. Future growth will be significantly influenced by the advancement of serverless technologies, improved security measures, and wider industry adoption across diverse sectors. The ongoing evolution of serverless frameworks and tools will further contribute to the market's expansion in the coming years.
Serverless Cloud Computing Industry: A Comprehensive Market Report (2019-2033)
This insightful report provides a comprehensive analysis of the Serverless Cloud Computing industry, encompassing market trends, leading players, technological advancements, and future growth prospects. With a study period spanning 2019-2033, a base year of 2025, and a forecast period of 2025-2033, this report offers invaluable data-driven insights for stakeholders seeking to navigate this dynamic market. The global serverless cloud computing market is projected to reach $xx Million by 2033.
Serverless Cloud Computing Industry Market Composition & Trends
This section delves into the intricate composition of the serverless cloud computing market, examining its concentration, innovation drivers, regulatory landscape, substitute products, end-user profiles, and mergers & acquisitions (M&A) activities. The market exhibits a moderately concentrated landscape, with key players like Amazon Web Services, Microsoft Azure, and Google Cloud Platform holding significant market share. However, the emergence of niche players and open-source solutions is fostering increased competition.
Market Share Distribution (Estimated 2025):
- Amazon Web Services Inc: 35%
- Microsoft Corp: 28%
- Google LLC: 20%
- Alibaba Group Holding Limited: 8%
- Others: 9%
Innovation Catalysts: The industry is driven by advancements in AI/ML, containerization technologies, and the growing demand for scalable and cost-effective cloud solutions. Regulatory landscapes vary across regions, influencing data privacy and security compliance. While serverless computing offers advantages over traditional infrastructure, potential substitute products include on-premise solutions and managed hosting services.
End-User Profiles: The market caters to a diverse range of end-users across IT & Telecommunication, BFSI, Retail, Government, Industrial, and other sectors. Each sector exhibits unique needs and adoption rates.
M&A Activities: The serverless cloud computing market has witnessed significant M&A activity in recent years, with deal values exceeding $xx Million in the historical period (2019-2024). These activities demonstrate consolidation and expansion strategies among major players. Further analysis reveals that a significant portion of these deals focused on acquiring specialized expertise in areas such as AI/ML and security.
Serverless Cloud Computing Industry Evolution
The serverless cloud computing market has experienced exponential growth during the historical period (2019-2024), fueled by increasing cloud adoption, the rise of microservices architecture, and the need for enhanced agility and cost optimization. The Compound Annual Growth Rate (CAGR) during this period was approximately xx%, reflecting significant market expansion. Technological advancements such as serverless frameworks, improved scalability, and enhanced security features have further propelled growth. Shifting consumer demands, driven by the need for real-time data processing and faster application deployment, are shaping the evolution of serverless technologies. The adoption rate is highest among companies with high digital transformation initiatives and extensive cloud infrastructure. We predict the market will continue on its upward trajectory with a projected CAGR of xx% during the forecast period (2025-2033), reaching $xx Million by 2033.
Leading Regions, Countries, or Segments in Serverless Cloud Computing Industry
The North American region currently dominates the serverless cloud computing market, driven by high cloud adoption rates, strong technological infrastructure, and substantial investments in digital transformation initiatives. However, Asia-Pacific is expected to experience the fastest growth in the coming years due to expanding digital economies and increasing government support for cloud technology adoption.
Key Drivers by Segment:
- By Service: Managed services represent a larger segment due to reduced operational overhead and ease of use. However, the professional services segment is experiencing robust growth driven by the increasing need for specialized expertise in designing and deploying serverless applications.
- By Type: Multi-cloud deployments are gaining traction as businesses strive for vendor independence and enhanced resilience. Hybrid cloud deployments remain significant, catering to organizations with existing on-premise infrastructure.
- By End-user Industry: The IT & Telecommunication sector currently leads in serverless adoption due to its high dependency on scalable and flexible infrastructure. However, the BFSI sector is witnessing significant growth owing to stringent security requirements and the need for efficient data processing.
Serverless Cloud Computing Industry Product Innovations
Recent innovations include advancements in serverless functions, enhanced integration with other cloud services, and the introduction of serverless databases and AI/ML capabilities. These improvements provide developers with greater flexibility, scalability, and ease of use. Unique selling propositions include cost optimization, faster deployment times, and improved resource utilization, enabling businesses to focus on core functionalities while minimizing infrastructure management complexities.
Propelling Factors for Serverless Cloud Computing Industry Growth
Several factors are fueling the growth of the serverless cloud computing market. Technological advancements, such as enhanced scalability and improved security features, are significantly contributing to its expansion. Economically, serverless computing’s pay-as-you-go model attracts cost-conscious businesses. Favorable regulatory environments in some regions promote cloud adoption and boost market growth. The increasing adoption of DevOps methodologies and the rise of microservices architectures further strengthen the industry’s growth trajectory.
Obstacles in the Serverless Cloud Computing Industry Market
Despite its rapid growth, the serverless cloud computing market faces challenges. Vendor lock-in is a significant concern, as businesses may become overly reliant on a single cloud provider. Complexity in migrating existing applications to serverless architectures and the lack of skilled personnel can hinder adoption. Security concerns related to data breaches and vulnerabilities also pose significant obstacles. These factors, combined with potential supply chain disruptions, could impede market growth to some degree.
Future Opportunities in Serverless Cloud Computing Industry
Emerging opportunities exist in several areas. The expansion of serverless computing into edge computing environments will allow for faster processing speeds and lower latency. The integration of serverless functions with IoT devices will facilitate the development of intelligent and connected applications. New markets, such as the healthcare and education sectors, present significant growth potential as cloud adoption increases. Furthermore, advancements in AI and Machine Learning integrated with serverless functions will lead to innovative applications across various industries.
Major Players in the Serverless Cloud Computing Industry Ecosystem
- VMware Inc
- Alibaba Group Holding Limited
- Google LLC
- Webtask io
- IBM Corp
- Amazon Web Services Inc
- Oracle Corp
- Iron io
- Microsoft Corp
- SAP SE
Key Developments in Serverless Cloud Computing Industry
- September 2022: Google Cloud Logging launched Log Analytics powered by BigQuery, enabling users to perform advanced log analytics.
- November 2022: Alibaba Cloud introduced ModelScope, an open-source Model-as-a-Service (MaaS) platform offering a wide range of pre-trained AI models.
Strategic Serverless Cloud Computing Industry Market Forecast
The serverless cloud computing market is poised for continued growth, driven by technological innovations, increasing cloud adoption, and the expanding demand for scalable and cost-effective solutions. The market's future potential is substantial, with opportunities for significant expansion across various sectors and geographies. Continued investment in research and development, coupled with strategic partnerships and acquisitions, will shape the industry’s trajectory in the years to come. The predicted CAGR and market size for 2025-2033 paint a picture of substantial growth potential, indicating a promising outlook for investors and participants in this dynamic sector.
Serverless Cloud Computing Industry Segmentation
-
1. Service
- 1.1. Professional
- 1.2. Managed
-
2. Type
- 2.1. Hybrid Cloud
- 2.2. Multi-Cloud
-
3. End-user Industyr
- 3.1. IT & Telecommunication
- 3.2. BFSI
- 3.3. Retail
- 3.4. Government
- 3.5. Industrial
- 3.6. Other End-user Industries
Serverless Cloud Computing Industry Segmentation By Geography
- 1. North America
- 2. Europe
- 3. Asia Pacific
- 4. Latin America
- 5. Middle East
Serverless Cloud Computing Industry REPORT HIGHLIGHTS
| Aspects | Details |
|---|---|
| Study Period | 2019-2033 |
| Base Year | 2024 |
| Estimated Year | 2025 |
| Forecast Period | 2025-2033 |
| Historical Period | 2019-2024 |
| Growth Rate | CAGR of 23.17% from 2019-2033 |
| Segmentation |
|
Table of Contents
- 1. Introduction
- 1.1. Research Scope
- 1.2. Market Segmentation
- 1.3. Research Methodology
- 1.4. Definitions and Assumptions
- 2. Executive Summary
- 2.1. Introduction
- 3. Market Dynamics
- 3.1. Introduction
- 3.2. Market Drivers
- 3.2.1 Growth in Enhanced Scalability
- 3.2.2 Decreased in Time-To-Market Along with Reduced Operational Cost; Proliferation of the Microservices Architecture Across Organization's Business Model; Increase in demand of Professional services globally to drive the market
- 3.3. Market Restrains
- 3.3.1. Loss of Control on Security in Case of Attack
- 3.4. Market Trends
- 3.4.1. Professional Services are Expected to Grow at a Significant Rate
- 4. Market Factor Analysis
- 4.1. Porters Five Forces
- 4.2. Supply/Value Chain
- 4.3. PESTEL analysis
- 4.4. Market Entropy
- 4.5. Patent/Trademark Analysis
- 5. Global Serverless Cloud Computing Industry Analysis, Insights and Forecast, 2019-2031
- 5.1. Market Analysis, Insights and Forecast - by Service
- 5.1.1. Professional
- 5.1.2. Managed
- 5.2. Market Analysis, Insights and Forecast - by Type
- 5.2.1. Hybrid Cloud
- 5.2.2. Multi-Cloud
- 5.3. Market Analysis, Insights and Forecast - by End-user Industyr
- 5.3.1. IT & Telecommunication
- 5.3.2. BFSI
- 5.3.3. Retail
- 5.3.4. Government
- 5.3.5. Industrial
- 5.3.6. Other End-user Industries
- 5.4. Market Analysis, Insights and Forecast - by Region
- 5.4.1. North America
- 5.4.2. Europe
- 5.4.3. Asia Pacific
- 5.4.4. Latin America
- 5.4.5. Middle East
- 5.1. Market Analysis, Insights and Forecast - by Service
- 6. North America Serverless Cloud Computing Industry Analysis, Insights and Forecast, 2019-2031
- 6.1. Market Analysis, Insights and Forecast - by Service
- 6.1.1. Professional
- 6.1.2. Managed
- 6.2. Market Analysis, Insights and Forecast - by Type
- 6.2.1. Hybrid Cloud
- 6.2.2. Multi-Cloud
- 6.3. Market Analysis, Insights and Forecast - by End-user Industyr
- 6.3.1. IT & Telecommunication
- 6.3.2. BFSI
- 6.3.3. Retail
- 6.3.4. Government
- 6.3.5. Industrial
- 6.3.6. Other End-user Industries
- 6.1. Market Analysis, Insights and Forecast - by Service
- 7. Europe Serverless Cloud Computing Industry Analysis, Insights and Forecast, 2019-2031
- 7.1. Market Analysis, Insights and Forecast - by Service
- 7.1.1. Professional
- 7.1.2. Managed
- 7.2. Market Analysis, Insights and Forecast - by Type
- 7.2.1. Hybrid Cloud
- 7.2.2. Multi-Cloud
- 7.3. Market Analysis, Insights and Forecast - by End-user Industyr
- 7.3.1. IT & Telecommunication
- 7.3.2. BFSI
- 7.3.3. Retail
- 7.3.4. Government
- 7.3.5. Industrial
- 7.3.6. Other End-user Industries
- 7.1. Market Analysis, Insights and Forecast - by Service
- 8. Asia Pacific Serverless Cloud Computing Industry Analysis, Insights and Forecast, 2019-2031
- 8.1. Market Analysis, Insights and Forecast - by Service
- 8.1.1. Professional
- 8.1.2. Managed
- 8.2. Market Analysis, Insights and Forecast - by Type
- 8.2.1. Hybrid Cloud
- 8.2.2. Multi-Cloud
- 8.3. Market Analysis, Insights and Forecast - by End-user Industyr
- 8.3.1. IT & Telecommunication
- 8.3.2. BFSI
- 8.3.3. Retail
- 8.3.4. Government
- 8.3.5. Industrial
- 8.3.6. Other End-user Industries
- 8.1. Market Analysis, Insights and Forecast - by Service
- 9. Latin America Serverless Cloud Computing Industry Analysis, Insights and Forecast, 2019-2031
- 9.1. Market Analysis, Insights and Forecast - by Service
- 9.1.1. Professional
- 9.1.2. Managed
- 9.2. Market Analysis, Insights and Forecast - by Type
- 9.2.1. Hybrid Cloud
- 9.2.2. Multi-Cloud
- 9.3. Market Analysis, Insights and Forecast - by End-user Industyr
- 9.3.1. IT & Telecommunication
- 9.3.2. BFSI
- 9.3.3. Retail
- 9.3.4. Government
- 9.3.5. Industrial
- 9.3.6. Other End-user Industries
- 9.1. Market Analysis, Insights and Forecast - by Service
- 10. Middle East Serverless Cloud Computing Industry Analysis, Insights and Forecast, 2019-2031
- 10.1. Market Analysis, Insights and Forecast - by Service
- 10.1.1. Professional
- 10.1.2. Managed
- 10.2. Market Analysis, Insights and Forecast - by Type
- 10.2.1. Hybrid Cloud
- 10.2.2. Multi-Cloud
- 10.3. Market Analysis, Insights and Forecast - by End-user Industyr
- 10.3.1. IT & Telecommunication
- 10.3.2. BFSI
- 10.3.3. Retail
- 10.3.4. Government
- 10.3.5. Industrial
- 10.3.6. Other End-user Industries
- 10.1. Market Analysis, Insights and Forecast - by Service
- 11. North America Serverless Cloud Computing Industry Analysis, Insights and Forecast, 2019-2031
- 11.1. Market Analysis, Insights and Forecast - By Country/Sub-region
- 11.1.1 United States
- 11.1.2 Canada
- 11.1.3 Mexico
- 12. Europe Serverless Cloud Computing Industry Analysis, Insights and Forecast, 2019-2031
- 12.1. Market Analysis, Insights and Forecast - By Country/Sub-region
- 12.1.1 Germany
- 12.1.2 United Kingdom
- 12.1.3 France
- 12.1.4 Spain
- 12.1.5 Italy
- 12.1.6 Spain
- 12.1.7 Belgium
- 12.1.8 Netherland
- 12.1.9 Nordics
- 12.1.10 Rest of Europe
- 13. Asia Pacific Serverless Cloud Computing Industry Analysis, Insights and Forecast, 2019-2031
- 13.1. Market Analysis, Insights and Forecast - By Country/Sub-region
- 13.1.1 China
- 13.1.2 Japan
- 13.1.3 India
- 13.1.4 South Korea
- 13.1.5 Southeast Asia
- 13.1.6 Australia
- 13.1.7 Indonesia
- 13.1.8 Phillipes
- 13.1.9 Singapore
- 13.1.10 Thailandc
- 13.1.11 Rest of Asia Pacific
- 14. South America Serverless Cloud Computing Industry Analysis, Insights and Forecast, 2019-2031
- 14.1. Market Analysis, Insights and Forecast - By Country/Sub-region
- 14.1.1 Brazil
- 14.1.2 Argentina
- 14.1.3 Peru
- 14.1.4 Chile
- 14.1.5 Colombia
- 14.1.6 Ecuador
- 14.1.7 Venezuela
- 14.1.8 Rest of South America
- 15. North America Serverless Cloud Computing Industry Analysis, Insights and Forecast, 2019-2031
- 15.1. Market Analysis, Insights and Forecast - By Country/Sub-region
- 15.1.1 United States
- 15.1.2 Canada
- 15.1.3 Mexico
- 16. MEA Serverless Cloud Computing Industry Analysis, Insights and Forecast, 2019-2031
- 16.1. Market Analysis, Insights and Forecast - By Country/Sub-region
- 16.1.1 United Arab Emirates
- 16.1.2 Saudi Arabia
- 16.1.3 South Africa
- 16.1.4 Rest of Middle East and Africa
- 17. Competitive Analysis
- 17.1. Global Market Share Analysis 2024
- 17.2. Company Profiles
- 17.2.1 VMware Inc
- 17.2.1.1. Overview
- 17.2.1.2. Products
- 17.2.1.3. SWOT Analysis
- 17.2.1.4. Recent Developments
- 17.2.1.5. Financials (Based on Availability)
- 17.2.2 Alibaba Group Holding Limited
- 17.2.2.1. Overview
- 17.2.2.2. Products
- 17.2.2.3. SWOT Analysis
- 17.2.2.4. Recent Developments
- 17.2.2.5. Financials (Based on Availability)
- 17.2.3 Google LLC
- 17.2.3.1. Overview
- 17.2.3.2. Products
- 17.2.3.3. SWOT Analysis
- 17.2.3.4. Recent Developments
- 17.2.3.5. Financials (Based on Availability)
- 17.2.4 Webtask io
- 17.2.4.1. Overview
- 17.2.4.2. Products
- 17.2.4.3. SWOT Analysis
- 17.2.4.4. Recent Developments
- 17.2.4.5. Financials (Based on Availability)
- 17.2.5 IBM Corp
- 17.2.5.1. Overview
- 17.2.5.2. Products
- 17.2.5.3. SWOT Analysis
- 17.2.5.4. Recent Developments
- 17.2.5.5. Financials (Based on Availability)
- 17.2.6 Amazon Web Services Inc
- 17.2.6.1. Overview
- 17.2.6.2. Products
- 17.2.6.3. SWOT Analysis
- 17.2.6.4. Recent Developments
- 17.2.6.5. Financials (Based on Availability)
- 17.2.7 Oracle Corp
- 17.2.7.1. Overview
- 17.2.7.2. Products
- 17.2.7.3. SWOT Analysis
- 17.2.7.4. Recent Developments
- 17.2.7.5. Financials (Based on Availability)
- 17.2.8 Iron io
- 17.2.8.1. Overview
- 17.2.8.2. Products
- 17.2.8.3. SWOT Analysis
- 17.2.8.4. Recent Developments
- 17.2.8.5. Financials (Based on Availability)
- 17.2.9 Microsoft Corp
- 17.2.9.1. Overview
- 17.2.9.2. Products
- 17.2.9.3. SWOT Analysis
- 17.2.9.4. Recent Developments
- 17.2.9.5. Financials (Based on Availability)
- 17.2.10 SAP SE
- 17.2.10.1. Overview
- 17.2.10.2. Products
- 17.2.10.3. SWOT Analysis
- 17.2.10.4. Recent Developments
- 17.2.10.5. Financials (Based on Availability)
- 17.2.1 VMware Inc
List of Figures
- Figure 1: Global Serverless Cloud Computing Industry Revenue Breakdown (Million, %) by Region 2024 & 2032
- Figure 2: Global Serverless Cloud Computing Industry Volume Breakdown (K Unit, %) by Region 2024 & 2032
- Figure 3: North America Serverless Cloud Computing Industry Revenue (Million), by Country 2024 & 2032
- Figure 4: North America Serverless Cloud Computing Industry Volume (K Unit), by Country 2024 & 2032
- Figure 5: North America Serverless Cloud Computing Industry Revenue Share (%), by Country 2024 & 2032
- Figure 6: North America Serverless Cloud Computing Industry Volume Share (%), by Country 2024 & 2032
- Figure 7: Europe Serverless Cloud Computing Industry Revenue (Million), by Country 2024 & 2032
- Figure 8: Europe Serverless Cloud Computing Industry Volume (K Unit), by Country 2024 & 2032
- Figure 9: Europe Serverless Cloud Computing Industry Revenue Share (%), by Country 2024 & 2032
- Figure 10: Europe Serverless Cloud Computing Industry Volume Share (%), by Country 2024 & 2032
- Figure 11: Asia Pacific Serverless Cloud Computing Industry Revenue (Million), by Country 2024 & 2032
- Figure 12: Asia Pacific Serverless Cloud Computing Industry Volume (K Unit), by Country 2024 & 2032
- Figure 13: Asia Pacific Serverless Cloud Computing Industry Revenue Share (%), by Country 2024 & 2032
- Figure 14: Asia Pacific Serverless Cloud Computing Industry Volume Share (%), by Country 2024 & 2032
- Figure 15: South America Serverless Cloud Computing Industry Revenue (Million), by Country 2024 & 2032
- Figure 16: South America Serverless Cloud Computing Industry Volume (K Unit), by Country 2024 & 2032
- Figure 17: South America Serverless Cloud Computing Industry Revenue Share (%), by Country 2024 & 2032
- Figure 18: South America Serverless Cloud Computing Industry Volume Share (%), by Country 2024 & 2032
- Figure 19: North America Serverless Cloud Computing Industry Revenue (Million), by Country 2024 & 2032
- Figure 20: North America Serverless Cloud Computing Industry Volume (K Unit), by Country 2024 & 2032
- Figure 21: North America Serverless Cloud Computing Industry Revenue Share (%), by Country 2024 & 2032
- Figure 22: North America Serverless Cloud Computing Industry Volume Share (%), by Country 2024 & 2032
- Figure 23: MEA Serverless Cloud Computing Industry Revenue (Million), by Country 2024 & 2032
- Figure 24: MEA Serverless Cloud Computing Industry Volume (K Unit), by Country 2024 & 2032
- Figure 25: MEA Serverless Cloud Computing Industry Revenue Share (%), by Country 2024 & 2032
- Figure 26: MEA Serverless Cloud Computing Industry Volume Share (%), by Country 2024 & 2032
- Figure 27: North America Serverless Cloud Computing Industry Revenue (Million), by Service 2024 & 2032
- Figure 28: North America Serverless Cloud Computing Industry Volume (K Unit), by Service 2024 & 2032
- Figure 29: North America Serverless Cloud Computing Industry Revenue Share (%), by Service 2024 & 2032
- Figure 30: North America Serverless Cloud Computing Industry Volume Share (%), by Service 2024 & 2032
- Figure 31: North America Serverless Cloud Computing Industry Revenue (Million), by Type 2024 & 2032
- Figure 32: North America Serverless Cloud Computing Industry Volume (K Unit), by Type 2024 & 2032
- Figure 33: North America Serverless Cloud Computing Industry Revenue Share (%), by Type 2024 & 2032
- Figure 34: North America Serverless Cloud Computing Industry Volume Share (%), by Type 2024 & 2032
- Figure 35: North America Serverless Cloud Computing Industry Revenue (Million), by End-user Industyr 2024 & 2032
- Figure 36: North America Serverless Cloud Computing Industry Volume (K Unit), by End-user Industyr 2024 & 2032
- Figure 37: North America Serverless Cloud Computing Industry Revenue Share (%), by End-user Industyr 2024 & 2032
- Figure 38: North America Serverless Cloud Computing Industry Volume Share (%), by End-user Industyr 2024 & 2032
- Figure 39: North America Serverless Cloud Computing Industry Revenue (Million), by Country 2024 & 2032
- Figure 40: North America Serverless Cloud Computing Industry Volume (K Unit), by Country 2024 & 2032
- Figure 41: North America Serverless Cloud Computing Industry Revenue Share (%), by Country 2024 & 2032
- Figure 42: North America Serverless Cloud Computing Industry Volume Share (%), by Country 2024 & 2032
- Figure 43: Europe Serverless Cloud Computing Industry Revenue (Million), by Service 2024 & 2032
- Figure 44: Europe Serverless Cloud Computing Industry Volume (K Unit), by Service 2024 & 2032
- Figure 45: Europe Serverless Cloud Computing Industry Revenue Share (%), by Service 2024 & 2032
- Figure 46: Europe Serverless Cloud Computing Industry Volume Share (%), by Service 2024 & 2032
- Figure 47: Europe Serverless Cloud Computing Industry Revenue (Million), by Type 2024 & 2032
- Figure 48: Europe Serverless Cloud Computing Industry Volume (K Unit), by Type 2024 & 2032
- Figure 49: Europe Serverless Cloud Computing Industry Revenue Share (%), by Type 2024 & 2032
- Figure 50: Europe Serverless Cloud Computing Industry Volume Share (%), by Type 2024 & 2032
- Figure 51: Europe Serverless Cloud Computing Industry Revenue (Million), by End-user Industyr 2024 & 2032
- Figure 52: Europe Serverless Cloud Computing Industry Volume (K Unit), by End-user Industyr 2024 & 2032
- Figure 53: Europe Serverless Cloud Computing Industry Revenue Share (%), by End-user Industyr 2024 & 2032
- Figure 54: Europe Serverless Cloud Computing Industry Volume Share (%), by End-user Industyr 2024 & 2032
- Figure 55: Europe Serverless Cloud Computing Industry Revenue (Million), by Country 2024 & 2032
- Figure 56: Europe Serverless Cloud Computing Industry Volume (K Unit), by Country 2024 & 2032
- Figure 57: Europe Serverless Cloud Computing Industry Revenue Share (%), by Country 2024 & 2032
- Figure 58: Europe Serverless Cloud Computing Industry Volume Share (%), by Country 2024 & 2032
- Figure 59: Asia Pacific Serverless Cloud Computing Industry Revenue (Million), by Service 2024 & 2032
- Figure 60: Asia Pacific Serverless Cloud Computing Industry Volume (K Unit), by Service 2024 & 2032
- Figure 61: Asia Pacific Serverless Cloud Computing Industry Revenue Share (%), by Service 2024 & 2032
- Figure 62: Asia Pacific Serverless Cloud Computing Industry Volume Share (%), by Service 2024 & 2032
- Figure 63: Asia Pacific Serverless Cloud Computing Industry Revenue (Million), by Type 2024 & 2032
- Figure 64: Asia Pacific Serverless Cloud Computing Industry Volume (K Unit), by Type 2024 & 2032
- Figure 65: Asia Pacific Serverless Cloud Computing Industry Revenue Share (%), by Type 2024 & 2032
- Figure 66: Asia Pacific Serverless Cloud Computing Industry Volume Share (%), by Type 2024 & 2032
- Figure 67: Asia Pacific Serverless Cloud Computing Industry Revenue (Million), by End-user Industyr 2024 & 2032
- Figure 68: Asia Pacific Serverless Cloud Computing Industry Volume (K Unit), by End-user Industyr 2024 & 2032
- Figure 69: Asia Pacific Serverless Cloud Computing Industry Revenue Share (%), by End-user Industyr 2024 & 2032
- Figure 70: Asia Pacific Serverless Cloud Computing Industry Volume Share (%), by End-user Industyr 2024 & 2032
- Figure 71: Asia Pacific Serverless Cloud Computing Industry Revenue (Million), by Country 2024 & 2032
- Figure 72: Asia Pacific Serverless Cloud Computing Industry Volume (K Unit), by Country 2024 & 2032
- Figure 73: Asia Pacific Serverless Cloud Computing Industry Revenue Share (%), by Country 2024 & 2032
- Figure 74: Asia Pacific Serverless Cloud Computing Industry Volume Share (%), by Country 2024 & 2032
- Figure 75: Latin America Serverless Cloud Computing Industry Revenue (Million), by Service 2024 & 2032
- Figure 76: Latin America Serverless Cloud Computing Industry Volume (K Unit), by Service 2024 & 2032
- Figure 77: Latin America Serverless Cloud Computing Industry Revenue Share (%), by Service 2024 & 2032
- Figure 78: Latin America Serverless Cloud Computing Industry Volume Share (%), by Service 2024 & 2032
- Figure 79: Latin America Serverless Cloud Computing Industry Revenue (Million), by Type 2024 & 2032
- Figure 80: Latin America Serverless Cloud Computing Industry Volume (K Unit), by Type 2024 & 2032
- Figure 81: Latin America Serverless Cloud Computing Industry Revenue Share (%), by Type 2024 & 2032
- Figure 82: Latin America Serverless Cloud Computing Industry Volume Share (%), by Type 2024 & 2032
- Figure 83: Latin America Serverless Cloud Computing Industry Revenue (Million), by End-user Industyr 2024 & 2032
- Figure 84: Latin America Serverless Cloud Computing Industry Volume (K Unit), by End-user Industyr 2024 & 2032
- Figure 85: Latin America Serverless Cloud Computing Industry Revenue Share (%), by End-user Industyr 2024 & 2032
- Figure 86: Latin America Serverless Cloud Computing Industry Volume Share (%), by End-user Industyr 2024 & 2032
- Figure 87: Latin America Serverless Cloud Computing Industry Revenue (Million), by Country 2024 & 2032
- Figure 88: Latin America Serverless Cloud Computing Industry Volume (K Unit), by Country 2024 & 2032
- Figure 89: Latin America Serverless Cloud Computing Industry Revenue Share (%), by Country 2024 & 2032
- Figure 90: Latin America Serverless Cloud Computing Industry Volume Share (%), by Country 2024 & 2032
- Figure 91: Middle East Serverless Cloud Computing Industry Revenue (Million), by Service 2024 & 2032
- Figure 92: Middle East Serverless Cloud Computing Industry Volume (K Unit), by Service 2024 & 2032
- Figure 93: Middle East Serverless Cloud Computing Industry Revenue Share (%), by Service 2024 & 2032
- Figure 94: Middle East Serverless Cloud Computing Industry Volume Share (%), by Service 2024 & 2032
- Figure 95: Middle East Serverless Cloud Computing Industry Revenue (Million), by Type 2024 & 2032
- Figure 96: Middle East Serverless Cloud Computing Industry Volume (K Unit), by Type 2024 & 2032
- Figure 97: Middle East Serverless Cloud Computing Industry Revenue Share (%), by Type 2024 & 2032
- Figure 98: Middle East Serverless Cloud Computing Industry Volume Share (%), by Type 2024 & 2032
- Figure 99: Middle East Serverless Cloud Computing Industry Revenue (Million), by End-user Industyr 2024 & 2032
- Figure 100: Middle East Serverless Cloud Computing Industry Volume (K Unit), by End-user Industyr 2024 & 2032
- Figure 101: Middle East Serverless Cloud Computing Industry Revenue Share (%), by End-user Industyr 2024 & 2032
- Figure 102: Middle East Serverless Cloud Computing Industry Volume Share (%), by End-user Industyr 2024 & 2032
- Figure 103: Middle East Serverless Cloud Computing Industry Revenue (Million), by Country 2024 & 2032
- Figure 104: Middle East Serverless Cloud Computing Industry Volume (K Unit), by Country 2024 & 2032
- Figure 105: Middle East Serverless Cloud Computing Industry Revenue Share (%), by Country 2024 & 2032
- Figure 106: Middle East Serverless Cloud Computing Industry Volume Share (%), by Country 2024 & 2032
List of Tables
- Table 1: Global Serverless Cloud Computing Industry Revenue Million Forecast, by Region 2019 & 2032
- Table 2: Global Serverless Cloud Computing Industry Volume K Unit Forecast, by Region 2019 & 2032
- Table 3: Global Serverless Cloud Computing Industry Revenue Million Forecast, by Service 2019 & 2032
- Table 4: Global Serverless Cloud Computing Industry Volume K Unit Forecast, by Service 2019 & 2032
- Table 5: Global Serverless Cloud Computing Industry Revenue Million Forecast, by Type 2019 & 2032
- Table 6: Global Serverless Cloud Computing Industry Volume K Unit Forecast, by Type 2019 & 2032
- Table 7: Global Serverless Cloud Computing Industry Revenue Million Forecast, by End-user Industyr 2019 & 2032
- Table 8: Global Serverless Cloud Computing Industry Volume K Unit Forecast, by End-user Industyr 2019 & 2032
- Table 9: Global Serverless Cloud Computing Industry Revenue Million Forecast, by Region 2019 & 2032
- Table 10: Global Serverless Cloud Computing Industry Volume K Unit Forecast, by Region 2019 & 2032
- Table 11: Global Serverless Cloud Computing Industry Revenue Million Forecast, by Country 2019 & 2032
- Table 12: Global Serverless Cloud Computing Industry Volume K Unit Forecast, by Country 2019 & 2032
- Table 13: United States Serverless Cloud Computing Industry Revenue (Million) Forecast, by Application 2019 & 2032
- Table 14: United States Serverless Cloud Computing Industry Volume (K Unit) Forecast, by Application 2019 & 2032
- Table 15: Canada Serverless Cloud Computing Industry Revenue (Million) Forecast, by Application 2019 & 2032
- Table 16: Canada Serverless Cloud Computing Industry Volume (K Unit) Forecast, by Application 2019 & 2032
- Table 17: Mexico Serverless Cloud Computing Industry Revenue (Million) Forecast, by Application 2019 & 2032
- Table 18: Mexico Serverless Cloud Computing Industry Volume (K Unit) Forecast, by Application 2019 & 2032
- Table 19: Global Serverless Cloud Computing Industry Revenue Million Forecast, by Country 2019 & 2032
- Table 20: Global Serverless Cloud Computing Industry Volume K Unit Forecast, by Country 2019 & 2032
- Table 21: Germany Serverless Cloud Computing Industry Revenue (Million) Forecast, by Application 2019 & 2032
- Table 22: Germany Serverless Cloud Computing Industry Volume (K Unit) Forecast, by Application 2019 & 2032
- Table 23: United Kingdom Serverless Cloud Computing Industry Revenue (Million) Forecast, by Application 2019 & 2032
- Table 24: United Kingdom Serverless Cloud Computing Industry Volume (K Unit) Forecast, by Application 2019 & 2032
- Table 25: France Serverless Cloud Computing Industry Revenue (Million) Forecast, by Application 2019 & 2032
- Table 26: France Serverless Cloud Computing Industry Volume (K Unit) Forecast, by Application 2019 & 2032
- Table 27: Spain Serverless Cloud Computing Industry Revenue (Million) Forecast, by Application 2019 & 2032
- Table 28: Spain Serverless Cloud Computing Industry Volume (K Unit) Forecast, by Application 2019 & 2032
- Table 29: Italy Serverless Cloud Computing Industry Revenue (Million) Forecast, by Application 2019 & 2032
- Table 30: Italy Serverless Cloud Computing Industry Volume (K Unit) Forecast, by Application 2019 & 2032
- Table 31: Spain Serverless Cloud Computing Industry Revenue (Million) Forecast, by Application 2019 & 2032
- Table 32: Spain Serverless Cloud Computing Industry Volume (K Unit) Forecast, by Application 2019 & 2032
- Table 33: Belgium Serverless Cloud Computing Industry Revenue (Million) Forecast, by Application 2019 & 2032
- Table 34: Belgium Serverless Cloud Computing Industry Volume (K Unit) Forecast, by Application 2019 & 2032
- Table 35: Netherland Serverless Cloud Computing Industry Revenue (Million) Forecast, by Application 2019 & 2032
- Table 36: Netherland Serverless Cloud Computing Industry Volume (K Unit) Forecast, by Application 2019 & 2032
- Table 37: Nordics Serverless Cloud Computing Industry Revenue (Million) Forecast, by Application 2019 & 2032
- Table 38: Nordics Serverless Cloud Computing Industry Volume (K Unit) Forecast, by Application 2019 & 2032
- Table 39: Rest of Europe Serverless Cloud Computing Industry Revenue (Million) Forecast, by Application 2019 & 2032
- Table 40: Rest of Europe Serverless Cloud Computing Industry Volume (K Unit) Forecast, by Application 2019 & 2032
- Table 41: Global Serverless Cloud Computing Industry Revenue Million Forecast, by Country 2019 & 2032
- Table 42: Global Serverless Cloud Computing Industry Volume K Unit Forecast, by Country 2019 & 2032
- Table 43: China Serverless Cloud Computing Industry Revenue (Million) Forecast, by Application 2019 & 2032
- Table 44: China Serverless Cloud Computing Industry Volume (K Unit) Forecast, by Application 2019 & 2032
- Table 45: Japan Serverless Cloud Computing Industry Revenue (Million) Forecast, by Application 2019 & 2032
- Table 46: Japan Serverless Cloud Computing Industry Volume (K Unit) Forecast, by Application 2019 & 2032
- Table 47: India Serverless Cloud Computing Industry Revenue (Million) Forecast, by Application 2019 & 2032
- Table 48: India Serverless Cloud Computing Industry Volume (K Unit) Forecast, by Application 2019 & 2032
- Table 49: South Korea Serverless Cloud Computing Industry Revenue (Million) Forecast, by Application 2019 & 2032
- Table 50: South Korea Serverless Cloud Computing Industry Volume (K Unit) Forecast, by Application 2019 & 2032
- Table 51: Southeast Asia Serverless Cloud Computing Industry Revenue (Million) Forecast, by Application 2019 & 2032
- Table 52: Southeast Asia Serverless Cloud Computing Industry Volume (K Unit) Forecast, by Application 2019 & 2032
- Table 53: Australia Serverless Cloud Computing Industry Revenue (Million) Forecast, by Application 2019 & 2032
- Table 54: Australia Serverless Cloud Computing Industry Volume (K Unit) Forecast, by Application 2019 & 2032
- Table 55: Indonesia Serverless Cloud Computing Industry Revenue (Million) Forecast, by Application 2019 & 2032
- Table 56: Indonesia Serverless Cloud Computing Industry Volume (K Unit) Forecast, by Application 2019 & 2032
- Table 57: Phillipes Serverless Cloud Computing Industry Revenue (Million) Forecast, by Application 2019 & 2032
- Table 58: Phillipes Serverless Cloud Computing Industry Volume (K Unit) Forecast, by Application 2019 & 2032
- Table 59: Singapore Serverless Cloud Computing Industry Revenue (Million) Forecast, by Application 2019 & 2032
- Table 60: Singapore Serverless Cloud Computing Industry Volume (K Unit) Forecast, by Application 2019 & 2032
- Table 61: Thailandc Serverless Cloud Computing Industry Revenue (Million) Forecast, by Application 2019 & 2032
- Table 62: Thailandc Serverless Cloud Computing Industry Volume (K Unit) Forecast, by Application 2019 & 2032
- Table 63: Rest of Asia Pacific Serverless Cloud Computing Industry Revenue (Million) Forecast, by Application 2019 & 2032
- Table 64: Rest of Asia Pacific Serverless Cloud Computing Industry Volume (K Unit) Forecast, by Application 2019 & 2032
- Table 65: Global Serverless Cloud Computing Industry Revenue Million Forecast, by Country 2019 & 2032
- Table 66: Global Serverless Cloud Computing Industry Volume K Unit Forecast, by Country 2019 & 2032
- Table 67: Brazil Serverless Cloud Computing Industry Revenue (Million) Forecast, by Application 2019 & 2032
- Table 68: Brazil Serverless Cloud Computing Industry Volume (K Unit) Forecast, by Application 2019 & 2032
- Table 69: Argentina Serverless Cloud Computing Industry Revenue (Million) Forecast, by Application 2019 & 2032
- Table 70: Argentina Serverless Cloud Computing Industry Volume (K Unit) Forecast, by Application 2019 & 2032
- Table 71: Peru Serverless Cloud Computing Industry Revenue (Million) Forecast, by Application 2019 & 2032
- Table 72: Peru Serverless Cloud Computing Industry Volume (K Unit) Forecast, by Application 2019 & 2032
- Table 73: Chile Serverless Cloud Computing Industry Revenue (Million) Forecast, by Application 2019 & 2032
- Table 74: Chile Serverless Cloud Computing Industry Volume (K Unit) Forecast, by Application 2019 & 2032
- Table 75: Colombia Serverless Cloud Computing Industry Revenue (Million) Forecast, by Application 2019 & 2032
- Table 76: Colombia Serverless Cloud Computing Industry Volume (K Unit) Forecast, by Application 2019 & 2032
- Table 77: Ecuador Serverless Cloud Computing Industry Revenue (Million) Forecast, by Application 2019 & 2032
- Table 78: Ecuador Serverless Cloud Computing Industry Volume (K Unit) Forecast, by Application 2019 & 2032
- Table 79: Venezuela Serverless Cloud Computing Industry Revenue (Million) Forecast, by Application 2019 & 2032
- Table 80: Venezuela Serverless Cloud Computing Industry Volume (K Unit) Forecast, by Application 2019 & 2032
- Table 81: Rest of South America Serverless Cloud Computing Industry Revenue (Million) Forecast, by Application 2019 & 2032
- Table 82: Rest of South America Serverless Cloud Computing Industry Volume (K Unit) Forecast, by Application 2019 & 2032
- Table 83: Global Serverless Cloud Computing Industry Revenue Million Forecast, by Country 2019 & 2032
- Table 84: Global Serverless Cloud Computing Industry Volume K Unit Forecast, by Country 2019 & 2032
- Table 85: United States Serverless Cloud Computing Industry Revenue (Million) Forecast, by Application 2019 & 2032
- Table 86: United States Serverless Cloud Computing Industry Volume (K Unit) Forecast, by Application 2019 & 2032
- Table 87: Canada Serverless Cloud Computing Industry Revenue (Million) Forecast, by Application 2019 & 2032
- Table 88: Canada Serverless Cloud Computing Industry Volume (K Unit) Forecast, by Application 2019 & 2032
- Table 89: Mexico Serverless Cloud Computing Industry Revenue (Million) Forecast, by Application 2019 & 2032
- Table 90: Mexico Serverless Cloud Computing Industry Volume (K Unit) Forecast, by Application 2019 & 2032
- Table 91: Global Serverless Cloud Computing Industry Revenue Million Forecast, by Country 2019 & 2032
- Table 92: Global Serverless Cloud Computing Industry Volume K Unit Forecast, by Country 2019 & 2032
- Table 93: United Arab Emirates Serverless Cloud Computing Industry Revenue (Million) Forecast, by Application 2019 & 2032
- Table 94: United Arab Emirates Serverless Cloud Computing Industry Volume (K Unit) Forecast, by Application 2019 & 2032
- Table 95: Saudi Arabia Serverless Cloud Computing Industry Revenue (Million) Forecast, by Application 2019 & 2032
- Table 96: Saudi Arabia Serverless Cloud Computing Industry Volume (K Unit) Forecast, by Application 2019 & 2032
- Table 97: South Africa Serverless Cloud Computing Industry Revenue (Million) Forecast, by Application 2019 & 2032
- Table 98: South Africa Serverless Cloud Computing Industry Volume (K Unit) Forecast, by Application 2019 & 2032
- Table 99: Rest of Middle East and Africa Serverless Cloud Computing Industry Revenue (Million) Forecast, by Application 2019 & 2032
- Table 100: Rest of Middle East and Africa Serverless Cloud Computing Industry Volume (K Unit) Forecast, by Application 2019 & 2032
- Table 101: Global Serverless Cloud Computing Industry Revenue Million Forecast, by Service 2019 & 2032
- Table 102: Global Serverless Cloud Computing Industry Volume K Unit Forecast, by Service 2019 & 2032
- Table 103: Global Serverless Cloud Computing Industry Revenue Million Forecast, by Type 2019 & 2032
- Table 104: Global Serverless Cloud Computing Industry Volume K Unit Forecast, by Type 2019 & 2032
- Table 105: Global Serverless Cloud Computing Industry Revenue Million Forecast, by End-user Industyr 2019 & 2032
- Table 106: Global Serverless Cloud Computing Industry Volume K Unit Forecast, by End-user Industyr 2019 & 2032
- Table 107: Global Serverless Cloud Computing Industry Revenue Million Forecast, by Country 2019 & 2032
- Table 108: Global Serverless Cloud Computing Industry Volume K Unit Forecast, by Country 2019 & 2032
- Table 109: Global Serverless Cloud Computing Industry Revenue Million Forecast, by Service 2019 & 2032
- Table 110: Global Serverless Cloud Computing Industry Volume K Unit Forecast, by Service 2019 & 2032
- Table 111: Global Serverless Cloud Computing Industry Revenue Million Forecast, by Type 2019 & 2032
- Table 112: Global Serverless Cloud Computing Industry Volume K Unit Forecast, by Type 2019 & 2032
- Table 113: Global Serverless Cloud Computing Industry Revenue Million Forecast, by End-user Industyr 2019 & 2032
- Table 114: Global Serverless Cloud Computing Industry Volume K Unit Forecast, by End-user Industyr 2019 & 2032
- Table 115: Global Serverless Cloud Computing Industry Revenue Million Forecast, by Country 2019 & 2032
- Table 116: Global Serverless Cloud Computing Industry Volume K Unit Forecast, by Country 2019 & 2032
- Table 117: Global Serverless Cloud Computing Industry Revenue Million Forecast, by Service 2019 & 2032
- Table 118: Global Serverless Cloud Computing Industry Volume K Unit Forecast, by Service 2019 & 2032
- Table 119: Global Serverless Cloud Computing Industry Revenue Million Forecast, by Type 2019 & 2032
- Table 120: Global Serverless Cloud Computing Industry Volume K Unit Forecast, by Type 2019 & 2032
- Table 121: Global Serverless Cloud Computing Industry Revenue Million Forecast, by End-user Industyr 2019 & 2032
- Table 122: Global Serverless Cloud Computing Industry Volume K Unit Forecast, by End-user Industyr 2019 & 2032
- Table 123: Global Serverless Cloud Computing Industry Revenue Million Forecast, by Country 2019 & 2032
- Table 124: Global Serverless Cloud Computing Industry Volume K Unit Forecast, by Country 2019 & 2032
- Table 125: Global Serverless Cloud Computing Industry Revenue Million Forecast, by Service 2019 & 2032
- Table 126: Global Serverless Cloud Computing Industry Volume K Unit Forecast, by Service 2019 & 2032
- Table 127: Global Serverless Cloud Computing Industry Revenue Million Forecast, by Type 2019 & 2032
- Table 128: Global Serverless Cloud Computing Industry Volume K Unit Forecast, by Type 2019 & 2032
- Table 129: Global Serverless Cloud Computing Industry Revenue Million Forecast, by End-user Industyr 2019 & 2032
- Table 130: Global Serverless Cloud Computing Industry Volume K Unit Forecast, by End-user Industyr 2019 & 2032
- Table 131: Global Serverless Cloud Computing Industry Revenue Million Forecast, by Country 2019 & 2032
- Table 132: Global Serverless Cloud Computing Industry Volume K Unit Forecast, by Country 2019 & 2032
- Table 133: Global Serverless Cloud Computing Industry Revenue Million Forecast, by Service 2019 & 2032
- Table 134: Global Serverless Cloud Computing Industry Volume K Unit Forecast, by Service 2019 & 2032
- Table 135: Global Serverless Cloud Computing Industry Revenue Million Forecast, by Type 2019 & 2032
- Table 136: Global Serverless Cloud Computing Industry Volume K Unit Forecast, by Type 2019 & 2032
- Table 137: Global Serverless Cloud Computing Industry Revenue Million Forecast, by End-user Industyr 2019 & 2032
- Table 138: Global Serverless Cloud Computing Industry Volume K Unit Forecast, by End-user Industyr 2019 & 2032
- Table 139: Global Serverless Cloud Computing Industry Revenue Million Forecast, by Country 2019 & 2032
- Table 140: Global Serverless Cloud Computing Industry Volume K Unit Forecast, by Country 2019 & 2032
Frequently Asked Questions
1. What is the projected Compound Annual Growth Rate (CAGR) of the Serverless Cloud Computing Industry?
The projected CAGR is approximately 23.17%.
2. Which companies are prominent players in the Serverless Cloud Computing Industry?
Key companies in the market include VMware Inc, Alibaba Group Holding Limited, Google LLC, Webtask io, IBM Corp, Amazon Web Services Inc, Oracle Corp, Iron io, Microsoft Corp, SAP SE.
3. What are the main segments of the Serverless Cloud Computing Industry?
The market segments include Service, Type, End-user Industyr.
4. Can you provide details about the market size?
The market size is estimated to be USD XX Million as of 2022.
5. What are some drivers contributing to market growth?
Growth in Enhanced Scalability. Decreased in Time-To-Market Along with Reduced Operational Cost; Proliferation of the Microservices Architecture Across Organization's Business Model; Increase in demand of Professional services globally to drive the market.
6. What are the notable trends driving market growth?
Professional Services are Expected to Grow at a Significant Rate.
7. Are there any restraints impacting market growth?
Loss of Control on Security in Case of Attack.
8. Can you provide examples of recent developments in the market?
September 2022 - Launch of Log Analytics powered by Big Query by Google Cloud Logging. Users of the feature can perform analytics on logs using the power of BQ within Cloud Logging. To begin using Log Analytics, you can change your current Log Buckets. Also, to consume data, simple data pipeline designs are optional.
9. What pricing options are available for accessing the report?
Pricing options include single-user, multi-user, and enterprise licenses priced at USD 4750, USD 5250, and USD 8750 respectively.
10. Is the market size provided in terms of value or volume?
The market size is provided in terms of value, measured in Million and volume, measured in K Unit.
11. Are there any specific market keywords associated with the report?
Yes, the market keyword associated with the report is "Serverless Cloud Computing Industry," which aids in identifying and referencing the specific market segment covered.
12. How do I determine which pricing option suits my needs best?
The pricing options vary based on user requirements and access needs. Individual users may opt for single-user licenses, while businesses requiring broader access may choose multi-user or enterprise licenses for cost-effective access to the report.
13. Are there any additional resources or data provided in the Serverless Cloud Computing Industry report?
While the report offers comprehensive insights, it's advisable to review the specific contents or supplementary materials provided to ascertain if additional resources or data are available.
14. How can I stay updated on further developments or reports in the Serverless Cloud Computing Industry?
To stay informed about further developments, trends, and reports in the Serverless Cloud Computing Industry, consider subscribing to industry newsletters, following relevant companies and organizations, or regularly checking reputable industry news sources and publications.
Methodology
Step 1 - Identification of Relevant Samples Size from Population Database


Step 2 - Approaches for Defining Global Market Size (Value, Volume* & Price*)

Note*: In applicable scenarios
Step 3 - Data Sources
Primary Research
- Web Analytics
- Survey Reports
- Research Institute
- Latest Research Reports
- Opinion Leaders
Secondary Research
- Annual Reports
- White Paper
- Latest Press Release
- Industry Association
- Paid Database
- Investor Presentations

Step 4 - Data Triangulation
Involves using different sources of information in order to increase the validity of a study
These sources are likely to be stakeholders in a program - participants, other researchers, program staff, other community members, and so on.
Then we put all data in single framework & apply various statistical tools to find out the dynamic on the market.
During the analysis stage, feedback from the stakeholder groups would be compared to determine areas of agreement as well as areas of divergence
