

Key Insights
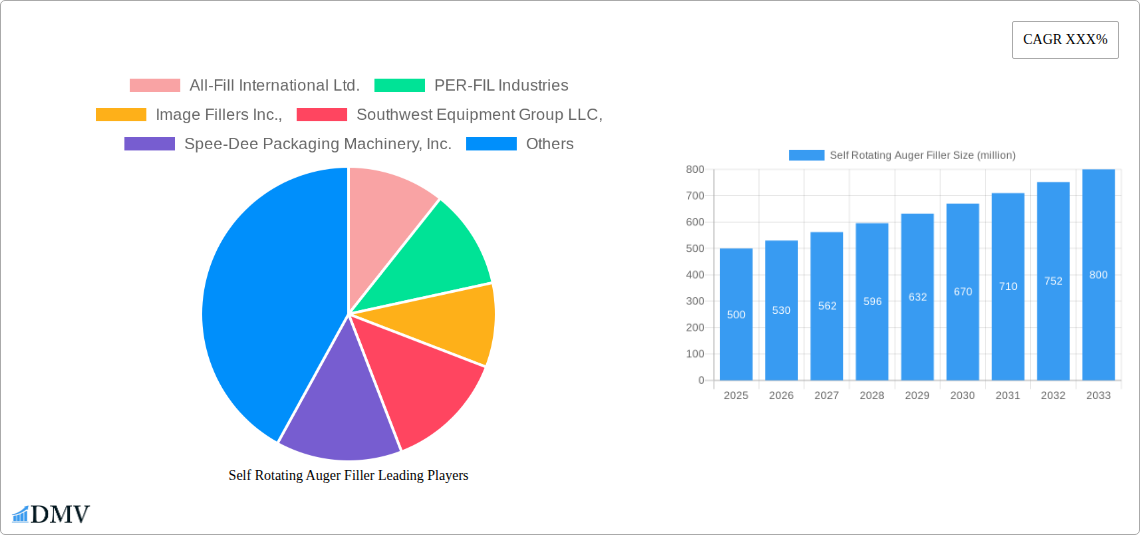
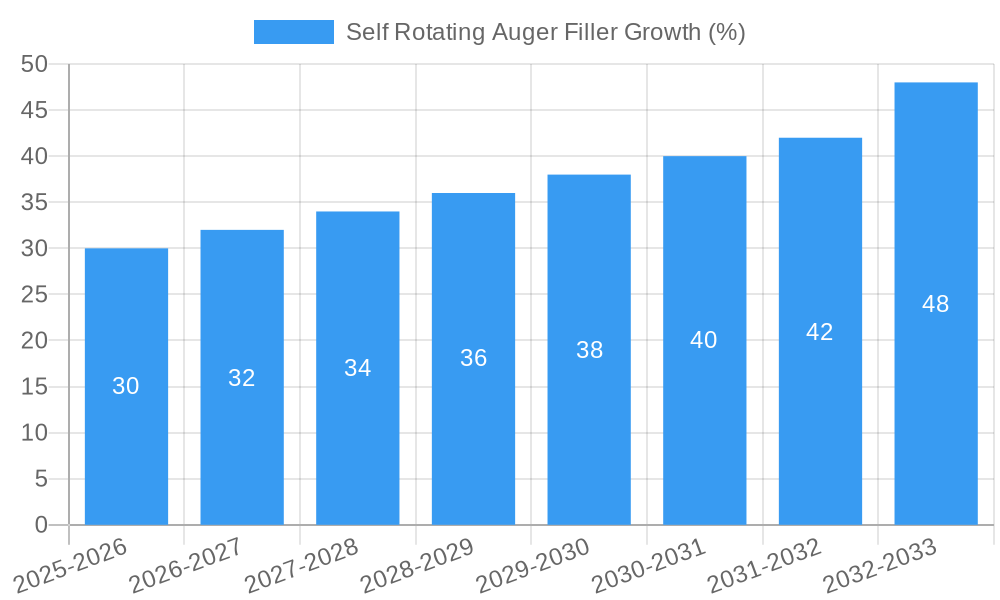
The self-rotating auger filler market is experiencing robust growth, driven by increasing demand for efficient and precise filling solutions across diverse industries. The market, estimated at $500 million in 2025, is projected to exhibit a Compound Annual Growth Rate (CAGR) of 6% from 2025 to 2033, reaching approximately $800 million by 2033. This growth is fueled by several key factors. Firstly, the rising adoption of automation in packaging lines across food and beverage, pharmaceuticals, and cosmetics sectors is a significant driver. Manufacturers are increasingly seeking automated solutions to enhance productivity, reduce labor costs, and improve filling accuracy. Secondly, the growing preference for convenient and tamper-evident packaging formats, particularly in the food and beverage industry, is bolstering demand for versatile auger fillers capable of handling various product types and packaging sizes. Finally, stringent regulatory requirements concerning product safety and hygiene are pushing manufacturers to adopt advanced filling technologies that minimize contamination risks and ensure consistent product quality. Companies like All-Fill International Ltd., PER-FIL Industries, and Spee-Dee Packaging Machinery, Inc. are key players shaping the market landscape through innovation and strategic partnerships.
However, market growth faces certain restraints. The high initial investment costs associated with automated auger filling systems can be a barrier for small and medium-sized enterprises (SMEs). Moreover, the need for skilled labor for operation and maintenance of these sophisticated machines can pose a challenge. Technological advancements in alternative filling technologies and ongoing economic fluctuations also present challenges to market expansion. Nevertheless, the long-term outlook for the self-rotating auger filler market remains positive, driven by continuous innovation in filling technology, increasing automation trends, and a strong focus on enhancing production efficiency and product quality across a broad range of industries. Segmentation within the market is likely driven by industry (food & beverage, pharmaceuticals, etc.), filling capacity, and level of automation. Regional growth will likely be influenced by factors like the presence of manufacturing hubs and overall economic development in different parts of the world.
Self Rotating Auger Filler Market Report: A Comprehensive Analysis (2019-2033)
This insightful report delivers a comprehensive analysis of the global Self Rotating Auger Filler market, projecting a market value exceeding $XX million by 2033. The study period covers 2019-2033, with 2025 serving as both the base and estimated year. This detailed analysis provides crucial insights for stakeholders seeking to navigate this dynamic market. The report meticulously examines market composition, technological advancements, regional dominance, and key players, offering a roadmap for strategic decision-making.
Self Rotating Auger Filler Market Composition & Trends
The global self-rotating auger filler market, valued at $XX million in 2025, exhibits a moderately concentrated landscape. All-Fill International Ltd., PER-FIL Industries, Image Fillers Inc., Southwest Equipment Group LLC, Spee-Dee Packaging Machinery, Inc., Nalbach Engineering Company, Inc., Techno pack Corporation, Accutek Packaging Equipment Companies, Inc., and AMS Filling Systems Inc. are key players, although precise market share distribution remains dynamic and subject to ongoing M&A activity. Innovation is driven by increasing demands for enhanced accuracy, speed, and hygiene in various industries. Stringent regulatory frameworks concerning food safety and packaging standards are also significant factors shaping the market. Substitute products, such as volumetric fillers, pose some competition, but the self-rotating auger filler's advantages in handling viscous and free-flowing products ensure its continued relevance. End-users span diverse sectors, including food & beverage, pharmaceuticals, cosmetics, and chemicals. Over the past five years, M&A activity has been moderate, with estimated deal values totaling $XX million. Future consolidation is anticipated, driven by the need for increased scale and technological capabilities.
- Market Concentration: Moderately concentrated, with top 10 players holding approximately xx% market share in 2025.
- Innovation Catalysts: Demand for higher accuracy, increased speed, improved hygiene, and versatility.
- Regulatory Landscape: Stringent food safety and packaging regulations drive innovation and adoption of advanced technologies.
- Substitute Products: Volumetric fillers pose a limited threat due to self-rotating auger filler's advantages in specific applications.
- End-User Profiles: Food & beverage, pharmaceuticals, cosmetics, and chemicals are major end-user sectors.
- M&A Activities: Moderate activity in the historical period (2019-2024), with estimated deal values totaling $XX million.
Self Rotating Auger Filler Industry Evolution
The self-rotating auger filler market has experienced steady growth, expanding at a CAGR of xx% during the historical period (2019-2024). This growth is propelled by the increasing automation and efficiency demands across various industries. Technological advancements, including the integration of advanced control systems, improved auger designs, and enhanced cleaning mechanisms, have contributed to improved accuracy, speed, and hygiene. Consumer demand for higher quality products and reduced packaging costs continues to drive adoption. The adoption rate of automated filling systems, including self-rotating auger fillers, has increased significantly, especially in large-scale production facilities. Furthermore, the growing focus on sustainability has also influenced the development of eco-friendly materials and designs in auger filler technology. We predict that the market will continue to grow at a CAGR of xx% during the forecast period (2025-2033).
Leading Regions, Countries, or Segments in Self Rotating Auger Filler
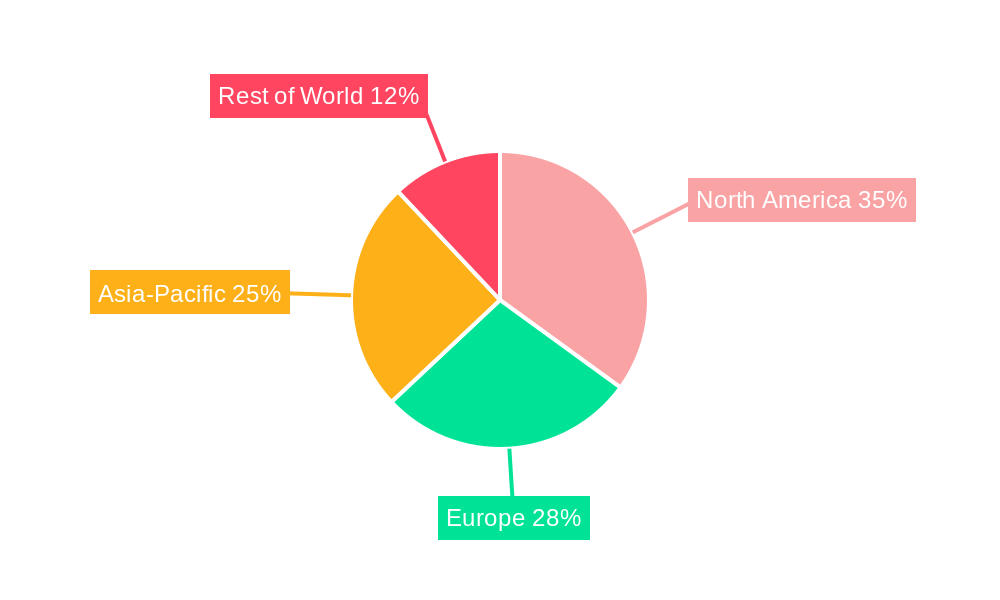
North America currently dominates the self-rotating auger filler market, driven by robust growth in the food & beverage and pharmaceutical sectors.
- Key Drivers in North America:
- High levels of automation in manufacturing processes.
- Stringent regulatory standards pushing for advanced filling technologies.
- Significant investments in R&D within the packaging industry.
- Dominance Factors: Established manufacturing base, high consumer spending, and technological leadership. The European and Asian markets are also experiencing significant growth, though at a slightly slower pace than North America. Growth in these regions is primarily driven by increasing industrialization and rising disposable incomes.
Self Rotating Auger Filler Product Innovations
Recent innovations include the introduction of servo-driven auger systems for enhanced precision and control, as well as hygienic designs incorporating easy-clean features to meet stringent sanitary standards. These advancements result in increased efficiency, reduced waste, and improved product quality. Unique selling propositions include enhanced accuracy, speed, and versatility across a broad range of products and viscosities.
Propelling Factors for Self Rotating Auger Filler Growth
The market's growth is primarily fueled by the increasing demand for automated filling systems across various industries. Technological advancements such as improved precision, speed, and hygiene features enhance efficiency and reduce waste. Economic factors such as the need for cost reduction and increased productivity in manufacturing are also major drivers. Furthermore, regulatory compliance regarding food safety and product quality encourages the adoption of self-rotating auger fillers.
Obstacles in the Self Rotating Auger Filler Market
High initial investment costs can be a barrier to entry for smaller businesses. Supply chain disruptions, especially concerning critical components, can impact production and delivery times. Intense competition among established players can put pressure on pricing and profit margins.
Future Opportunities in Self Rotating Auger Filler
Emerging markets in developing economies present significant growth potential. The integration of advanced technologies like AI and IoT for predictive maintenance and optimized operations offers further opportunities. Demand for sustainable packaging solutions will drive the development of eco-friendly auger filler designs.
Major Players in the Self Rotating Auger Filler Ecosystem
- All-Fill International Ltd.
- PER-FIL Industries
- Image Fillers Inc.
- Southwest Equipment Group LLC
- Spee-Dee Packaging Machinery, Inc.
- Nalbach Engineering Company, Inc.
- Techno pack Corporation
- Accutek Packaging Equipment Companies, Inc.
- AMS Filling Systems Inc.
Key Developments in Self Rotating Auger Filler Industry
- 2022 Q3: All-Fill International Ltd. launched a new line of high-speed self-rotating auger fillers.
- 2023 Q1: Spee-Dee Packaging Machinery, Inc. announced a strategic partnership for enhanced distribution capabilities.
- 2024 Q2: A significant merger between two smaller auger filler manufacturers consolidated market share. (Further details are unavailable, using xx as placeholder)
Strategic Self Rotating Auger Filler Market Forecast
The self-rotating auger filler market is poised for continued growth, driven by technological advancements and increasing demand across diverse industries. Opportunities exist in emerging markets and the adoption of sustainable packaging solutions. The market's expansion will be influenced by technological innovations, regulatory changes, and the ongoing consolidation among key players. The forecast predicts significant growth, exceeding $XX million by 2033.
Self Rotating Auger Filler Segmentation
-
1. Application
- 1.1. Food and Beverage
- 1.2. Personal Care
- 1.3. Fertilizer
- 1.4. Pharmaceutical
- 1.5. Chemical
- 1.6. Others
-
2. Type
- 2.1. Powder
- 2.2. Liquid
Self Rotating Auger Filler Segmentation By Geography
-
1. North America
- 1.1. United States
- 1.2. Canada
- 1.3. Mexico
-
2. South America
- 2.1. Brazil
- 2.2. Argentina
- 2.3. Rest of South America
-
3. Europe
- 3.1. United Kingdom
- 3.2. Germany
- 3.3. France
- 3.4. Italy
- 3.5. Spain
- 3.6. Russia
- 3.7. Benelux
- 3.8. Nordics
- 3.9. Rest of Europe
-
4. Middle East & Africa
- 4.1. Turkey
- 4.2. Israel
- 4.3. GCC
- 4.4. North Africa
- 4.5. South Africa
- 4.6. Rest of Middle East & Africa
-
5. Asia Pacific
- 5.1. China
- 5.2. India
- 5.3. Japan
- 5.4. South Korea
- 5.5. ASEAN
- 5.6. Oceania
- 5.7. Rest of Asia Pacific
Self Rotating Auger Filler REPORT HIGHLIGHTS
| Aspects | Details |
|---|---|
| Study Period | 2019-2033 |
| Base Year | 2024 |
| Estimated Year | 2025 |
| Forecast Period | 2025-2033 |
| Historical Period | 2019-2024 |
| Growth Rate | CAGR of XXX% from 2019-2033 |
| Segmentation |
|
Table of Contents
- 1. Introduction
- 1.1. Research Scope
- 1.2. Market Segmentation
- 1.3. Research Methodology
- 1.4. Definitions and Assumptions
- 2. Executive Summary
- 2.1. Introduction
- 3. Market Dynamics
- 3.1. Introduction
- 3.2. Market Drivers
- 3.3. Market Restrains
- 3.4. Market Trends
- 4. Market Factor Analysis
- 4.1. Porters Five Forces
- 4.2. Supply/Value Chain
- 4.3. PESTEL analysis
- 4.4. Market Entropy
- 4.5. Patent/Trademark Analysis
- 5. Global Self Rotating Auger Filler Analysis, Insights and Forecast, 2019-2031
- 5.1. Market Analysis, Insights and Forecast - by Application
- 5.1.1. Food and Beverage
- 5.1.2. Personal Care
- 5.1.3. Fertilizer
- 5.1.4. Pharmaceutical
- 5.1.5. Chemical
- 5.1.6. Others
- 5.2. Market Analysis, Insights and Forecast - by Type
- 5.2.1. Powder
- 5.2.2. Liquid
- 5.3. Market Analysis, Insights and Forecast - by Region
- 5.3.1. North America
- 5.3.2. South America
- 5.3.3. Europe
- 5.3.4. Middle East & Africa
- 5.3.5. Asia Pacific
- 5.1. Market Analysis, Insights and Forecast - by Application
- 6. North America Self Rotating Auger Filler Analysis, Insights and Forecast, 2019-2031
- 6.1. Market Analysis, Insights and Forecast - by Application
- 6.1.1. Food and Beverage
- 6.1.2. Personal Care
- 6.1.3. Fertilizer
- 6.1.4. Pharmaceutical
- 6.1.5. Chemical
- 6.1.6. Others
- 6.2. Market Analysis, Insights and Forecast - by Type
- 6.2.1. Powder
- 6.2.2. Liquid
- 6.1. Market Analysis, Insights and Forecast - by Application
- 7. South America Self Rotating Auger Filler Analysis, Insights and Forecast, 2019-2031
- 7.1. Market Analysis, Insights and Forecast - by Application
- 7.1.1. Food and Beverage
- 7.1.2. Personal Care
- 7.1.3. Fertilizer
- 7.1.4. Pharmaceutical
- 7.1.5. Chemical
- 7.1.6. Others
- 7.2. Market Analysis, Insights and Forecast - by Type
- 7.2.1. Powder
- 7.2.2. Liquid
- 7.1. Market Analysis, Insights and Forecast - by Application
- 8. Europe Self Rotating Auger Filler Analysis, Insights and Forecast, 2019-2031
- 8.1. Market Analysis, Insights and Forecast - by Application
- 8.1.1. Food and Beverage
- 8.1.2. Personal Care
- 8.1.3. Fertilizer
- 8.1.4. Pharmaceutical
- 8.1.5. Chemical
- 8.1.6. Others
- 8.2. Market Analysis, Insights and Forecast - by Type
- 8.2.1. Powder
- 8.2.2. Liquid
- 8.1. Market Analysis, Insights and Forecast - by Application
- 9. Middle East & Africa Self Rotating Auger Filler Analysis, Insights and Forecast, 2019-2031
- 9.1. Market Analysis, Insights and Forecast - by Application
- 9.1.1. Food and Beverage
- 9.1.2. Personal Care
- 9.1.3. Fertilizer
- 9.1.4. Pharmaceutical
- 9.1.5. Chemical
- 9.1.6. Others
- 9.2. Market Analysis, Insights and Forecast - by Type
- 9.2.1. Powder
- 9.2.2. Liquid
- 9.1. Market Analysis, Insights and Forecast - by Application
- 10. Asia Pacific Self Rotating Auger Filler Analysis, Insights and Forecast, 2019-2031
- 10.1. Market Analysis, Insights and Forecast - by Application
- 10.1.1. Food and Beverage
- 10.1.2. Personal Care
- 10.1.3. Fertilizer
- 10.1.4. Pharmaceutical
- 10.1.5. Chemical
- 10.1.6. Others
- 10.2. Market Analysis, Insights and Forecast - by Type
- 10.2.1. Powder
- 10.2.2. Liquid
- 10.1. Market Analysis, Insights and Forecast - by Application
- 11. Competitive Analysis
- 11.1. Global Market Share Analysis 2024
- 11.2. Company Profiles
- 11.2.1 All-Fill International Ltd.
- 11.2.1.1. Overview
- 11.2.1.2. Products
- 11.2.1.3. SWOT Analysis
- 11.2.1.4. Recent Developments
- 11.2.1.5. Financials (Based on Availability)
- 11.2.2 PER-FIL Industries
- 11.2.2.1. Overview
- 11.2.2.2. Products
- 11.2.2.3. SWOT Analysis
- 11.2.2.4. Recent Developments
- 11.2.2.5. Financials (Based on Availability)
- 11.2.3 Image Fillers Inc.
- 11.2.3.1. Overview
- 11.2.3.2. Products
- 11.2.3.3. SWOT Analysis
- 11.2.3.4. Recent Developments
- 11.2.3.5. Financials (Based on Availability)
- 11.2.4 Southwest Equipment Group LLC
- 11.2.4.1. Overview
- 11.2.4.2. Products
- 11.2.4.3. SWOT Analysis
- 11.2.4.4. Recent Developments
- 11.2.4.5. Financials (Based on Availability)
- 11.2.5 Spee-Dee Packaging Machinery Inc.
- 11.2.5.1. Overview
- 11.2.5.2. Products
- 11.2.5.3. SWOT Analysis
- 11.2.5.4. Recent Developments
- 11.2.5.5. Financials (Based on Availability)
- 11.2.6 Nalbach Engineering Company Inc.
- 11.2.6.1. Overview
- 11.2.6.2. Products
- 11.2.6.3. SWOT Analysis
- 11.2.6.4. Recent Developments
- 11.2.6.5. Financials (Based on Availability)
- 11.2.7 Techno pack Corporation
- 11.2.7.1. Overview
- 11.2.7.2. Products
- 11.2.7.3. SWOT Analysis
- 11.2.7.4. Recent Developments
- 11.2.7.5. Financials (Based on Availability)
- 11.2.8 Accutek Packaging Equipment Companies Inc.
- 11.2.8.1. Overview
- 11.2.8.2. Products
- 11.2.8.3. SWOT Analysis
- 11.2.8.4. Recent Developments
- 11.2.8.5. Financials (Based on Availability)
- 11.2.9 AMS Filling Systems Inc.
- 11.2.9.1. Overview
- 11.2.9.2. Products
- 11.2.9.3. SWOT Analysis
- 11.2.9.4. Recent Developments
- 11.2.9.5. Financials (Based on Availability)
- 11.2.1 All-Fill International Ltd.
List of Figures
- Figure 1: Global Self Rotating Auger Filler Revenue Breakdown (million, %) by Region 2024 & 2032
- Figure 2: North America Self Rotating Auger Filler Revenue (million), by Application 2024 & 2032
- Figure 3: North America Self Rotating Auger Filler Revenue Share (%), by Application 2024 & 2032
- Figure 4: North America Self Rotating Auger Filler Revenue (million), by Type 2024 & 2032
- Figure 5: North America Self Rotating Auger Filler Revenue Share (%), by Type 2024 & 2032
- Figure 6: North America Self Rotating Auger Filler Revenue (million), by Country 2024 & 2032
- Figure 7: North America Self Rotating Auger Filler Revenue Share (%), by Country 2024 & 2032
- Figure 8: South America Self Rotating Auger Filler Revenue (million), by Application 2024 & 2032
- Figure 9: South America Self Rotating Auger Filler Revenue Share (%), by Application 2024 & 2032
- Figure 10: South America Self Rotating Auger Filler Revenue (million), by Type 2024 & 2032
- Figure 11: South America Self Rotating Auger Filler Revenue Share (%), by Type 2024 & 2032
- Figure 12: South America Self Rotating Auger Filler Revenue (million), by Country 2024 & 2032
- Figure 13: South America Self Rotating Auger Filler Revenue Share (%), by Country 2024 & 2032
- Figure 14: Europe Self Rotating Auger Filler Revenue (million), by Application 2024 & 2032
- Figure 15: Europe Self Rotating Auger Filler Revenue Share (%), by Application 2024 & 2032
- Figure 16: Europe Self Rotating Auger Filler Revenue (million), by Type 2024 & 2032
- Figure 17: Europe Self Rotating Auger Filler Revenue Share (%), by Type 2024 & 2032
- Figure 18: Europe Self Rotating Auger Filler Revenue (million), by Country 2024 & 2032
- Figure 19: Europe Self Rotating Auger Filler Revenue Share (%), by Country 2024 & 2032
- Figure 20: Middle East & Africa Self Rotating Auger Filler Revenue (million), by Application 2024 & 2032
- Figure 21: Middle East & Africa Self Rotating Auger Filler Revenue Share (%), by Application 2024 & 2032
- Figure 22: Middle East & Africa Self Rotating Auger Filler Revenue (million), by Type 2024 & 2032
- Figure 23: Middle East & Africa Self Rotating Auger Filler Revenue Share (%), by Type 2024 & 2032
- Figure 24: Middle East & Africa Self Rotating Auger Filler Revenue (million), by Country 2024 & 2032
- Figure 25: Middle East & Africa Self Rotating Auger Filler Revenue Share (%), by Country 2024 & 2032
- Figure 26: Asia Pacific Self Rotating Auger Filler Revenue (million), by Application 2024 & 2032
- Figure 27: Asia Pacific Self Rotating Auger Filler Revenue Share (%), by Application 2024 & 2032
- Figure 28: Asia Pacific Self Rotating Auger Filler Revenue (million), by Type 2024 & 2032
- Figure 29: Asia Pacific Self Rotating Auger Filler Revenue Share (%), by Type 2024 & 2032
- Figure 30: Asia Pacific Self Rotating Auger Filler Revenue (million), by Country 2024 & 2032
- Figure 31: Asia Pacific Self Rotating Auger Filler Revenue Share (%), by Country 2024 & 2032
List of Tables
- Table 1: Global Self Rotating Auger Filler Revenue million Forecast, by Region 2019 & 2032
- Table 2: Global Self Rotating Auger Filler Revenue million Forecast, by Application 2019 & 2032
- Table 3: Global Self Rotating Auger Filler Revenue million Forecast, by Type 2019 & 2032
- Table 4: Global Self Rotating Auger Filler Revenue million Forecast, by Region 2019 & 2032
- Table 5: Global Self Rotating Auger Filler Revenue million Forecast, by Application 2019 & 2032
- Table 6: Global Self Rotating Auger Filler Revenue million Forecast, by Type 2019 & 2032
- Table 7: Global Self Rotating Auger Filler Revenue million Forecast, by Country 2019 & 2032
- Table 8: United States Self Rotating Auger Filler Revenue (million) Forecast, by Application 2019 & 2032
- Table 9: Canada Self Rotating Auger Filler Revenue (million) Forecast, by Application 2019 & 2032
- Table 10: Mexico Self Rotating Auger Filler Revenue (million) Forecast, by Application 2019 & 2032
- Table 11: Global Self Rotating Auger Filler Revenue million Forecast, by Application 2019 & 2032
- Table 12: Global Self Rotating Auger Filler Revenue million Forecast, by Type 2019 & 2032
- Table 13: Global Self Rotating Auger Filler Revenue million Forecast, by Country 2019 & 2032
- Table 14: Brazil Self Rotating Auger Filler Revenue (million) Forecast, by Application 2019 & 2032
- Table 15: Argentina Self Rotating Auger Filler Revenue (million) Forecast, by Application 2019 & 2032
- Table 16: Rest of South America Self Rotating Auger Filler Revenue (million) Forecast, by Application 2019 & 2032
- Table 17: Global Self Rotating Auger Filler Revenue million Forecast, by Application 2019 & 2032
- Table 18: Global Self Rotating Auger Filler Revenue million Forecast, by Type 2019 & 2032
- Table 19: Global Self Rotating Auger Filler Revenue million Forecast, by Country 2019 & 2032
- Table 20: United Kingdom Self Rotating Auger Filler Revenue (million) Forecast, by Application 2019 & 2032
- Table 21: Germany Self Rotating Auger Filler Revenue (million) Forecast, by Application 2019 & 2032
- Table 22: France Self Rotating Auger Filler Revenue (million) Forecast, by Application 2019 & 2032
- Table 23: Italy Self Rotating Auger Filler Revenue (million) Forecast, by Application 2019 & 2032
- Table 24: Spain Self Rotating Auger Filler Revenue (million) Forecast, by Application 2019 & 2032
- Table 25: Russia Self Rotating Auger Filler Revenue (million) Forecast, by Application 2019 & 2032
- Table 26: Benelux Self Rotating Auger Filler Revenue (million) Forecast, by Application 2019 & 2032
- Table 27: Nordics Self Rotating Auger Filler Revenue (million) Forecast, by Application 2019 & 2032
- Table 28: Rest of Europe Self Rotating Auger Filler Revenue (million) Forecast, by Application 2019 & 2032
- Table 29: Global Self Rotating Auger Filler Revenue million Forecast, by Application 2019 & 2032
- Table 30: Global Self Rotating Auger Filler Revenue million Forecast, by Type 2019 & 2032
- Table 31: Global Self Rotating Auger Filler Revenue million Forecast, by Country 2019 & 2032
- Table 32: Turkey Self Rotating Auger Filler Revenue (million) Forecast, by Application 2019 & 2032
- Table 33: Israel Self Rotating Auger Filler Revenue (million) Forecast, by Application 2019 & 2032
- Table 34: GCC Self Rotating Auger Filler Revenue (million) Forecast, by Application 2019 & 2032
- Table 35: North Africa Self Rotating Auger Filler Revenue (million) Forecast, by Application 2019 & 2032
- Table 36: South Africa Self Rotating Auger Filler Revenue (million) Forecast, by Application 2019 & 2032
- Table 37: Rest of Middle East & Africa Self Rotating Auger Filler Revenue (million) Forecast, by Application 2019 & 2032
- Table 38: Global Self Rotating Auger Filler Revenue million Forecast, by Application 2019 & 2032
- Table 39: Global Self Rotating Auger Filler Revenue million Forecast, by Type 2019 & 2032
- Table 40: Global Self Rotating Auger Filler Revenue million Forecast, by Country 2019 & 2032
- Table 41: China Self Rotating Auger Filler Revenue (million) Forecast, by Application 2019 & 2032
- Table 42: India Self Rotating Auger Filler Revenue (million) Forecast, by Application 2019 & 2032
- Table 43: Japan Self Rotating Auger Filler Revenue (million) Forecast, by Application 2019 & 2032
- Table 44: South Korea Self Rotating Auger Filler Revenue (million) Forecast, by Application 2019 & 2032
- Table 45: ASEAN Self Rotating Auger Filler Revenue (million) Forecast, by Application 2019 & 2032
- Table 46: Oceania Self Rotating Auger Filler Revenue (million) Forecast, by Application 2019 & 2032
- Table 47: Rest of Asia Pacific Self Rotating Auger Filler Revenue (million) Forecast, by Application 2019 & 2032
Frequently Asked Questions
1. What is the projected Compound Annual Growth Rate (CAGR) of the Self Rotating Auger Filler?
The projected CAGR is approximately XXX%.
2. Which companies are prominent players in the Self Rotating Auger Filler?
Key companies in the market include All-Fill International Ltd., PER-FIL Industries, Image Fillers Inc.,, Southwest Equipment Group LLC,, Spee-Dee Packaging Machinery, Inc., Nalbach Engineering Company, Inc., Techno pack Corporation, Accutek Packaging Equipment Companies, Inc., AMS Filling Systems Inc..
3. What are the main segments of the Self Rotating Auger Filler?
The market segments include Application, Type.
4. Can you provide details about the market size?
The market size is estimated to be USD XXX million as of 2022.
5. What are some drivers contributing to market growth?
N/A
6. What are the notable trends driving market growth?
N/A
7. Are there any restraints impacting market growth?
N/A
8. Can you provide examples of recent developments in the market?
N/A
9. What pricing options are available for accessing the report?
Pricing options include single-user, multi-user, and enterprise licenses priced at USD 2900.00, USD 4350.00, and USD 5800.00 respectively.
10. Is the market size provided in terms of value or volume?
The market size is provided in terms of value, measured in million.
11. Are there any specific market keywords associated with the report?
Yes, the market keyword associated with the report is "Self Rotating Auger Filler," which aids in identifying and referencing the specific market segment covered.
12. How do I determine which pricing option suits my needs best?
The pricing options vary based on user requirements and access needs. Individual users may opt for single-user licenses, while businesses requiring broader access may choose multi-user or enterprise licenses for cost-effective access to the report.
13. Are there any additional resources or data provided in the Self Rotating Auger Filler report?
While the report offers comprehensive insights, it's advisable to review the specific contents or supplementary materials provided to ascertain if additional resources or data are available.
14. How can I stay updated on further developments or reports in the Self Rotating Auger Filler?
To stay informed about further developments, trends, and reports in the Self Rotating Auger Filler, consider subscribing to industry newsletters, following relevant companies and organizations, or regularly checking reputable industry news sources and publications.
Methodology
Step 1 - Identification of Relevant Samples Size from Population Database


Step 2 - Approaches for Defining Global Market Size (Value, Volume* & Price*)

Note*: In applicable scenarios
Step 3 - Data Sources
Primary Research
- Web Analytics
- Survey Reports
- Research Institute
- Latest Research Reports
- Opinion Leaders
Secondary Research
- Annual Reports
- White Paper
- Latest Press Release
- Industry Association
- Paid Database
- Investor Presentations

Step 4 - Data Triangulation
Involves using different sources of information in order to increase the validity of a study
These sources are likely to be stakeholders in a program - participants, other researchers, program staff, other community members, and so on.
Then we put all data in single framework & apply various statistical tools to find out the dynamic on the market.
During the analysis stage, feedback from the stakeholder groups would be compared to determine areas of agreement as well as areas of divergence
