

Key Insights
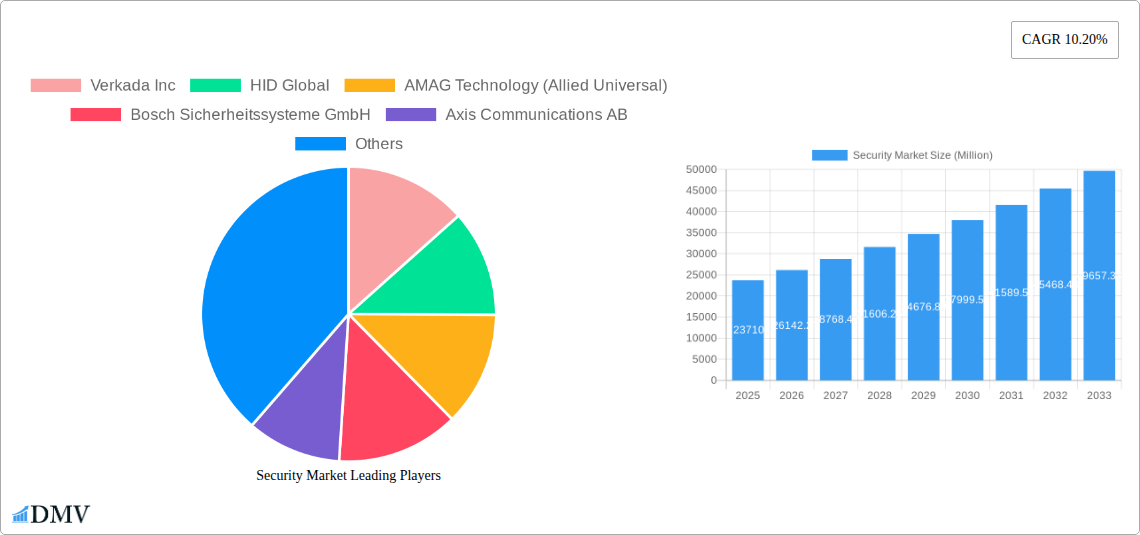
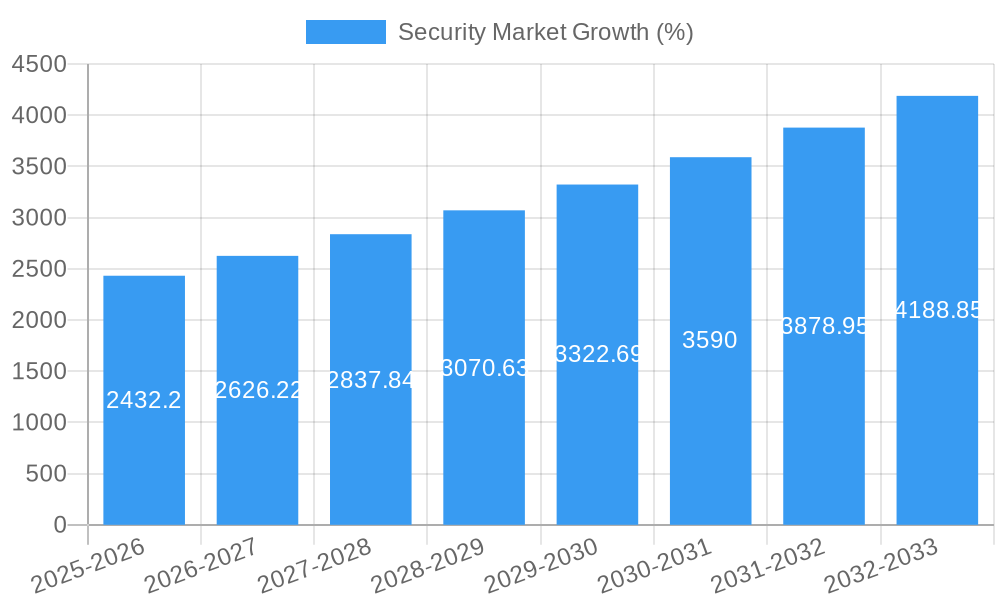
The global security market, valued at $23.71 billion in 2025, is projected to experience robust growth, driven by a compound annual growth rate (CAGR) of 10.20% from 2025 to 2033. This expansion is fueled by several key factors. The increasing prevalence of cyber threats and data breaches across various sectors is compelling organizations to invest heavily in advanced security solutions, including network security, cloud security, and endpoint protection. Furthermore, the rising adoption of IoT devices and smart technologies, while offering numerous benefits, also expands the attack surface, necessitating robust security measures. Government regulations aimed at enhancing data privacy and security are also contributing to market growth, pushing organizations to comply with stringent standards. Finally, the escalating demand for physical security solutions, encompassing access control systems, video surveillance, and alarm systems, in both commercial and residential settings, further bolsters market expansion.
The competitive landscape is characterized by a mix of established players and emerging technology providers. Key players like Verkada, HID Global, and AMAG Technology are leveraging their extensive experience and market presence to maintain a strong foothold. Meanwhile, innovative companies are introducing cutting-edge solutions, driving competition and fostering market dynamism. Geographic expansion is another significant trend, with developing economies exhibiting particularly strong growth potential. However, challenges remain, including the high cost of implementing advanced security systems, particularly for small and medium-sized enterprises (SMEs), and the complexities associated with integrating diverse security solutions. Despite these hurdles, the long-term outlook for the security market remains positive, fueled by consistent technological advancements and the ongoing need for enhanced security in a rapidly evolving digital landscape.
Security Market: A Comprehensive Analysis (2019-2033)
This insightful report provides a detailed analysis of the Security Market, projecting robust growth from 2025 to 2033. We delve into market composition, technological advancements, key players, and emerging opportunities, offering a crucial resource for stakeholders seeking to navigate this dynamic sector. The study period spans from 2019 to 2033, with 2025 serving as the base and estimated year.
Security Market Composition & Trends
The Security Market, valued at xx Million in 2025, exhibits a complex interplay of factors influencing its growth trajectory. Market concentration is moderate, with a few dominant players like Honeywell International Inc and Bosch Sicherheitssysteme GmbH holding significant shares, while numerous smaller players contribute to the competitive landscape. The market share distribution reveals a dynamic shift towards integrated security solutions, driving consolidation through mergers and acquisitions (M&A). Significant M&A activity, totaling an estimated xx Million in deal value during the historical period (2019-2024), further underscores this trend.
- Market Concentration: Moderate, with some dominant players.
- Innovation Catalysts: Advancements in AI, IoT, and cloud computing are driving product innovation and market expansion.
- Regulatory Landscape: Evolving data privacy regulations and cybersecurity standards are shaping market dynamics.
- Substitute Products: Traditional security solutions face competition from emerging technologies.
- End-User Profiles: The market comprises diverse end-users including government agencies, businesses, and residential customers.
- M&A Activities: Significant activity, indicating industry consolidation and growth opportunities. Estimated value of M&A deals during 2019-2024: xx Million.
Security Market Industry Evolution
The Security Market has witnessed significant evolution over the past five years (2019-2024). Growth has been fueled by rising concerns about cybersecurity threats, increasing adoption of smart home technologies, and expanding government initiatives to improve national security. Technological advancements, such as AI-powered video analytics, cloud-based security management platforms, and biometric authentication systems, have redefined security solutions. Demand for integrated security systems that combine multiple security functions into a single platform is experiencing rapid growth. The market experienced a compound annual growth rate (CAGR) of xx% during the historical period (2019-2024) and is projected to grow at a CAGR of xx% during the forecast period (2025-2033), reaching a value of xx Million by 2033. Consumer demand shifts towards user-friendly, cost-effective, and scalable solutions are evident. Adoption of cloud-based solutions has steadily increased, representing xx% of the total market in 2024.
Leading Regions, Countries, or Segments in Security Market
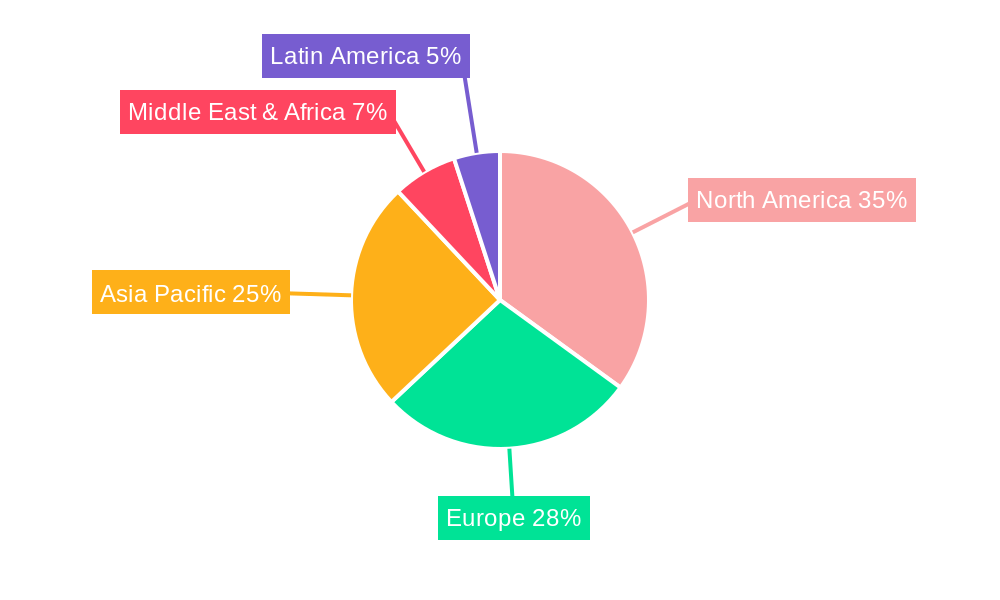
North America currently dominates the Security Market, driven by high technological adoption rates, stringent security regulations, and robust investments in cybersecurity infrastructure. Europe follows closely, with strong growth prospects in Western and Eastern European countries.
- Key Drivers for North American Dominance:
- High levels of technological adoption
- Stringent data privacy regulations
- Significant investment in cybersecurity infrastructure
- Large presence of major security vendors
- Other Key Regions: Europe, Asia-Pacific, and the Middle East are experiencing substantial growth, driven by factors such as increasing urbanization, rising concerns over cybersecurity, and improving infrastructure development.
Security Market Product Innovations
Recent innovations focus on integrating AI, IoT, and cloud technologies to enhance security systems' efficiency and effectiveness. This includes AI-powered video analytics for threat detection and response, smart locks with remote access capabilities, and cloud-based security management systems that provide centralized monitoring and control. These advancements offer enhanced capabilities such as improved threat detection accuracy, reduced response times, and enhanced user experience, providing unique selling propositions in a competitive landscape.
Propelling Factors for Security Market Growth
Several factors propel the Security Market's growth. Firstly, increasing cybersecurity threats drive demand for robust security solutions across industries. Secondly, government regulations and initiatives promote cybersecurity awareness and adoption of advanced technologies. Thirdly, technological advancements, such as AI, IoT, and cloud computing, provide innovative and effective security measures. Finally, economic growth in developing countries fosters increased spending on security infrastructure.
Obstacles in the Security Market
The Security Market faces several challenges. Regulatory complexities and varying data privacy laws across jurisdictions create hurdles for international expansion and standardization. Supply chain disruptions, particularly concerning crucial components, can impact production and delivery times, potentially resulting in xx Million in lost revenue annually. Intense competition from established players and new entrants also poses a threat, putting pressure on profit margins.
Future Opportunities in Security Market
The Security Market presents significant opportunities. The rising adoption of smart city initiatives creates demand for integrated security systems. Advancements in AI and machine learning offer potential for improved threat detection and response. The expansion of IoT devices generates opportunities for connected security solutions, while the growing adoption of cloud-based security platforms simplifies management and scalability.
Major Players in the Security Market Ecosystem
- Verkada Inc
- HID Global
- AMAG Technology (Allied Universal)
- Bosch Sicherheitssysteme GmbH
- Axis Communications AB
- Honeywell International Inc
- Johnson Controls
- ADT Inc
- Securitas Technology
- Assa Abloy Group
- Genetec Inc
- Palo Alto Networks
- Fortinet Inc
- IBM Corporation
- Cisco Systems Inc
Key Developments in Security Market Industry
- August 2024: Alfred International launched its patented Alfred ML2 Smart Mortise Lock with Z-Wave Long Range, offering a retrofit solution for upgrading older mortise locks to smart locks. This addresses a significant market need for convenient smart home upgrades.
- May 2024: Palo Alto Networks and IBM partnered to deliver AI-driven security outcomes, leveraging their expertise in cybersecurity and AI to address increasingly sophisticated threats. This collaboration enhances security operations and facilitates faster incident response.
Strategic Security Market Forecast
The Security Market is poised for sustained growth, driven by the convergence of technological innovation, increasing cybersecurity concerns, and supportive regulatory frameworks. The market's future potential is vast, with significant opportunities in emerging technologies such as AI, IoT, and cloud computing shaping the landscape and driving demand for innovative and integrated security solutions. Continued investment in R&D, strategic partnerships, and expansion into new markets will be key factors in determining future success.
Security Market Segmentation
-
1. Security Type
-
1.1. Physical Security
- 1.1.1. Access Control
- 1.1.2. Video Surveillance
- 1.1.3. Intrusion Detection
- 1.1.4. Perimeter Security
-
1.2. Cyber Security
- 1.2.1. Network Security
- 1.2.2. End Point Security
- 1.2.3. Application Security
- 1.2.4. Cloud Security
- 1.2.5. Information Security
-
1.1. Physical Security
-
2. End-user Vertical
- 2.1. Government and Public Sector
- 2.2. Commercial
- 2.3. Industrial
- 2.4. Residential
- 2.5. Healthcare
- 2.6. Education
- 2.7. Critical Infrastructure
-
3. Solution Type
- 3.1. Hardware
- 3.2. Software
- 3.3. Services
-
4. Deployment Type
- 4.1. On-premise
- 4.2. Cloud-based
Security Market Segmentation By Geography
- 1. North America
- 2. Europe
- 3. Asia
- 4. Australia and New Zealand
- 5. Latin America
- 6. Middle East and Africa
Security Market REPORT HIGHLIGHTS
| Aspects | Details |
|---|---|
| Study Period | 2019-2033 |
| Base Year | 2024 |
| Estimated Year | 2025 |
| Forecast Period | 2025-2033 |
| Historical Period | 2019-2024 |
| Growth Rate | CAGR of 10.20% from 2019-2033 |
| Segmentation |
|
Table of Contents
- 1. Introduction
- 1.1. Research Scope
- 1.2. Market Segmentation
- 1.3. Research Methodology
- 1.4. Definitions and Assumptions
- 2. Executive Summary
- 2.1. Introduction
- 3. Market Dynamics
- 3.1. Introduction
- 3.2. Market Drivers
- 3.2.1. Increasing Cyber Threats; Growth in IoT Devices
- 3.3. Market Restrains
- 3.3.1. Increasing Cyber Threats; Growth in IoT Devices
- 3.4. Market Trends
- 3.4.1. Commercial Sector Witnessing Demand
- 4. Market Factor Analysis
- 4.1. Porters Five Forces
- 4.2. Supply/Value Chain
- 4.3. PESTEL analysis
- 4.4. Market Entropy
- 4.5. Patent/Trademark Analysis
- 5. Global Security Market Analysis, Insights and Forecast, 2019-2031
- 5.1. Market Analysis, Insights and Forecast - by Security Type
- 5.1.1. Physical Security
- 5.1.1.1. Access Control
- 5.1.1.2. Video Surveillance
- 5.1.1.3. Intrusion Detection
- 5.1.1.4. Perimeter Security
- 5.1.2. Cyber Security
- 5.1.2.1. Network Security
- 5.1.2.2. End Point Security
- 5.1.2.3. Application Security
- 5.1.2.4. Cloud Security
- 5.1.2.5. Information Security
- 5.1.1. Physical Security
- 5.2. Market Analysis, Insights and Forecast - by End-user Vertical
- 5.2.1. Government and Public Sector
- 5.2.2. Commercial
- 5.2.3. Industrial
- 5.2.4. Residential
- 5.2.5. Healthcare
- 5.2.6. Education
- 5.2.7. Critical Infrastructure
- 5.3. Market Analysis, Insights and Forecast - by Solution Type
- 5.3.1. Hardware
- 5.3.2. Software
- 5.3.3. Services
- 5.4. Market Analysis, Insights and Forecast - by Deployment Type
- 5.4.1. On-premise
- 5.4.2. Cloud-based
- 5.5. Market Analysis, Insights and Forecast - by Region
- 5.5.1. North America
- 5.5.2. Europe
- 5.5.3. Asia
- 5.5.4. Australia and New Zealand
- 5.5.5. Latin America
- 5.5.6. Middle East and Africa
- 5.1. Market Analysis, Insights and Forecast - by Security Type
- 6. North America Security Market Analysis, Insights and Forecast, 2019-2031
- 6.1. Market Analysis, Insights and Forecast - by Security Type
- 6.1.1. Physical Security
- 6.1.1.1. Access Control
- 6.1.1.2. Video Surveillance
- 6.1.1.3. Intrusion Detection
- 6.1.1.4. Perimeter Security
- 6.1.2. Cyber Security
- 6.1.2.1. Network Security
- 6.1.2.2. End Point Security
- 6.1.2.3. Application Security
- 6.1.2.4. Cloud Security
- 6.1.2.5. Information Security
- 6.1.1. Physical Security
- 6.2. Market Analysis, Insights and Forecast - by End-user Vertical
- 6.2.1. Government and Public Sector
- 6.2.2. Commercial
- 6.2.3. Industrial
- 6.2.4. Residential
- 6.2.5. Healthcare
- 6.2.6. Education
- 6.2.7. Critical Infrastructure
- 6.3. Market Analysis, Insights and Forecast - by Solution Type
- 6.3.1. Hardware
- 6.3.2. Software
- 6.3.3. Services
- 6.4. Market Analysis, Insights and Forecast - by Deployment Type
- 6.4.1. On-premise
- 6.4.2. Cloud-based
- 6.1. Market Analysis, Insights and Forecast - by Security Type
- 7. Europe Security Market Analysis, Insights and Forecast, 2019-2031
- 7.1. Market Analysis, Insights and Forecast - by Security Type
- 7.1.1. Physical Security
- 7.1.1.1. Access Control
- 7.1.1.2. Video Surveillance
- 7.1.1.3. Intrusion Detection
- 7.1.1.4. Perimeter Security
- 7.1.2. Cyber Security
- 7.1.2.1. Network Security
- 7.1.2.2. End Point Security
- 7.1.2.3. Application Security
- 7.1.2.4. Cloud Security
- 7.1.2.5. Information Security
- 7.1.1. Physical Security
- 7.2. Market Analysis, Insights and Forecast - by End-user Vertical
- 7.2.1. Government and Public Sector
- 7.2.2. Commercial
- 7.2.3. Industrial
- 7.2.4. Residential
- 7.2.5. Healthcare
- 7.2.6. Education
- 7.2.7. Critical Infrastructure
- 7.3. Market Analysis, Insights and Forecast - by Solution Type
- 7.3.1. Hardware
- 7.3.2. Software
- 7.3.3. Services
- 7.4. Market Analysis, Insights and Forecast - by Deployment Type
- 7.4.1. On-premise
- 7.4.2. Cloud-based
- 7.1. Market Analysis, Insights and Forecast - by Security Type
- 8. Asia Security Market Analysis, Insights and Forecast, 2019-2031
- 8.1. Market Analysis, Insights and Forecast - by Security Type
- 8.1.1. Physical Security
- 8.1.1.1. Access Control
- 8.1.1.2. Video Surveillance
- 8.1.1.3. Intrusion Detection
- 8.1.1.4. Perimeter Security
- 8.1.2. Cyber Security
- 8.1.2.1. Network Security
- 8.1.2.2. End Point Security
- 8.1.2.3. Application Security
- 8.1.2.4. Cloud Security
- 8.1.2.5. Information Security
- 8.1.1. Physical Security
- 8.2. Market Analysis, Insights and Forecast - by End-user Vertical
- 8.2.1. Government and Public Sector
- 8.2.2. Commercial
- 8.2.3. Industrial
- 8.2.4. Residential
- 8.2.5. Healthcare
- 8.2.6. Education
- 8.2.7. Critical Infrastructure
- 8.3. Market Analysis, Insights and Forecast - by Solution Type
- 8.3.1. Hardware
- 8.3.2. Software
- 8.3.3. Services
- 8.4. Market Analysis, Insights and Forecast - by Deployment Type
- 8.4.1. On-premise
- 8.4.2. Cloud-based
- 8.1. Market Analysis, Insights and Forecast - by Security Type
- 9. Australia and New Zealand Security Market Analysis, Insights and Forecast, 2019-2031
- 9.1. Market Analysis, Insights and Forecast - by Security Type
- 9.1.1. Physical Security
- 9.1.1.1. Access Control
- 9.1.1.2. Video Surveillance
- 9.1.1.3. Intrusion Detection
- 9.1.1.4. Perimeter Security
- 9.1.2. Cyber Security
- 9.1.2.1. Network Security
- 9.1.2.2. End Point Security
- 9.1.2.3. Application Security
- 9.1.2.4. Cloud Security
- 9.1.2.5. Information Security
- 9.1.1. Physical Security
- 9.2. Market Analysis, Insights and Forecast - by End-user Vertical
- 9.2.1. Government and Public Sector
- 9.2.2. Commercial
- 9.2.3. Industrial
- 9.2.4. Residential
- 9.2.5. Healthcare
- 9.2.6. Education
- 9.2.7. Critical Infrastructure
- 9.3. Market Analysis, Insights and Forecast - by Solution Type
- 9.3.1. Hardware
- 9.3.2. Software
- 9.3.3. Services
- 9.4. Market Analysis, Insights and Forecast - by Deployment Type
- 9.4.1. On-premise
- 9.4.2. Cloud-based
- 9.1. Market Analysis, Insights and Forecast - by Security Type
- 10. Latin America Security Market Analysis, Insights and Forecast, 2019-2031
- 10.1. Market Analysis, Insights and Forecast - by Security Type
- 10.1.1. Physical Security
- 10.1.1.1. Access Control
- 10.1.1.2. Video Surveillance
- 10.1.1.3. Intrusion Detection
- 10.1.1.4. Perimeter Security
- 10.1.2. Cyber Security
- 10.1.2.1. Network Security
- 10.1.2.2. End Point Security
- 10.1.2.3. Application Security
- 10.1.2.4. Cloud Security
- 10.1.2.5. Information Security
- 10.1.1. Physical Security
- 10.2. Market Analysis, Insights and Forecast - by End-user Vertical
- 10.2.1. Government and Public Sector
- 10.2.2. Commercial
- 10.2.3. Industrial
- 10.2.4. Residential
- 10.2.5. Healthcare
- 10.2.6. Education
- 10.2.7. Critical Infrastructure
- 10.3. Market Analysis, Insights and Forecast - by Solution Type
- 10.3.1. Hardware
- 10.3.2. Software
- 10.3.3. Services
- 10.4. Market Analysis, Insights and Forecast - by Deployment Type
- 10.4.1. On-premise
- 10.4.2. Cloud-based
- 10.1. Market Analysis, Insights and Forecast - by Security Type
- 11. Middle East and Africa Security Market Analysis, Insights and Forecast, 2019-2031
- 11.1. Market Analysis, Insights and Forecast - by Security Type
- 11.1.1. Physical Security
- 11.1.1.1. Access Control
- 11.1.1.2. Video Surveillance
- 11.1.1.3. Intrusion Detection
- 11.1.1.4. Perimeter Security
- 11.1.2. Cyber Security
- 11.1.2.1. Network Security
- 11.1.2.2. End Point Security
- 11.1.2.3. Application Security
- 11.1.2.4. Cloud Security
- 11.1.2.5. Information Security
- 11.1.1. Physical Security
- 11.2. Market Analysis, Insights and Forecast - by End-user Vertical
- 11.2.1. Government and Public Sector
- 11.2.2. Commercial
- 11.2.3. Industrial
- 11.2.4. Residential
- 11.2.5. Healthcare
- 11.2.6. Education
- 11.2.7. Critical Infrastructure
- 11.3. Market Analysis, Insights and Forecast - by Solution Type
- 11.3.1. Hardware
- 11.3.2. Software
- 11.3.3. Services
- 11.4. Market Analysis, Insights and Forecast - by Deployment Type
- 11.4.1. On-premise
- 11.4.2. Cloud-based
- 11.1. Market Analysis, Insights and Forecast - by Security Type
- 12. Competitive Analysis
- 12.1. Global Market Share Analysis 2024
- 12.2. Company Profiles
- 12.2.1 Verkada Inc
- 12.2.1.1. Overview
- 12.2.1.2. Products
- 12.2.1.3. SWOT Analysis
- 12.2.1.4. Recent Developments
- 12.2.1.5. Financials (Based on Availability)
- 12.2.2 HID Global
- 12.2.2.1. Overview
- 12.2.2.2. Products
- 12.2.2.3. SWOT Analysis
- 12.2.2.4. Recent Developments
- 12.2.2.5. Financials (Based on Availability)
- 12.2.3 AMAG Technology (Allied Universal)
- 12.2.3.1. Overview
- 12.2.3.2. Products
- 12.2.3.3. SWOT Analysis
- 12.2.3.4. Recent Developments
- 12.2.3.5. Financials (Based on Availability)
- 12.2.4 Bosch Sicherheitssysteme GmbH
- 12.2.4.1. Overview
- 12.2.4.2. Products
- 12.2.4.3. SWOT Analysis
- 12.2.4.4. Recent Developments
- 12.2.4.5. Financials (Based on Availability)
- 12.2.5 Axis Communications AB
- 12.2.5.1. Overview
- 12.2.5.2. Products
- 12.2.5.3. SWOT Analysis
- 12.2.5.4. Recent Developments
- 12.2.5.5. Financials (Based on Availability)
- 12.2.6 Honeywell International Inc
- 12.2.6.1. Overview
- 12.2.6.2. Products
- 12.2.6.3. SWOT Analysis
- 12.2.6.4. Recent Developments
- 12.2.6.5. Financials (Based on Availability)
- 12.2.7 Johnson Controls
- 12.2.7.1. Overview
- 12.2.7.2. Products
- 12.2.7.3. SWOT Analysis
- 12.2.7.4. Recent Developments
- 12.2.7.5. Financials (Based on Availability)
- 12.2.8 ADT Inc
- 12.2.8.1. Overview
- 12.2.8.2. Products
- 12.2.8.3. SWOT Analysis
- 12.2.8.4. Recent Developments
- 12.2.8.5. Financials (Based on Availability)
- 12.2.9 Securitas Technology
- 12.2.9.1. Overview
- 12.2.9.2. Products
- 12.2.9.3. SWOT Analysis
- 12.2.9.4. Recent Developments
- 12.2.9.5. Financials (Based on Availability)
- 12.2.10 Assa Abloy Group
- 12.2.10.1. Overview
- 12.2.10.2. Products
- 12.2.10.3. SWOT Analysis
- 12.2.10.4. Recent Developments
- 12.2.10.5. Financials (Based on Availability)
- 12.2.11 Genetec Inc
- 12.2.11.1. Overview
- 12.2.11.2. Products
- 12.2.11.3. SWOT Analysis
- 12.2.11.4. Recent Developments
- 12.2.11.5. Financials (Based on Availability)
- 12.2.12 Palo Alto Networks
- 12.2.12.1. Overview
- 12.2.12.2. Products
- 12.2.12.3. SWOT Analysis
- 12.2.12.4. Recent Developments
- 12.2.12.5. Financials (Based on Availability)
- 12.2.13 Fortinet Inc
- 12.2.13.1. Overview
- 12.2.13.2. Products
- 12.2.13.3. SWOT Analysis
- 12.2.13.4. Recent Developments
- 12.2.13.5. Financials (Based on Availability)
- 12.2.14 IBM Corporation
- 12.2.14.1. Overview
- 12.2.14.2. Products
- 12.2.14.3. SWOT Analysis
- 12.2.14.4. Recent Developments
- 12.2.14.5. Financials (Based on Availability)
- 12.2.15 Cisco Systems Inc
- 12.2.15.1. Overview
- 12.2.15.2. Products
- 12.2.15.3. SWOT Analysis
- 12.2.15.4. Recent Developments
- 12.2.15.5. Financials (Based on Availability)
- 12.2.1 Verkada Inc
List of Figures
- Figure 1: Global Security Market Revenue Breakdown (Million, %) by Region 2024 & 2032
- Figure 2: Global Security Market Volume Breakdown (Billion, %) by Region 2024 & 2032
- Figure 3: North America Security Market Revenue (Million), by Security Type 2024 & 2032
- Figure 4: North America Security Market Volume (Billion), by Security Type 2024 & 2032
- Figure 5: North America Security Market Revenue Share (%), by Security Type 2024 & 2032
- Figure 6: North America Security Market Volume Share (%), by Security Type 2024 & 2032
- Figure 7: North America Security Market Revenue (Million), by End-user Vertical 2024 & 2032
- Figure 8: North America Security Market Volume (Billion), by End-user Vertical 2024 & 2032
- Figure 9: North America Security Market Revenue Share (%), by End-user Vertical 2024 & 2032
- Figure 10: North America Security Market Volume Share (%), by End-user Vertical 2024 & 2032
- Figure 11: North America Security Market Revenue (Million), by Solution Type 2024 & 2032
- Figure 12: North America Security Market Volume (Billion), by Solution Type 2024 & 2032
- Figure 13: North America Security Market Revenue Share (%), by Solution Type 2024 & 2032
- Figure 14: North America Security Market Volume Share (%), by Solution Type 2024 & 2032
- Figure 15: North America Security Market Revenue (Million), by Deployment Type 2024 & 2032
- Figure 16: North America Security Market Volume (Billion), by Deployment Type 2024 & 2032
- Figure 17: North America Security Market Revenue Share (%), by Deployment Type 2024 & 2032
- Figure 18: North America Security Market Volume Share (%), by Deployment Type 2024 & 2032
- Figure 19: North America Security Market Revenue (Million), by Country 2024 & 2032
- Figure 20: North America Security Market Volume (Billion), by Country 2024 & 2032
- Figure 21: North America Security Market Revenue Share (%), by Country 2024 & 2032
- Figure 22: North America Security Market Volume Share (%), by Country 2024 & 2032
- Figure 23: Europe Security Market Revenue (Million), by Security Type 2024 & 2032
- Figure 24: Europe Security Market Volume (Billion), by Security Type 2024 & 2032
- Figure 25: Europe Security Market Revenue Share (%), by Security Type 2024 & 2032
- Figure 26: Europe Security Market Volume Share (%), by Security Type 2024 & 2032
- Figure 27: Europe Security Market Revenue (Million), by End-user Vertical 2024 & 2032
- Figure 28: Europe Security Market Volume (Billion), by End-user Vertical 2024 & 2032
- Figure 29: Europe Security Market Revenue Share (%), by End-user Vertical 2024 & 2032
- Figure 30: Europe Security Market Volume Share (%), by End-user Vertical 2024 & 2032
- Figure 31: Europe Security Market Revenue (Million), by Solution Type 2024 & 2032
- Figure 32: Europe Security Market Volume (Billion), by Solution Type 2024 & 2032
- Figure 33: Europe Security Market Revenue Share (%), by Solution Type 2024 & 2032
- Figure 34: Europe Security Market Volume Share (%), by Solution Type 2024 & 2032
- Figure 35: Europe Security Market Revenue (Million), by Deployment Type 2024 & 2032
- Figure 36: Europe Security Market Volume (Billion), by Deployment Type 2024 & 2032
- Figure 37: Europe Security Market Revenue Share (%), by Deployment Type 2024 & 2032
- Figure 38: Europe Security Market Volume Share (%), by Deployment Type 2024 & 2032
- Figure 39: Europe Security Market Revenue (Million), by Country 2024 & 2032
- Figure 40: Europe Security Market Volume (Billion), by Country 2024 & 2032
- Figure 41: Europe Security Market Revenue Share (%), by Country 2024 & 2032
- Figure 42: Europe Security Market Volume Share (%), by Country 2024 & 2032
- Figure 43: Asia Security Market Revenue (Million), by Security Type 2024 & 2032
- Figure 44: Asia Security Market Volume (Billion), by Security Type 2024 & 2032
- Figure 45: Asia Security Market Revenue Share (%), by Security Type 2024 & 2032
- Figure 46: Asia Security Market Volume Share (%), by Security Type 2024 & 2032
- Figure 47: Asia Security Market Revenue (Million), by End-user Vertical 2024 & 2032
- Figure 48: Asia Security Market Volume (Billion), by End-user Vertical 2024 & 2032
- Figure 49: Asia Security Market Revenue Share (%), by End-user Vertical 2024 & 2032
- Figure 50: Asia Security Market Volume Share (%), by End-user Vertical 2024 & 2032
- Figure 51: Asia Security Market Revenue (Million), by Solution Type 2024 & 2032
- Figure 52: Asia Security Market Volume (Billion), by Solution Type 2024 & 2032
- Figure 53: Asia Security Market Revenue Share (%), by Solution Type 2024 & 2032
- Figure 54: Asia Security Market Volume Share (%), by Solution Type 2024 & 2032
- Figure 55: Asia Security Market Revenue (Million), by Deployment Type 2024 & 2032
- Figure 56: Asia Security Market Volume (Billion), by Deployment Type 2024 & 2032
- Figure 57: Asia Security Market Revenue Share (%), by Deployment Type 2024 & 2032
- Figure 58: Asia Security Market Volume Share (%), by Deployment Type 2024 & 2032
- Figure 59: Asia Security Market Revenue (Million), by Country 2024 & 2032
- Figure 60: Asia Security Market Volume (Billion), by Country 2024 & 2032
- Figure 61: Asia Security Market Revenue Share (%), by Country 2024 & 2032
- Figure 62: Asia Security Market Volume Share (%), by Country 2024 & 2032
- Figure 63: Australia and New Zealand Security Market Revenue (Million), by Security Type 2024 & 2032
- Figure 64: Australia and New Zealand Security Market Volume (Billion), by Security Type 2024 & 2032
- Figure 65: Australia and New Zealand Security Market Revenue Share (%), by Security Type 2024 & 2032
- Figure 66: Australia and New Zealand Security Market Volume Share (%), by Security Type 2024 & 2032
- Figure 67: Australia and New Zealand Security Market Revenue (Million), by End-user Vertical 2024 & 2032
- Figure 68: Australia and New Zealand Security Market Volume (Billion), by End-user Vertical 2024 & 2032
- Figure 69: Australia and New Zealand Security Market Revenue Share (%), by End-user Vertical 2024 & 2032
- Figure 70: Australia and New Zealand Security Market Volume Share (%), by End-user Vertical 2024 & 2032
- Figure 71: Australia and New Zealand Security Market Revenue (Million), by Solution Type 2024 & 2032
- Figure 72: Australia and New Zealand Security Market Volume (Billion), by Solution Type 2024 & 2032
- Figure 73: Australia and New Zealand Security Market Revenue Share (%), by Solution Type 2024 & 2032
- Figure 74: Australia and New Zealand Security Market Volume Share (%), by Solution Type 2024 & 2032
- Figure 75: Australia and New Zealand Security Market Revenue (Million), by Deployment Type 2024 & 2032
- Figure 76: Australia and New Zealand Security Market Volume (Billion), by Deployment Type 2024 & 2032
- Figure 77: Australia and New Zealand Security Market Revenue Share (%), by Deployment Type 2024 & 2032
- Figure 78: Australia and New Zealand Security Market Volume Share (%), by Deployment Type 2024 & 2032
- Figure 79: Australia and New Zealand Security Market Revenue (Million), by Country 2024 & 2032
- Figure 80: Australia and New Zealand Security Market Volume (Billion), by Country 2024 & 2032
- Figure 81: Australia and New Zealand Security Market Revenue Share (%), by Country 2024 & 2032
- Figure 82: Australia and New Zealand Security Market Volume Share (%), by Country 2024 & 2032
- Figure 83: Latin America Security Market Revenue (Million), by Security Type 2024 & 2032
- Figure 84: Latin America Security Market Volume (Billion), by Security Type 2024 & 2032
- Figure 85: Latin America Security Market Revenue Share (%), by Security Type 2024 & 2032
- Figure 86: Latin America Security Market Volume Share (%), by Security Type 2024 & 2032
- Figure 87: Latin America Security Market Revenue (Million), by End-user Vertical 2024 & 2032
- Figure 88: Latin America Security Market Volume (Billion), by End-user Vertical 2024 & 2032
- Figure 89: Latin America Security Market Revenue Share (%), by End-user Vertical 2024 & 2032
- Figure 90: Latin America Security Market Volume Share (%), by End-user Vertical 2024 & 2032
- Figure 91: Latin America Security Market Revenue (Million), by Solution Type 2024 & 2032
- Figure 92: Latin America Security Market Volume (Billion), by Solution Type 2024 & 2032
- Figure 93: Latin America Security Market Revenue Share (%), by Solution Type 2024 & 2032
- Figure 94: Latin America Security Market Volume Share (%), by Solution Type 2024 & 2032
- Figure 95: Latin America Security Market Revenue (Million), by Deployment Type 2024 & 2032
- Figure 96: Latin America Security Market Volume (Billion), by Deployment Type 2024 & 2032
- Figure 97: Latin America Security Market Revenue Share (%), by Deployment Type 2024 & 2032
- Figure 98: Latin America Security Market Volume Share (%), by Deployment Type 2024 & 2032
- Figure 99: Latin America Security Market Revenue (Million), by Country 2024 & 2032
- Figure 100: Latin America Security Market Volume (Billion), by Country 2024 & 2032
- Figure 101: Latin America Security Market Revenue Share (%), by Country 2024 & 2032
- Figure 102: Latin America Security Market Volume Share (%), by Country 2024 & 2032
- Figure 103: Middle East and Africa Security Market Revenue (Million), by Security Type 2024 & 2032
- Figure 104: Middle East and Africa Security Market Volume (Billion), by Security Type 2024 & 2032
- Figure 105: Middle East and Africa Security Market Revenue Share (%), by Security Type 2024 & 2032
- Figure 106: Middle East and Africa Security Market Volume Share (%), by Security Type 2024 & 2032
- Figure 107: Middle East and Africa Security Market Revenue (Million), by End-user Vertical 2024 & 2032
- Figure 108: Middle East and Africa Security Market Volume (Billion), by End-user Vertical 2024 & 2032
- Figure 109: Middle East and Africa Security Market Revenue Share (%), by End-user Vertical 2024 & 2032
- Figure 110: Middle East and Africa Security Market Volume Share (%), by End-user Vertical 2024 & 2032
- Figure 111: Middle East and Africa Security Market Revenue (Million), by Solution Type 2024 & 2032
- Figure 112: Middle East and Africa Security Market Volume (Billion), by Solution Type 2024 & 2032
- Figure 113: Middle East and Africa Security Market Revenue Share (%), by Solution Type 2024 & 2032
- Figure 114: Middle East and Africa Security Market Volume Share (%), by Solution Type 2024 & 2032
- Figure 115: Middle East and Africa Security Market Revenue (Million), by Deployment Type 2024 & 2032
- Figure 116: Middle East and Africa Security Market Volume (Billion), by Deployment Type 2024 & 2032
- Figure 117: Middle East and Africa Security Market Revenue Share (%), by Deployment Type 2024 & 2032
- Figure 118: Middle East and Africa Security Market Volume Share (%), by Deployment Type 2024 & 2032
- Figure 119: Middle East and Africa Security Market Revenue (Million), by Country 2024 & 2032
- Figure 120: Middle East and Africa Security Market Volume (Billion), by Country 2024 & 2032
- Figure 121: Middle East and Africa Security Market Revenue Share (%), by Country 2024 & 2032
- Figure 122: Middle East and Africa Security Market Volume Share (%), by Country 2024 & 2032
List of Tables
- Table 1: Global Security Market Revenue Million Forecast, by Region 2019 & 2032
- Table 2: Global Security Market Volume Billion Forecast, by Region 2019 & 2032
- Table 3: Global Security Market Revenue Million Forecast, by Security Type 2019 & 2032
- Table 4: Global Security Market Volume Billion Forecast, by Security Type 2019 & 2032
- Table 5: Global Security Market Revenue Million Forecast, by End-user Vertical 2019 & 2032
- Table 6: Global Security Market Volume Billion Forecast, by End-user Vertical 2019 & 2032
- Table 7: Global Security Market Revenue Million Forecast, by Solution Type 2019 & 2032
- Table 8: Global Security Market Volume Billion Forecast, by Solution Type 2019 & 2032
- Table 9: Global Security Market Revenue Million Forecast, by Deployment Type 2019 & 2032
- Table 10: Global Security Market Volume Billion Forecast, by Deployment Type 2019 & 2032
- Table 11: Global Security Market Revenue Million Forecast, by Region 2019 & 2032
- Table 12: Global Security Market Volume Billion Forecast, by Region 2019 & 2032
- Table 13: Global Security Market Revenue Million Forecast, by Security Type 2019 & 2032
- Table 14: Global Security Market Volume Billion Forecast, by Security Type 2019 & 2032
- Table 15: Global Security Market Revenue Million Forecast, by End-user Vertical 2019 & 2032
- Table 16: Global Security Market Volume Billion Forecast, by End-user Vertical 2019 & 2032
- Table 17: Global Security Market Revenue Million Forecast, by Solution Type 2019 & 2032
- Table 18: Global Security Market Volume Billion Forecast, by Solution Type 2019 & 2032
- Table 19: Global Security Market Revenue Million Forecast, by Deployment Type 2019 & 2032
- Table 20: Global Security Market Volume Billion Forecast, by Deployment Type 2019 & 2032
- Table 21: Global Security Market Revenue Million Forecast, by Country 2019 & 2032
- Table 22: Global Security Market Volume Billion Forecast, by Country 2019 & 2032
- Table 23: Global Security Market Revenue Million Forecast, by Security Type 2019 & 2032
- Table 24: Global Security Market Volume Billion Forecast, by Security Type 2019 & 2032
- Table 25: Global Security Market Revenue Million Forecast, by End-user Vertical 2019 & 2032
- Table 26: Global Security Market Volume Billion Forecast, by End-user Vertical 2019 & 2032
- Table 27: Global Security Market Revenue Million Forecast, by Solution Type 2019 & 2032
- Table 28: Global Security Market Volume Billion Forecast, by Solution Type 2019 & 2032
- Table 29: Global Security Market Revenue Million Forecast, by Deployment Type 2019 & 2032
- Table 30: Global Security Market Volume Billion Forecast, by Deployment Type 2019 & 2032
- Table 31: Global Security Market Revenue Million Forecast, by Country 2019 & 2032
- Table 32: Global Security Market Volume Billion Forecast, by Country 2019 & 2032
- Table 33: Global Security Market Revenue Million Forecast, by Security Type 2019 & 2032
- Table 34: Global Security Market Volume Billion Forecast, by Security Type 2019 & 2032
- Table 35: Global Security Market Revenue Million Forecast, by End-user Vertical 2019 & 2032
- Table 36: Global Security Market Volume Billion Forecast, by End-user Vertical 2019 & 2032
- Table 37: Global Security Market Revenue Million Forecast, by Solution Type 2019 & 2032
- Table 38: Global Security Market Volume Billion Forecast, by Solution Type 2019 & 2032
- Table 39: Global Security Market Revenue Million Forecast, by Deployment Type 2019 & 2032
- Table 40: Global Security Market Volume Billion Forecast, by Deployment Type 2019 & 2032
- Table 41: Global Security Market Revenue Million Forecast, by Country 2019 & 2032
- Table 42: Global Security Market Volume Billion Forecast, by Country 2019 & 2032
- Table 43: Global Security Market Revenue Million Forecast, by Security Type 2019 & 2032
- Table 44: Global Security Market Volume Billion Forecast, by Security Type 2019 & 2032
- Table 45: Global Security Market Revenue Million Forecast, by End-user Vertical 2019 & 2032
- Table 46: Global Security Market Volume Billion Forecast, by End-user Vertical 2019 & 2032
- Table 47: Global Security Market Revenue Million Forecast, by Solution Type 2019 & 2032
- Table 48: Global Security Market Volume Billion Forecast, by Solution Type 2019 & 2032
- Table 49: Global Security Market Revenue Million Forecast, by Deployment Type 2019 & 2032
- Table 50: Global Security Market Volume Billion Forecast, by Deployment Type 2019 & 2032
- Table 51: Global Security Market Revenue Million Forecast, by Country 2019 & 2032
- Table 52: Global Security Market Volume Billion Forecast, by Country 2019 & 2032
- Table 53: Global Security Market Revenue Million Forecast, by Security Type 2019 & 2032
- Table 54: Global Security Market Volume Billion Forecast, by Security Type 2019 & 2032
- Table 55: Global Security Market Revenue Million Forecast, by End-user Vertical 2019 & 2032
- Table 56: Global Security Market Volume Billion Forecast, by End-user Vertical 2019 & 2032
- Table 57: Global Security Market Revenue Million Forecast, by Solution Type 2019 & 2032
- Table 58: Global Security Market Volume Billion Forecast, by Solution Type 2019 & 2032
- Table 59: Global Security Market Revenue Million Forecast, by Deployment Type 2019 & 2032
- Table 60: Global Security Market Volume Billion Forecast, by Deployment Type 2019 & 2032
- Table 61: Global Security Market Revenue Million Forecast, by Country 2019 & 2032
- Table 62: Global Security Market Volume Billion Forecast, by Country 2019 & 2032
- Table 63: Global Security Market Revenue Million Forecast, by Security Type 2019 & 2032
- Table 64: Global Security Market Volume Billion Forecast, by Security Type 2019 & 2032
- Table 65: Global Security Market Revenue Million Forecast, by End-user Vertical 2019 & 2032
- Table 66: Global Security Market Volume Billion Forecast, by End-user Vertical 2019 & 2032
- Table 67: Global Security Market Revenue Million Forecast, by Solution Type 2019 & 2032
- Table 68: Global Security Market Volume Billion Forecast, by Solution Type 2019 & 2032
- Table 69: Global Security Market Revenue Million Forecast, by Deployment Type 2019 & 2032
- Table 70: Global Security Market Volume Billion Forecast, by Deployment Type 2019 & 2032
- Table 71: Global Security Market Revenue Million Forecast, by Country 2019 & 2032
- Table 72: Global Security Market Volume Billion Forecast, by Country 2019 & 2032
Frequently Asked Questions
1. What is the projected Compound Annual Growth Rate (CAGR) of the Security Market?
The projected CAGR is approximately 10.20%.
2. Which companies are prominent players in the Security Market?
Key companies in the market include Verkada Inc, HID Global, AMAG Technology (Allied Universal), Bosch Sicherheitssysteme GmbH, Axis Communications AB, Honeywell International Inc, Johnson Controls, ADT Inc, Securitas Technology, Assa Abloy Group, Genetec Inc, Palo Alto Networks, Fortinet Inc, IBM Corporation, Cisco Systems Inc.
3. What are the main segments of the Security Market?
The market segments include Security Type, End-user Vertical, Solution Type, Deployment Type.
4. Can you provide details about the market size?
The market size is estimated to be USD 23.71 Million as of 2022.
5. What are some drivers contributing to market growth?
Increasing Cyber Threats; Growth in IoT Devices.
6. What are the notable trends driving market growth?
Commercial Sector Witnessing Demand.
7. Are there any restraints impacting market growth?
Increasing Cyber Threats; Growth in IoT Devices.
8. Can you provide examples of recent developments in the market?
August 2024: Alfred International, a subsidiary of GHT Door Hardware specializing in smart and connected locks, launched its patented Alfred ML2 Smart Mortise Lock with Z-Wave Long Range in the United States. The ML2, as per the company's claims, merges cutting-edge technology with a modern keypad and a unique design. This patented drive mechanism enables dealers to retrofit the ML2 into properties that previously used older mortise-style locks. Now available in the United States, the ML2 caters to property managers and homeowners who wish to upgrade to a smart mortise lock. This upgrade can be done without entirely replacing or re-keying the existing lock, thus sidestepping common installation challenges.
9. What pricing options are available for accessing the report?
Pricing options include single-user, multi-user, and enterprise licenses priced at USD 4750, USD 5250, and USD 8750 respectively.
10. Is the market size provided in terms of value or volume?
The market size is provided in terms of value, measured in Million and volume, measured in Billion.
11. Are there any specific market keywords associated with the report?
Yes, the market keyword associated with the report is "Security Market," which aids in identifying and referencing the specific market segment covered.
12. How do I determine which pricing option suits my needs best?
The pricing options vary based on user requirements and access needs. Individual users may opt for single-user licenses, while businesses requiring broader access may choose multi-user or enterprise licenses for cost-effective access to the report.
13. Are there any additional resources or data provided in the Security Market report?
While the report offers comprehensive insights, it's advisable to review the specific contents or supplementary materials provided to ascertain if additional resources or data are available.
14. How can I stay updated on further developments or reports in the Security Market?
To stay informed about further developments, trends, and reports in the Security Market, consider subscribing to industry newsletters, following relevant companies and organizations, or regularly checking reputable industry news sources and publications.
Methodology
Step 1 - Identification of Relevant Samples Size from Population Database


Step 2 - Approaches for Defining Global Market Size (Value, Volume* & Price*)

Note*: In applicable scenarios
Step 3 - Data Sources
Primary Research
- Web Analytics
- Survey Reports
- Research Institute
- Latest Research Reports
- Opinion Leaders
Secondary Research
- Annual Reports
- White Paper
- Latest Press Release
- Industry Association
- Paid Database
- Investor Presentations

Step 4 - Data Triangulation
Involves using different sources of information in order to increase the validity of a study
These sources are likely to be stakeholders in a program - participants, other researchers, program staff, other community members, and so on.
Then we put all data in single framework & apply various statistical tools to find out the dynamic on the market.
During the analysis stage, feedback from the stakeholder groups would be compared to determine areas of agreement as well as areas of divergence
