

Key Insights
The Secure Cloud Access Security Broker (SECaaS) market is experiencing robust growth, driven by the increasing adoption of cloud services and the rising need for enhanced security measures to protect sensitive data. The market's Compound Annual Growth Rate (CAGR) of 16.30% from 2019 to 2024 indicates a significant expansion, projected to continue through 2033. Key drivers include the proliferation of remote work environments, increasing cyber threats targeting cloud-based applications, and stringent regulatory compliance mandates demanding robust data protection. The market is segmented by solution type (Identity and Access Management, Secure Email Gateway, Secure Web Gateway, Vulnerability Management, Security Information and Event Management, Application Security Testing, and Other Solutions) and organization size (Small and Medium Enterprises and Large Enterprises). Large enterprises are currently the primary consumers due to their significant cloud infrastructure and sensitive data volumes. However, SMEs are expected to see rapid growth in adoption as cloud-based services become increasingly integral to their operations. Geographic expansion is also a significant factor, with North America currently holding a substantial market share, followed by Europe and Asia Pacific. However, rapid growth is anticipated in emerging markets in Asia-Pacific and South America as digital transformation initiatives accelerate. Competitive dynamics are intense, with established players like IBM, Cisco, and McAfee facing competition from agile startups specializing in niche solutions. Future market growth hinges on continuous innovation, particularly in areas such as artificial intelligence (AI)-driven threat detection, improved user experience, and integration with existing security infrastructures. The market will likely see consolidation through mergers and acquisitions as companies strive to expand their capabilities and market reach.
The SECaaS market’s evolution is characterized by a shift towards integrated security platforms, offering comprehensive protection across multiple cloud environments. This trend is fueled by the complexity of managing various security tools, leading to a demand for consolidated solutions. Furthermore, the growing importance of data privacy regulations, such as GDPR and CCPA, is further propelling the adoption of SECaaS solutions. However, challenges such as cost constraints for smaller organizations and the need for skilled professionals to manage these complex systems could hinder market expansion to some degree. Despite these challenges, the overall market outlook remains overwhelmingly positive, driven by the undeniable need for robust security in an increasingly cloud-centric world. The continued development of sophisticated threat actors will ensure a sustained demand for advanced SECaaS offerings.
SECaaS Industry Market Report: 2019-2033
This comprehensive report provides an in-depth analysis of the Security-as-a-Service (SECaaS) industry, projecting a market value of $XXX Million by 2033. The study covers the historical period (2019-2024), base year (2025), and forecast period (2025-2033), offering invaluable insights for stakeholders seeking to navigate this rapidly evolving landscape. Key players like IBM Corporation, Cisco Systems Inc, and Proofpoint Inc are analyzed, alongside emerging trends and significant market developments.
SECaaS Industry Market Composition & Trends
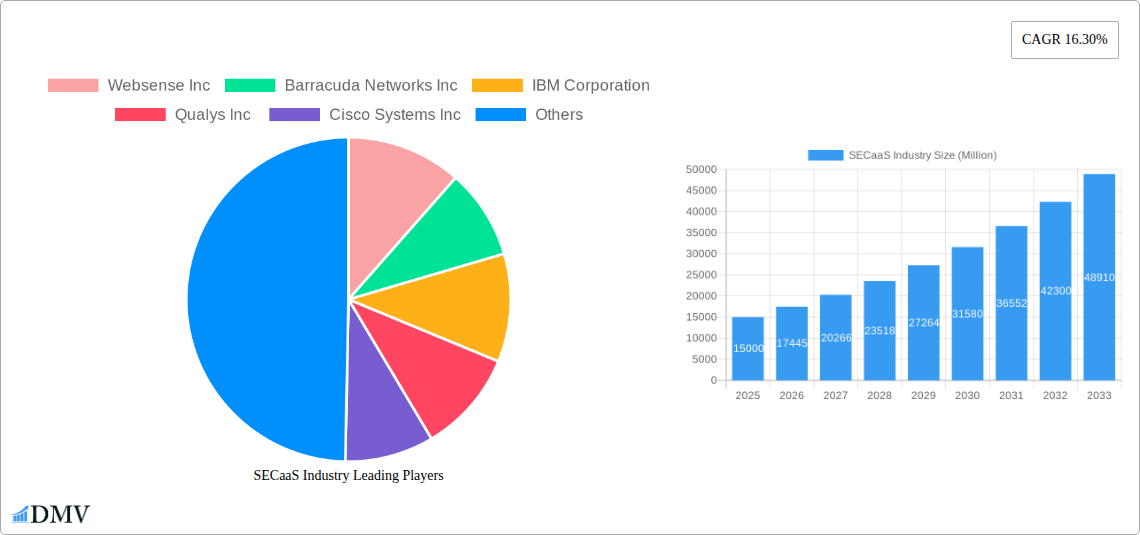
The SECaaS market is characterized by moderate concentration, with a few dominant players commanding significant market share. In 2025, the top 5 companies are estimated to hold approximately 60% of the market, with IBM Corporation leading at approximately 15% market share. Continuous innovation in areas like AI-driven threat detection and advanced endpoint protection fuels market growth. Stringent data privacy regulations (e.g., GDPR, CCPA) are shaping the industry landscape, driving demand for compliant SECaaS solutions. Substitute products, such as on-premise security systems, face increasing competition due to SECaaS's cost-effectiveness and scalability. The end-user profile is diverse, encompassing SMEs and large enterprises across various sectors. M&A activity remains robust, with deal values exceeding $XX Million in 2024, signaling consolidation and expansion within the sector.
- Market Share Distribution (2025, Estimated):
- Top 5 Companies: 60%
- IBM Corporation: 15%
- Cisco Systems Inc: 12%
- Proofpoint Inc: 10%
- Others: 23%
- M&A Deal Values (2024): >$XX Million
SECaaS Industry Industry Evolution
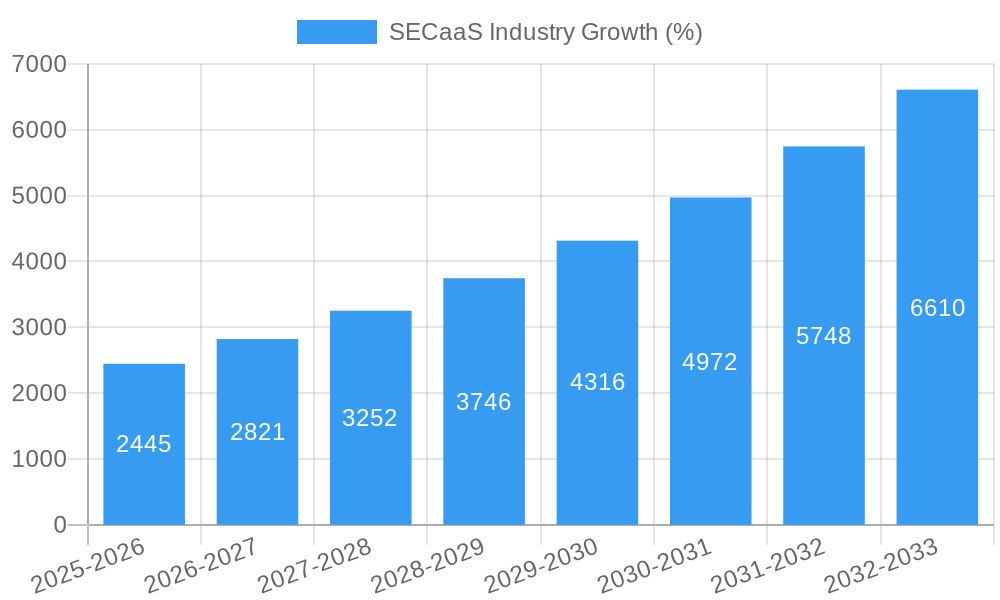
The SECaaS market has witnessed exponential growth over the past five years, driven by the increasing adoption of cloud computing, the rise of sophisticated cyber threats, and the growing need for robust security solutions. The Compound Annual Growth Rate (CAGR) from 2019 to 2024 is estimated at XX%, reaching a market value of $XXX Million in 2024. This growth trajectory is projected to continue, albeit at a slightly moderated pace, throughout the forecast period. Technological advancements, such as the integration of AI/ML, extended detection and response (XDR), and zero trust security architectures are reshaping the SECaaS landscape. Shifting consumer demands towards flexible, scalable, and cost-effective security solutions further propel the market’s expansion. Adoption rates among SMEs are particularly noteworthy, with an estimated XX% penetration rate in 2025, suggesting significant untapped potential.
Leading Regions, Countries, or Segments in SECaaS Industry
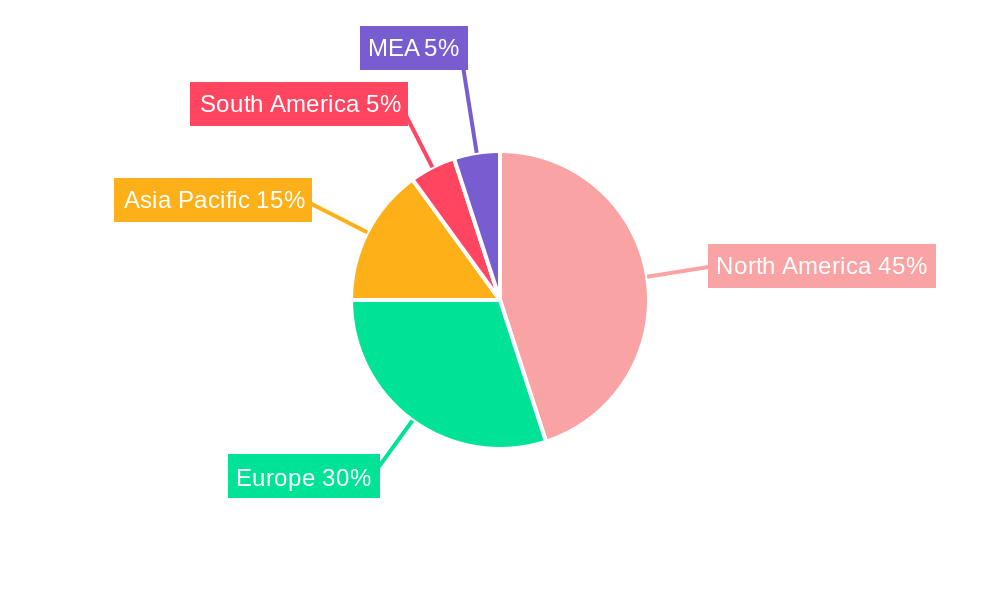
North America currently dominates the SECaaS market, driven by high technological adoption, robust IT infrastructure, and stringent regulatory frameworks. Within the solution segments, Secure Web Gateway and Identity and Access Management are leading, each accounting for over 20% of the market share in 2025. Large Enterprises account for a larger share of spending compared to SMEs, but SME growth is particularly promising due to affordability and ease of use.
Key Drivers:
- North America: High technological adoption, robust IT infrastructure, stringent data privacy regulations.
- Secure Web Gateway & Identity and Access Management: Growing threat landscape, rising concerns over data breaches, compliance mandates.
- Large Enterprises: Higher budgets, greater need for comprehensive security solutions.
- SMEs: Increasing awareness of cyber risks, adoption of cloud-based solutions.
SECaaS Industry Product Innovations
Recent innovations in SECaaS include advanced threat detection utilizing AI and machine learning, automated incident response systems, and integrated security platforms offering comprehensive protection across multiple vectors. These advancements enhance the speed and accuracy of threat identification and mitigation, leading to improved security posture and reduced response times. Unique selling propositions focus on simplified management, seamless integration with existing IT infrastructure, and cost optimization.
Propelling Factors for SECaaS Growth
The SECaaS market is propelled by several key factors: the increasing prevalence of cyber threats, the growing adoption of cloud computing, the rising demand for cost-effective and scalable security solutions, and the strengthening of data privacy regulations. These factors collectively drive organizations of all sizes to adopt SECaaS solutions. The shift toward remote work models further accelerates this trend, necessitating robust security solutions accessible from anywhere.
Obstacles in the SECaaS Industry Market
Challenges facing the SECaaS market include concerns around data security and privacy, the complexity of integrating SECaaS solutions with existing IT infrastructure, and potential vendor lock-in. Furthermore, supply chain disruptions can impact the availability of critical components, and intense competition can lead to price wars and margin pressures.
Future Opportunities in SECaaS Industry
Future opportunities lie in the expansion of SECaaS offerings into emerging markets, particularly in developing economies with rapidly growing digital infrastructure. The integration of innovative technologies, such as blockchain and quantum computing, promises further enhancements in security and performance. The growing demand for specialized SECaaS solutions tailored to specific industry verticals also presents a significant growth opportunity.
Major Players in the SECaaS Industry Ecosystem
- Websense Inc
- Barracuda Networks Inc
- IBM Corporation
- Qualys Inc
- Cisco Systems Inc
- Proofpoint Inc
- Trend Micro Incorporated
- McAfee (Intel)
- ZSCaler Inc
- Symantec Corporation
- Sophos PLC
- Dell Technologies
Key Developments in SECaaS Industry
- June 2022: Allot Ltd. partners with Proximus to launch cybersecurity services for mobile customers in Luxembourg, expanding SECaaS reach in the telecommunications sector.
- February 2022: Nokia introduces new SaaS services focusing on analytics and security, further emphasizing the shift towards cloud-based security solutions and bolstering the SECaaS market.
Strategic SECaaS Industry Market Forecast
The SECaaS market is poised for sustained growth over the next decade, driven by increasing cybersecurity threats, the widespread adoption of cloud technologies, and the evolving regulatory landscape. The focus on innovative solutions, such as AI-powered threat detection and zero-trust architectures, will further fuel market expansion. The market's significant growth potential offers substantial opportunities for both established players and emerging entrants.
SECaaS Industry Segmentation
-
1. Solution
- 1.1. Identity and Access Management
- 1.2. Secure Email Gateway
- 1.3. Secure Web Gateway
- 1.4. Vulnerability Management
- 1.5. Security Information and Event Management
- 1.6. Application Security Testing
- 1.7. Other Solutions
-
2. Organization Size
- 2.1. Small and Medium Enterprises
- 2.2. Large Enterprises
SECaaS Industry Segmentation By Geography
-
1. North America
- 1.1. United States
- 1.2. Canada
-
2. Europe
- 2.1. United Kingdom
- 2.2. Germany
- 2.3. France
- 2.4. Rest of Europe
-
3. Asia Pacific
- 3.1. China
- 3.2. India
- 3.3. Japan
- 3.4. Australia
- 3.5. Rest of Asia Pacific
- 4. Latin America
- 5. Middle East
SECaaS Industry REPORT HIGHLIGHTS
| Aspects | Details |
|---|---|
| Study Period | 2019-2033 |
| Base Year | 2024 |
| Estimated Year | 2025 |
| Forecast Period | 2025-2033 |
| Historical Period | 2019-2024 |
| Growth Rate | CAGR of 16.30% from 2019-2033 |
| Segmentation |
|
Table of Contents
- 1. Introduction
- 1.1. Research Scope
- 1.2. Market Segmentation
- 1.3. Research Methodology
- 1.4. Definitions and Assumptions
- 2. Executive Summary
- 2.1. Introduction
- 3. Market Dynamics
- 3.1. Introduction
- 3.2. Market Drivers
- 3.2.1. Increasing Need for Advanced Cloud Security Solutions; Increasing Trend of BYOD in Enterprises
- 3.3. Market Restrains
- 3.3.1. Vulnerability of Cloud-Based Applications to Cyber Crimes
- 3.4. Market Trends
- 3.4.1. Secure Email Gateway is Expected to Hold a Significant Share
- 4. Market Factor Analysis
- 4.1. Porters Five Forces
- 4.2. Supply/Value Chain
- 4.3. PESTEL analysis
- 4.4. Market Entropy
- 4.5. Patent/Trademark Analysis
- 5. Global SECaaS Industry Analysis, Insights and Forecast, 2019-2031
- 5.1. Market Analysis, Insights and Forecast - by Solution
- 5.1.1. Identity and Access Management
- 5.1.2. Secure Email Gateway
- 5.1.3. Secure Web Gateway
- 5.1.4. Vulnerability Management
- 5.1.5. Security Information and Event Management
- 5.1.6. Application Security Testing
- 5.1.7. Other Solutions
- 5.2. Market Analysis, Insights and Forecast - by Organization Size
- 5.2.1. Small and Medium Enterprises
- 5.2.2. Large Enterprises
- 5.3. Market Analysis, Insights and Forecast - by Region
- 5.3.1. North America
- 5.3.2. Europe
- 5.3.3. Asia Pacific
- 5.3.4. Latin America
- 5.3.5. Middle East
- 5.1. Market Analysis, Insights and Forecast - by Solution
- 6. North America SECaaS Industry Analysis, Insights and Forecast, 2019-2031
- 6.1. Market Analysis, Insights and Forecast - by Solution
- 6.1.1. Identity and Access Management
- 6.1.2. Secure Email Gateway
- 6.1.3. Secure Web Gateway
- 6.1.4. Vulnerability Management
- 6.1.5. Security Information and Event Management
- 6.1.6. Application Security Testing
- 6.1.7. Other Solutions
- 6.2. Market Analysis, Insights and Forecast - by Organization Size
- 6.2.1. Small and Medium Enterprises
- 6.2.2. Large Enterprises
- 6.1. Market Analysis, Insights and Forecast - by Solution
- 7. Europe SECaaS Industry Analysis, Insights and Forecast, 2019-2031
- 7.1. Market Analysis, Insights and Forecast - by Solution
- 7.1.1. Identity and Access Management
- 7.1.2. Secure Email Gateway
- 7.1.3. Secure Web Gateway
- 7.1.4. Vulnerability Management
- 7.1.5. Security Information and Event Management
- 7.1.6. Application Security Testing
- 7.1.7. Other Solutions
- 7.2. Market Analysis, Insights and Forecast - by Organization Size
- 7.2.1. Small and Medium Enterprises
- 7.2.2. Large Enterprises
- 7.1. Market Analysis, Insights and Forecast - by Solution
- 8. Asia Pacific SECaaS Industry Analysis, Insights and Forecast, 2019-2031
- 8.1. Market Analysis, Insights and Forecast - by Solution
- 8.1.1. Identity and Access Management
- 8.1.2. Secure Email Gateway
- 8.1.3. Secure Web Gateway
- 8.1.4. Vulnerability Management
- 8.1.5. Security Information and Event Management
- 8.1.6. Application Security Testing
- 8.1.7. Other Solutions
- 8.2. Market Analysis, Insights and Forecast - by Organization Size
- 8.2.1. Small and Medium Enterprises
- 8.2.2. Large Enterprises
- 8.1. Market Analysis, Insights and Forecast - by Solution
- 9. Latin America SECaaS Industry Analysis, Insights and Forecast, 2019-2031
- 9.1. Market Analysis, Insights and Forecast - by Solution
- 9.1.1. Identity and Access Management
- 9.1.2. Secure Email Gateway
- 9.1.3. Secure Web Gateway
- 9.1.4. Vulnerability Management
- 9.1.5. Security Information and Event Management
- 9.1.6. Application Security Testing
- 9.1.7. Other Solutions
- 9.2. Market Analysis, Insights and Forecast - by Organization Size
- 9.2.1. Small and Medium Enterprises
- 9.2.2. Large Enterprises
- 9.1. Market Analysis, Insights and Forecast - by Solution
- 10. Middle East SECaaS Industry Analysis, Insights and Forecast, 2019-2031
- 10.1. Market Analysis, Insights and Forecast - by Solution
- 10.1.1. Identity and Access Management
- 10.1.2. Secure Email Gateway
- 10.1.3. Secure Web Gateway
- 10.1.4. Vulnerability Management
- 10.1.5. Security Information and Event Management
- 10.1.6. Application Security Testing
- 10.1.7. Other Solutions
- 10.2. Market Analysis, Insights and Forecast - by Organization Size
- 10.2.1. Small and Medium Enterprises
- 10.2.2. Large Enterprises
- 10.1. Market Analysis, Insights and Forecast - by Solution
- 11. North America SECaaS Industry Analysis, Insights and Forecast, 2019-2031
- 11.1. Market Analysis, Insights and Forecast - By Country/Sub-region
- 11.1.1 United States
- 11.1.2 Canada
- 11.1.3 Mexico
- 12. Europe SECaaS Industry Analysis, Insights and Forecast, 2019-2031
- 12.1. Market Analysis, Insights and Forecast - By Country/Sub-region
- 12.1.1 Germany
- 12.1.2 United Kingdom
- 12.1.3 France
- 12.1.4 Spain
- 12.1.5 Italy
- 12.1.6 Spain
- 12.1.7 Belgium
- 12.1.8 Netherland
- 12.1.9 Nordics
- 12.1.10 Rest of Europe
- 13. Asia Pacific SECaaS Industry Analysis, Insights and Forecast, 2019-2031
- 13.1. Market Analysis, Insights and Forecast - By Country/Sub-region
- 13.1.1 China
- 13.1.2 Japan
- 13.1.3 India
- 13.1.4 South Korea
- 13.1.5 Southeast Asia
- 13.1.6 Australia
- 13.1.7 Indonesia
- 13.1.8 Phillipes
- 13.1.9 Singapore
- 13.1.10 Thailandc
- 13.1.11 Rest of Asia Pacific
- 14. South America SECaaS Industry Analysis, Insights and Forecast, 2019-2031
- 14.1. Market Analysis, Insights and Forecast - By Country/Sub-region
- 14.1.1 Brazil
- 14.1.2 Argentina
- 14.1.3 Peru
- 14.1.4 Chile
- 14.1.5 Colombia
- 14.1.6 Ecuador
- 14.1.7 Venezuela
- 14.1.8 Rest of South America
- 15. North America SECaaS Industry Analysis, Insights and Forecast, 2019-2031
- 15.1. Market Analysis, Insights and Forecast - By Country/Sub-region
- 15.1.1 United States
- 15.1.2 Canada
- 15.1.3 Mexico
- 16. MEA SECaaS Industry Analysis, Insights and Forecast, 2019-2031
- 16.1. Market Analysis, Insights and Forecast - By Country/Sub-region
- 16.1.1 United Arab Emirates
- 16.1.2 Saudi Arabia
- 16.1.3 South Africa
- 16.1.4 Rest of Middle East and Africa
- 17. Competitive Analysis
- 17.1. Global Market Share Analysis 2024
- 17.2. Company Profiles
- 17.2.1 Websense Inc
- 17.2.1.1. Overview
- 17.2.1.2. Products
- 17.2.1.3. SWOT Analysis
- 17.2.1.4. Recent Developments
- 17.2.1.5. Financials (Based on Availability)
- 17.2.2 Barracuda Networks Inc
- 17.2.2.1. Overview
- 17.2.2.2. Products
- 17.2.2.3. SWOT Analysis
- 17.2.2.4. Recent Developments
- 17.2.2.5. Financials (Based on Availability)
- 17.2.3 IBM Corporation
- 17.2.3.1. Overview
- 17.2.3.2. Products
- 17.2.3.3. SWOT Analysis
- 17.2.3.4. Recent Developments
- 17.2.3.5. Financials (Based on Availability)
- 17.2.4 Qualys Inc
- 17.2.4.1. Overview
- 17.2.4.2. Products
- 17.2.4.3. SWOT Analysis
- 17.2.4.4. Recent Developments
- 17.2.4.5. Financials (Based on Availability)
- 17.2.5 Cisco Systems Inc
- 17.2.5.1. Overview
- 17.2.5.2. Products
- 17.2.5.3. SWOT Analysis
- 17.2.5.4. Recent Developments
- 17.2.5.5. Financials (Based on Availability)
- 17.2.6 Proofpoint Inc
- 17.2.6.1. Overview
- 17.2.6.2. Products
- 17.2.6.3. SWOT Analysis
- 17.2.6.4. Recent Developments
- 17.2.6.5. Financials (Based on Availability)
- 17.2.7 Trend Micro Incorporated
- 17.2.7.1. Overview
- 17.2.7.2. Products
- 17.2.7.3. SWOT Analysis
- 17.2.7.4. Recent Developments
- 17.2.7.5. Financials (Based on Availability)
- 17.2.8 McAfee (Intel)
- 17.2.8.1. Overview
- 17.2.8.2. Products
- 17.2.8.3. SWOT Analysis
- 17.2.8.4. Recent Developments
- 17.2.8.5. Financials (Based on Availability)
- 17.2.9 ZSCaler Inc
- 17.2.9.1. Overview
- 17.2.9.2. Products
- 17.2.9.3. SWOT Analysis
- 17.2.9.4. Recent Developments
- 17.2.9.5. Financials (Based on Availability)
- 17.2.10 Symantec Corporation
- 17.2.10.1. Overview
- 17.2.10.2. Products
- 17.2.10.3. SWOT Analysis
- 17.2.10.4. Recent Developments
- 17.2.10.5. Financials (Based on Availability)
- 17.2.11 Sophos PLC
- 17.2.11.1. Overview
- 17.2.11.2. Products
- 17.2.11.3. SWOT Analysis
- 17.2.11.4. Recent Developments
- 17.2.11.5. Financials (Based on Availability)
- 17.2.12 Dell Technologies
- 17.2.12.1. Overview
- 17.2.12.2. Products
- 17.2.12.3. SWOT Analysis
- 17.2.12.4. Recent Developments
- 17.2.12.5. Financials (Based on Availability)
- 17.2.1 Websense Inc
List of Figures
- Figure 1: Global SECaaS Industry Revenue Breakdown (Million, %) by Region 2024 & 2032
- Figure 2: North America SECaaS Industry Revenue (Million), by Country 2024 & 2032
- Figure 3: North America SECaaS Industry Revenue Share (%), by Country 2024 & 2032
- Figure 4: Europe SECaaS Industry Revenue (Million), by Country 2024 & 2032
- Figure 5: Europe SECaaS Industry Revenue Share (%), by Country 2024 & 2032
- Figure 6: Asia Pacific SECaaS Industry Revenue (Million), by Country 2024 & 2032
- Figure 7: Asia Pacific SECaaS Industry Revenue Share (%), by Country 2024 & 2032
- Figure 8: South America SECaaS Industry Revenue (Million), by Country 2024 & 2032
- Figure 9: South America SECaaS Industry Revenue Share (%), by Country 2024 & 2032
- Figure 10: North America SECaaS Industry Revenue (Million), by Country 2024 & 2032
- Figure 11: North America SECaaS Industry Revenue Share (%), by Country 2024 & 2032
- Figure 12: MEA SECaaS Industry Revenue (Million), by Country 2024 & 2032
- Figure 13: MEA SECaaS Industry Revenue Share (%), by Country 2024 & 2032
- Figure 14: North America SECaaS Industry Revenue (Million), by Solution 2024 & 2032
- Figure 15: North America SECaaS Industry Revenue Share (%), by Solution 2024 & 2032
- Figure 16: North America SECaaS Industry Revenue (Million), by Organization Size 2024 & 2032
- Figure 17: North America SECaaS Industry Revenue Share (%), by Organization Size 2024 & 2032
- Figure 18: North America SECaaS Industry Revenue (Million), by Country 2024 & 2032
- Figure 19: North America SECaaS Industry Revenue Share (%), by Country 2024 & 2032
- Figure 20: Europe SECaaS Industry Revenue (Million), by Solution 2024 & 2032
- Figure 21: Europe SECaaS Industry Revenue Share (%), by Solution 2024 & 2032
- Figure 22: Europe SECaaS Industry Revenue (Million), by Organization Size 2024 & 2032
- Figure 23: Europe SECaaS Industry Revenue Share (%), by Organization Size 2024 & 2032
- Figure 24: Europe SECaaS Industry Revenue (Million), by Country 2024 & 2032
- Figure 25: Europe SECaaS Industry Revenue Share (%), by Country 2024 & 2032
- Figure 26: Asia Pacific SECaaS Industry Revenue (Million), by Solution 2024 & 2032
- Figure 27: Asia Pacific SECaaS Industry Revenue Share (%), by Solution 2024 & 2032
- Figure 28: Asia Pacific SECaaS Industry Revenue (Million), by Organization Size 2024 & 2032
- Figure 29: Asia Pacific SECaaS Industry Revenue Share (%), by Organization Size 2024 & 2032
- Figure 30: Asia Pacific SECaaS Industry Revenue (Million), by Country 2024 & 2032
- Figure 31: Asia Pacific SECaaS Industry Revenue Share (%), by Country 2024 & 2032
- Figure 32: Latin America SECaaS Industry Revenue (Million), by Solution 2024 & 2032
- Figure 33: Latin America SECaaS Industry Revenue Share (%), by Solution 2024 & 2032
- Figure 34: Latin America SECaaS Industry Revenue (Million), by Organization Size 2024 & 2032
- Figure 35: Latin America SECaaS Industry Revenue Share (%), by Organization Size 2024 & 2032
- Figure 36: Latin America SECaaS Industry Revenue (Million), by Country 2024 & 2032
- Figure 37: Latin America SECaaS Industry Revenue Share (%), by Country 2024 & 2032
- Figure 38: Middle East SECaaS Industry Revenue (Million), by Solution 2024 & 2032
- Figure 39: Middle East SECaaS Industry Revenue Share (%), by Solution 2024 & 2032
- Figure 40: Middle East SECaaS Industry Revenue (Million), by Organization Size 2024 & 2032
- Figure 41: Middle East SECaaS Industry Revenue Share (%), by Organization Size 2024 & 2032
- Figure 42: Middle East SECaaS Industry Revenue (Million), by Country 2024 & 2032
- Figure 43: Middle East SECaaS Industry Revenue Share (%), by Country 2024 & 2032
List of Tables
- Table 1: Global SECaaS Industry Revenue Million Forecast, by Region 2019 & 2032
- Table 2: Global SECaaS Industry Revenue Million Forecast, by Solution 2019 & 2032
- Table 3: Global SECaaS Industry Revenue Million Forecast, by Organization Size 2019 & 2032
- Table 4: Global SECaaS Industry Revenue Million Forecast, by Region 2019 & 2032
- Table 5: Global SECaaS Industry Revenue Million Forecast, by Country 2019 & 2032
- Table 6: United States SECaaS Industry Revenue (Million) Forecast, by Application 2019 & 2032
- Table 7: Canada SECaaS Industry Revenue (Million) Forecast, by Application 2019 & 2032
- Table 8: Mexico SECaaS Industry Revenue (Million) Forecast, by Application 2019 & 2032
- Table 9: Global SECaaS Industry Revenue Million Forecast, by Country 2019 & 2032
- Table 10: Germany SECaaS Industry Revenue (Million) Forecast, by Application 2019 & 2032
- Table 11: United Kingdom SECaaS Industry Revenue (Million) Forecast, by Application 2019 & 2032
- Table 12: France SECaaS Industry Revenue (Million) Forecast, by Application 2019 & 2032
- Table 13: Spain SECaaS Industry Revenue (Million) Forecast, by Application 2019 & 2032
- Table 14: Italy SECaaS Industry Revenue (Million) Forecast, by Application 2019 & 2032
- Table 15: Spain SECaaS Industry Revenue (Million) Forecast, by Application 2019 & 2032
- Table 16: Belgium SECaaS Industry Revenue (Million) Forecast, by Application 2019 & 2032
- Table 17: Netherland SECaaS Industry Revenue (Million) Forecast, by Application 2019 & 2032
- Table 18: Nordics SECaaS Industry Revenue (Million) Forecast, by Application 2019 & 2032
- Table 19: Rest of Europe SECaaS Industry Revenue (Million) Forecast, by Application 2019 & 2032
- Table 20: Global SECaaS Industry Revenue Million Forecast, by Country 2019 & 2032
- Table 21: China SECaaS Industry Revenue (Million) Forecast, by Application 2019 & 2032
- Table 22: Japan SECaaS Industry Revenue (Million) Forecast, by Application 2019 & 2032
- Table 23: India SECaaS Industry Revenue (Million) Forecast, by Application 2019 & 2032
- Table 24: South Korea SECaaS Industry Revenue (Million) Forecast, by Application 2019 & 2032
- Table 25: Southeast Asia SECaaS Industry Revenue (Million) Forecast, by Application 2019 & 2032
- Table 26: Australia SECaaS Industry Revenue (Million) Forecast, by Application 2019 & 2032
- Table 27: Indonesia SECaaS Industry Revenue (Million) Forecast, by Application 2019 & 2032
- Table 28: Phillipes SECaaS Industry Revenue (Million) Forecast, by Application 2019 & 2032
- Table 29: Singapore SECaaS Industry Revenue (Million) Forecast, by Application 2019 & 2032
- Table 30: Thailandc SECaaS Industry Revenue (Million) Forecast, by Application 2019 & 2032
- Table 31: Rest of Asia Pacific SECaaS Industry Revenue (Million) Forecast, by Application 2019 & 2032
- Table 32: Global SECaaS Industry Revenue Million Forecast, by Country 2019 & 2032
- Table 33: Brazil SECaaS Industry Revenue (Million) Forecast, by Application 2019 & 2032
- Table 34: Argentina SECaaS Industry Revenue (Million) Forecast, by Application 2019 & 2032
- Table 35: Peru SECaaS Industry Revenue (Million) Forecast, by Application 2019 & 2032
- Table 36: Chile SECaaS Industry Revenue (Million) Forecast, by Application 2019 & 2032
- Table 37: Colombia SECaaS Industry Revenue (Million) Forecast, by Application 2019 & 2032
- Table 38: Ecuador SECaaS Industry Revenue (Million) Forecast, by Application 2019 & 2032
- Table 39: Venezuela SECaaS Industry Revenue (Million) Forecast, by Application 2019 & 2032
- Table 40: Rest of South America SECaaS Industry Revenue (Million) Forecast, by Application 2019 & 2032
- Table 41: Global SECaaS Industry Revenue Million Forecast, by Country 2019 & 2032
- Table 42: United States SECaaS Industry Revenue (Million) Forecast, by Application 2019 & 2032
- Table 43: Canada SECaaS Industry Revenue (Million) Forecast, by Application 2019 & 2032
- Table 44: Mexico SECaaS Industry Revenue (Million) Forecast, by Application 2019 & 2032
- Table 45: Global SECaaS Industry Revenue Million Forecast, by Country 2019 & 2032
- Table 46: United Arab Emirates SECaaS Industry Revenue (Million) Forecast, by Application 2019 & 2032
- Table 47: Saudi Arabia SECaaS Industry Revenue (Million) Forecast, by Application 2019 & 2032
- Table 48: South Africa SECaaS Industry Revenue (Million) Forecast, by Application 2019 & 2032
- Table 49: Rest of Middle East and Africa SECaaS Industry Revenue (Million) Forecast, by Application 2019 & 2032
- Table 50: Global SECaaS Industry Revenue Million Forecast, by Solution 2019 & 2032
- Table 51: Global SECaaS Industry Revenue Million Forecast, by Organization Size 2019 & 2032
- Table 52: Global SECaaS Industry Revenue Million Forecast, by Country 2019 & 2032
- Table 53: United States SECaaS Industry Revenue (Million) Forecast, by Application 2019 & 2032
- Table 54: Canada SECaaS Industry Revenue (Million) Forecast, by Application 2019 & 2032
- Table 55: Global SECaaS Industry Revenue Million Forecast, by Solution 2019 & 2032
- Table 56: Global SECaaS Industry Revenue Million Forecast, by Organization Size 2019 & 2032
- Table 57: Global SECaaS Industry Revenue Million Forecast, by Country 2019 & 2032
- Table 58: United Kingdom SECaaS Industry Revenue (Million) Forecast, by Application 2019 & 2032
- Table 59: Germany SECaaS Industry Revenue (Million) Forecast, by Application 2019 & 2032
- Table 60: France SECaaS Industry Revenue (Million) Forecast, by Application 2019 & 2032
- Table 61: Rest of Europe SECaaS Industry Revenue (Million) Forecast, by Application 2019 & 2032
- Table 62: Global SECaaS Industry Revenue Million Forecast, by Solution 2019 & 2032
- Table 63: Global SECaaS Industry Revenue Million Forecast, by Organization Size 2019 & 2032
- Table 64: Global SECaaS Industry Revenue Million Forecast, by Country 2019 & 2032
- Table 65: China SECaaS Industry Revenue (Million) Forecast, by Application 2019 & 2032
- Table 66: India SECaaS Industry Revenue (Million) Forecast, by Application 2019 & 2032
- Table 67: Japan SECaaS Industry Revenue (Million) Forecast, by Application 2019 & 2032
- Table 68: Australia SECaaS Industry Revenue (Million) Forecast, by Application 2019 & 2032
- Table 69: Rest of Asia Pacific SECaaS Industry Revenue (Million) Forecast, by Application 2019 & 2032
- Table 70: Global SECaaS Industry Revenue Million Forecast, by Solution 2019 & 2032
- Table 71: Global SECaaS Industry Revenue Million Forecast, by Organization Size 2019 & 2032
- Table 72: Global SECaaS Industry Revenue Million Forecast, by Country 2019 & 2032
- Table 73: Global SECaaS Industry Revenue Million Forecast, by Solution 2019 & 2032
- Table 74: Global SECaaS Industry Revenue Million Forecast, by Organization Size 2019 & 2032
- Table 75: Global SECaaS Industry Revenue Million Forecast, by Country 2019 & 2032
Frequently Asked Questions
1. What is the projected Compound Annual Growth Rate (CAGR) of the SECaaS Industry?
The projected CAGR is approximately 16.30%.
2. Which companies are prominent players in the SECaaS Industry?
Key companies in the market include Websense Inc, Barracuda Networks Inc, IBM Corporation, Qualys Inc , Cisco Systems Inc, Proofpoint Inc, Trend Micro Incorporated, McAfee (Intel), ZSCaler Inc, Symantec Corporation, Sophos PLC, Dell Technologies.
3. What are the main segments of the SECaaS Industry?
The market segments include Solution, Organization Size.
4. Can you provide details about the market size?
The market size is estimated to be USD XX Million as of 2022.
5. What are some drivers contributing to market growth?
Increasing Need for Advanced Cloud Security Solutions; Increasing Trend of BYOD in Enterprises.
6. What are the notable trends driving market growth?
Secure Email Gateway is Expected to Hold a Significant Share.
7. Are there any restraints impacting market growth?
Vulnerability of Cloud-Based Applications to Cyber Crimes.
8. Can you provide examples of recent developments in the market?
June 2022: Allot Ltd., a provider of innovative network intelligence and security-as-a-service (SECaaS) solutions for communication service providers (CSPs) and enterprises, declared that communications service provider Proximus, under its Tango brand name, introduced cybersecurity services for its mobile residential customers in Luxembourg based on Allot NetworkSecure.
9. What pricing options are available for accessing the report?
Pricing options include single-user, multi-user, and enterprise licenses priced at USD 4750, USD 5250, and USD 8750 respectively.
10. Is the market size provided in terms of value or volume?
The market size is provided in terms of value, measured in Million.
11. Are there any specific market keywords associated with the report?
Yes, the market keyword associated with the report is "SECaaS Industry," which aids in identifying and referencing the specific market segment covered.
12. How do I determine which pricing option suits my needs best?
The pricing options vary based on user requirements and access needs. Individual users may opt for single-user licenses, while businesses requiring broader access may choose multi-user or enterprise licenses for cost-effective access to the report.
13. Are there any additional resources or data provided in the SECaaS Industry report?
While the report offers comprehensive insights, it's advisable to review the specific contents or supplementary materials provided to ascertain if additional resources or data are available.
14. How can I stay updated on further developments or reports in the SECaaS Industry?
To stay informed about further developments, trends, and reports in the SECaaS Industry, consider subscribing to industry newsletters, following relevant companies and organizations, or regularly checking reputable industry news sources and publications.
Methodology
Step 1 - Identification of Relevant Samples Size from Population Database


Step 2 - Approaches for Defining Global Market Size (Value, Volume* & Price*)

Note*: In applicable scenarios
Step 3 - Data Sources
Primary Research
- Web Analytics
- Survey Reports
- Research Institute
- Latest Research Reports
- Opinion Leaders
Secondary Research
- Annual Reports
- White Paper
- Latest Press Release
- Industry Association
- Paid Database
- Investor Presentations

Step 4 - Data Triangulation
Involves using different sources of information in order to increase the validity of a study
These sources are likely to be stakeholders in a program - participants, other researchers, program staff, other community members, and so on.
Then we put all data in single framework & apply various statistical tools to find out the dynamic on the market.
During the analysis stage, feedback from the stakeholder groups would be compared to determine areas of agreement as well as areas of divergence
