

Key Insights
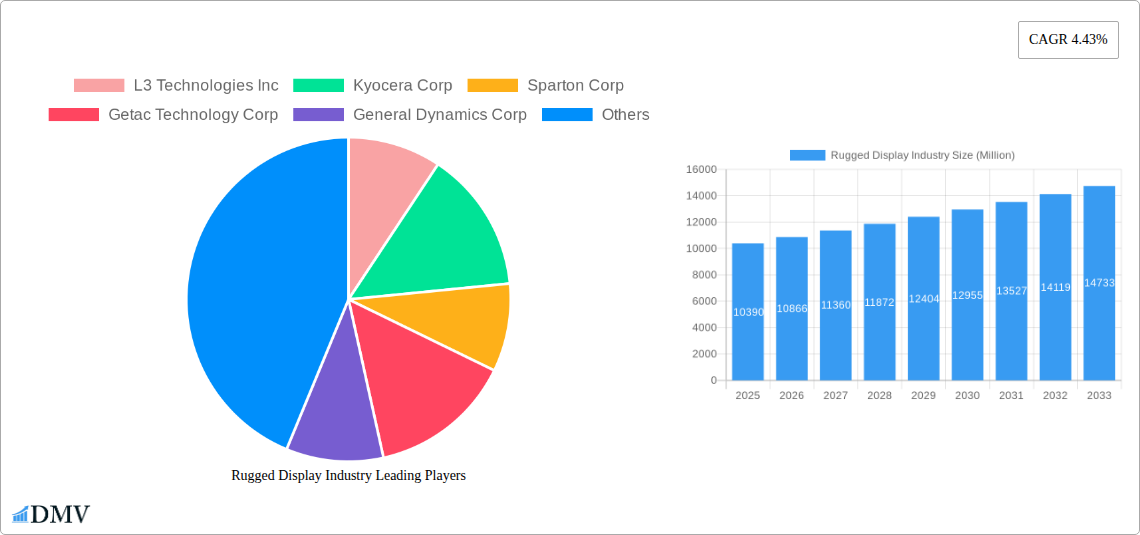
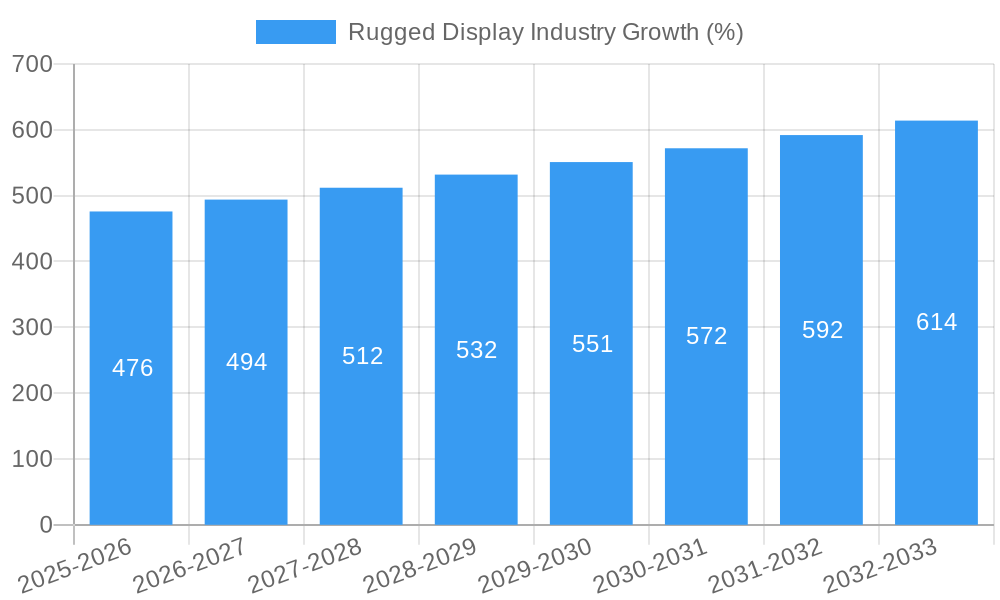
The rugged display market, valued at $10.39 billion in 2025, is projected to experience robust growth, driven by increasing demand across diverse sectors. A compound annual growth rate (CAGR) of 4.43% from 2025 to 2033 signifies a significant expansion, fueled primarily by the burgeoning need for durable and reliable displays in challenging environments. Key growth drivers include the expanding oil and gas exploration and production activities, the rising adoption of ruggedized devices in defense and aerospace applications (particularly for avionics and vehicle-mounted systems), and the growing demand for robust computing solutions within the industrial and automotive sectors. The increasing prevalence of outdoor work, coupled with a greater emphasis on data security and device longevity in these sectors, fuels the demand for fully rugged and ultra-rugged displays capable of withstanding extreme conditions. Further market segmentation by product type (smartphones, tablets, laptops, and specialized displays) and operating system (Android, Windows, and others) highlights the diverse applications and technological advancements within the market.
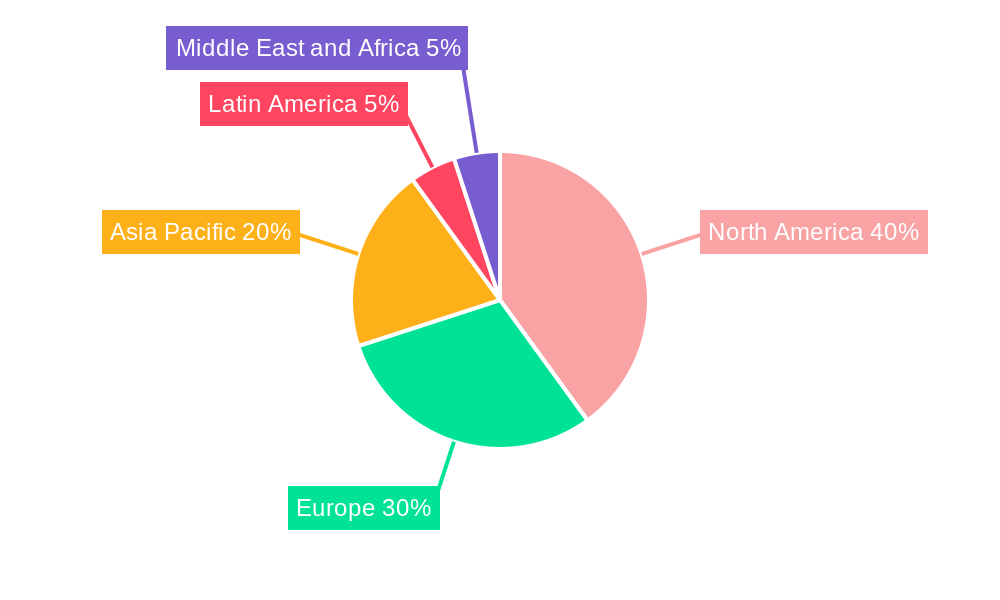
This growth trajectory is further strengthened by emerging trends, including the integration of advanced display technologies (such as higher resolutions and improved brightness) and the increasing demand for ruggedized displays with enhanced connectivity features. However, the market faces some constraints, including the high cost of manufacturing ruggedized devices and the potential for supply chain disruptions. Despite these challenges, the robust growth projections suggest a significant market opportunity for manufacturers specializing in rugged display technologies. The competitive landscape, featuring established players like L3 Technologies, Kyocera, and Getac, alongside emerging innovators, indicates a dynamic market ripe for both consolidation and innovation. Geographic distribution is likely skewed towards developed economies like North America and Europe, given their higher technological adoption rates and strong presence in key end-user sectors, but the Asia-Pacific region is expected to show robust growth.
Rugged Display Industry: A Comprehensive Market Report (2019-2033)
This insightful report provides a detailed analysis of the global rugged display market, offering a comprehensive overview of its current state, future trajectory, and key players. The study period spans from 2019 to 2033, with 2025 serving as the base and estimated year. The forecast period covers 2025-2033, and the historical period encompasses 2019-2024. This report is crucial for stakeholders seeking to understand market dynamics, identify growth opportunities, and make informed strategic decisions within this rapidly evolving sector. The global market size in 2025 is estimated at $XX Billion, projected to reach $XX Billion by 2033, demonstrating significant growth potential.
Rugged Display Industry Market Composition & Trends
This section evaluates the competitive landscape, innovation drivers, regulatory environment, and market dynamics within the rugged display industry. The market is characterized by a moderate level of concentration, with key players such as L3 Technologies Inc, Kyocera Corp, and Getac Technology Corp holding significant market share. However, emerging companies and technological advancements are continuously reshaping the competitive landscape.
- Market Share Distribution (2025): L3 Technologies Inc (XX%), Kyocera Corp (XX%), Getac Technology Corp (XX%), Others (XX%). These figures represent estimated market shares.
- Innovation Catalysts: Miniaturization, increased processing power, improved power efficiency, and enhanced durability are key drivers of innovation.
- Regulatory Landscape: Regulations concerning data security and environmental compliance influence product development and market access.
- Substitute Products: Traditional displays face increasing competition from ruggedized alternatives due to their enhanced performance and reliability in demanding environments.
- End-User Profiles: The industry caters to diverse end-users, including government and defense, industrial, automotive, healthcare, and oil and gas sectors. Each segment presents unique demands and opportunities.
- M&A Activities: The past five years have witnessed several significant mergers and acquisitions, with a total estimated value exceeding $XX Billion. These activities have reshaped market dynamics and enhanced competitive intensity. Examples include [mention specific examples if available, otherwise replace with 'Strategic acquisitions focused on expanding product portfolios and market reach.']
Rugged Display Industry Evolution
The rugged display market has experienced substantial growth throughout the historical period (2019-2024), driven by increasing demand from diverse sectors. Technological advancements, such as the integration of advanced materials and improved display technologies, have significantly enhanced product capabilities, leading to wider adoption across various applications. Consumer demand for enhanced durability, reliability, and performance in harsh environments has further fueled market growth. The market's Compound Annual Growth Rate (CAGR) from 2019 to 2024 is estimated at XX%, with expectations of a XX% CAGR from 2025 to 2033. This growth is projected to continue, driven by factors such as increasing investments in infrastructure, particularly in the defense and industrial sectors, and continuous innovation in display technologies. The shift towards advanced operating systems like Android and Windows within rugged devices has also contributed to market expansion. Furthermore, the growing preference for mobile computing and the increasing adoption of ruggedized devices in emerging markets are expected to stimulate future growth.
Leading Regions, Countries, or Segments in Rugged Display Industry
North America currently dominates the rugged display market, driven by high defense spending and a robust industrial sector. However, the Asia-Pacific region is expected to experience significant growth in the coming years due to rising industrialization and infrastructure development.
- Key Drivers for North America: High defense spending, robust industrial sector, established technology ecosystem.
- Key Drivers for Asia-Pacific: Rising industrialization, infrastructure development, increasing adoption in emerging markets.
- Dominant End-User Segments: Government and Defense, Industrial, and Automotive and Transportation sectors represent the largest market segments, driven by the need for reliable and durable displays in demanding environments. The Healthcare sector is also a significant market, with increasing adoption of rugged devices for various applications.
- Dominant Product Types: Panel PCs and mission-critical displays hold the largest market share due to their high performance and suitability for demanding applications. Fully-rugged displays also demonstrate strong growth owing to their ability to withstand extreme conditions.
- Dominant Operating Systems: Windows and Android operating systems are prevalent due to their wide compatibility and extensive software support.
Rugged Display Industry Product Innovations
Recent innovations focus on enhanced brightness, improved durability, and the integration of advanced features such as touch screen technology, high-resolution displays, and wider viewing angles. These advancements cater to the specific demands of various end-user industries, offering unique selling propositions such as improved readability in direct sunlight, increased resistance to shocks and vibrations, and better performance in extreme temperatures. The integration of advanced materials and manufacturing techniques leads to smaller, lighter, and more energy-efficient rugged displays.
Propelling Factors for Rugged Display Industry Growth
Technological advancements, such as the development of brighter, more durable, and energy-efficient displays, are a major driver of market growth. Increased investment in infrastructure projects, particularly in the defense and industrial sectors, is fueling demand for ruggedized devices. Government regulations and standards related to safety and reliability in critical applications also stimulate growth. Moreover, the rising adoption of ruggedized displays in emerging economies is expected to propel market expansion further.
Obstacles in the Rugged Display Industry Market
Supply chain disruptions and the increasing cost of raw materials pose significant challenges to the industry. The high initial investment required for manufacturing rugged displays can act as a barrier to market entry. Intense competition among established players and the emergence of new entrants also pose challenges. Fluctuations in global economic conditions can impact demand and growth prospects.
Future Opportunities in Rugged Display Industry
The integration of advanced technologies such as augmented reality (AR) and virtual reality (VR) into rugged displays presents significant opportunities. The growing demand for ruggedized displays in new markets, such as wearable technology and smart agriculture, promises considerable potential. Furthermore, advancements in flexible and foldable display technologies open new avenues for innovation and market expansion.
Major Players in the Rugged Display Industry Ecosystem
- L3 Technologies Inc
- Kyocera Corp
- Sparton Corp
- Getac Technology Corp
- General Dynamics Corp
- Dell Inc
- Xplore Technologies Corp
- Beijer Electronics AB
- Zebra Technologies Corp
- Esterline Technologies Corp
- Curtiss-Wright Corp
- Panasonic Corporation
Key Developments in Rugged Display Industry
- 2022 Q4: Getac Technology Corp launched a new series of ultra-rugged tablets with enhanced processing power and display resolution.
- 2023 Q1: A significant merger between two key players in the rugged display market reshaped the competitive landscape. [More details to be added]
- 2023 Q3: A new regulatory standard affecting rugged display manufacturing was implemented, impacting production costs. [More details to be added]
- [Add more developments with year/month and impact]
Strategic Rugged Display Industry Market Forecast
The rugged display market is poised for significant growth in the coming years, driven by technological innovation, increased demand from various sectors, and expansion into new markets. The sustained growth is projected to be fueled by the increasing integration of advanced features, improved durability, and the rise of new applications. The market is expected to experience robust growth, outpacing the overall display market. Opportunities exist in niche segments, particularly in specialized applications requiring high levels of ruggedness and performance.
Rugged Display Industry Segmentation
-
1. Product Type
- 1.1. Smartphone and Handheld Computer
- 1.2. Tablet PC
- 1.3. Laptop and Notebook
- 1.4. Avionics Display
- 1.5. Vehicle-mounted Computer
- 1.6. Panel PC and Mission-critical Display
-
2. Level of Ruggedness
- 2.1. Semi-rugged
- 2.2. Fully-rugged
- 2.3. Ultra-rugged
-
3. Operating System
- 3.1. Android
- 3.2. Windows
- 3.3. Other Operating Systems
-
4. End User
- 4.1. Oil and Gas
- 4.2. Government, Defense, and Aerospace
- 4.3. Industrial
- 4.4. Automotive and Transportation
- 4.5. Healthcare
- 4.6. Other End Users
Rugged Display Industry Segmentation By Geography
- 1. North America
- 2. Europe
- 3. Asia Pacific
- 4. Latin America
- 5. Middle East and Africa
Rugged Display Industry REPORT HIGHLIGHTS
| Aspects | Details |
|---|---|
| Study Period | 2019-2033 |
| Base Year | 2024 |
| Estimated Year | 2025 |
| Forecast Period | 2025-2033 |
| Historical Period | 2019-2024 |
| Growth Rate | CAGR of 4.43% from 2019-2033 |
| Segmentation |
|
Table of Contents
- 1. Introduction
- 1.1. Research Scope
- 1.2. Market Segmentation
- 1.3. Research Methodology
- 1.4. Definitions and Assumptions
- 2. Executive Summary
- 2.1. Introduction
- 3. Market Dynamics
- 3.1. Introduction
- 3.2. Market Drivers
- 3.2.1. ; Reduced Total Cost of Ownership (TCO); Rising Demand for HMI and IoT in Various Industries
- 3.3. Market Restrains
- 3.3.1. ; Adoption of Consumer-grade Devices for Industrial Applications
- 3.4. Market Trends
- 3.4.1. Rugged Tablets are Expected to Hold Major Share
- 4. Market Factor Analysis
- 4.1. Porters Five Forces
- 4.2. Supply/Value Chain
- 4.3. PESTEL analysis
- 4.4. Market Entropy
- 4.5. Patent/Trademark Analysis
- 5. Global Rugged Display Industry Analysis, Insights and Forecast, 2019-2031
- 5.1. Market Analysis, Insights and Forecast - by Product Type
- 5.1.1. Smartphone and Handheld Computer
- 5.1.2. Tablet PC
- 5.1.3. Laptop and Notebook
- 5.1.4. Avionics Display
- 5.1.5. Vehicle-mounted Computer
- 5.1.6. Panel PC and Mission-critical Display
- 5.2. Market Analysis, Insights and Forecast - by Level of Ruggedness
- 5.2.1. Semi-rugged
- 5.2.2. Fully-rugged
- 5.2.3. Ultra-rugged
- 5.3. Market Analysis, Insights and Forecast - by Operating System
- 5.3.1. Android
- 5.3.2. Windows
- 5.3.3. Other Operating Systems
- 5.4. Market Analysis, Insights and Forecast - by End User
- 5.4.1. Oil and Gas
- 5.4.2. Government, Defense, and Aerospace
- 5.4.3. Industrial
- 5.4.4. Automotive and Transportation
- 5.4.5. Healthcare
- 5.4.6. Other End Users
- 5.5. Market Analysis, Insights and Forecast - by Region
- 5.5.1. North America
- 5.5.2. Europe
- 5.5.3. Asia Pacific
- 5.5.4. Latin America
- 5.5.5. Middle East and Africa
- 5.1. Market Analysis, Insights and Forecast - by Product Type
- 6. North America Rugged Display Industry Analysis, Insights and Forecast, 2019-2031
- 6.1. Market Analysis, Insights and Forecast - by Product Type
- 6.1.1. Smartphone and Handheld Computer
- 6.1.2. Tablet PC
- 6.1.3. Laptop and Notebook
- 6.1.4. Avionics Display
- 6.1.5. Vehicle-mounted Computer
- 6.1.6. Panel PC and Mission-critical Display
- 6.2. Market Analysis, Insights and Forecast - by Level of Ruggedness
- 6.2.1. Semi-rugged
- 6.2.2. Fully-rugged
- 6.2.3. Ultra-rugged
- 6.3. Market Analysis, Insights and Forecast - by Operating System
- 6.3.1. Android
- 6.3.2. Windows
- 6.3.3. Other Operating Systems
- 6.4. Market Analysis, Insights and Forecast - by End User
- 6.4.1. Oil and Gas
- 6.4.2. Government, Defense, and Aerospace
- 6.4.3. Industrial
- 6.4.4. Automotive and Transportation
- 6.4.5. Healthcare
- 6.4.6. Other End Users
- 6.1. Market Analysis, Insights and Forecast - by Product Type
- 7. Europe Rugged Display Industry Analysis, Insights and Forecast, 2019-2031
- 7.1. Market Analysis, Insights and Forecast - by Product Type
- 7.1.1. Smartphone and Handheld Computer
- 7.1.2. Tablet PC
- 7.1.3. Laptop and Notebook
- 7.1.4. Avionics Display
- 7.1.5. Vehicle-mounted Computer
- 7.1.6. Panel PC and Mission-critical Display
- 7.2. Market Analysis, Insights and Forecast - by Level of Ruggedness
- 7.2.1. Semi-rugged
- 7.2.2. Fully-rugged
- 7.2.3. Ultra-rugged
- 7.3. Market Analysis, Insights and Forecast - by Operating System
- 7.3.1. Android
- 7.3.2. Windows
- 7.3.3. Other Operating Systems
- 7.4. Market Analysis, Insights and Forecast - by End User
- 7.4.1. Oil and Gas
- 7.4.2. Government, Defense, and Aerospace
- 7.4.3. Industrial
- 7.4.4. Automotive and Transportation
- 7.4.5. Healthcare
- 7.4.6. Other End Users
- 7.1. Market Analysis, Insights and Forecast - by Product Type
- 8. Asia Pacific Rugged Display Industry Analysis, Insights and Forecast, 2019-2031
- 8.1. Market Analysis, Insights and Forecast - by Product Type
- 8.1.1. Smartphone and Handheld Computer
- 8.1.2. Tablet PC
- 8.1.3. Laptop and Notebook
- 8.1.4. Avionics Display
- 8.1.5. Vehicle-mounted Computer
- 8.1.6. Panel PC and Mission-critical Display
- 8.2. Market Analysis, Insights and Forecast - by Level of Ruggedness
- 8.2.1. Semi-rugged
- 8.2.2. Fully-rugged
- 8.2.3. Ultra-rugged
- 8.3. Market Analysis, Insights and Forecast - by Operating System
- 8.3.1. Android
- 8.3.2. Windows
- 8.3.3. Other Operating Systems
- 8.4. Market Analysis, Insights and Forecast - by End User
- 8.4.1. Oil and Gas
- 8.4.2. Government, Defense, and Aerospace
- 8.4.3. Industrial
- 8.4.4. Automotive and Transportation
- 8.4.5. Healthcare
- 8.4.6. Other End Users
- 8.1. Market Analysis, Insights and Forecast - by Product Type
- 9. Latin America Rugged Display Industry Analysis, Insights and Forecast, 2019-2031
- 9.1. Market Analysis, Insights and Forecast - by Product Type
- 9.1.1. Smartphone and Handheld Computer
- 9.1.2. Tablet PC
- 9.1.3. Laptop and Notebook
- 9.1.4. Avionics Display
- 9.1.5. Vehicle-mounted Computer
- 9.1.6. Panel PC and Mission-critical Display
- 9.2. Market Analysis, Insights and Forecast - by Level of Ruggedness
- 9.2.1. Semi-rugged
- 9.2.2. Fully-rugged
- 9.2.3. Ultra-rugged
- 9.3. Market Analysis, Insights and Forecast - by Operating System
- 9.3.1. Android
- 9.3.2. Windows
- 9.3.3. Other Operating Systems
- 9.4. Market Analysis, Insights and Forecast - by End User
- 9.4.1. Oil and Gas
- 9.4.2. Government, Defense, and Aerospace
- 9.4.3. Industrial
- 9.4.4. Automotive and Transportation
- 9.4.5. Healthcare
- 9.4.6. Other End Users
- 9.1. Market Analysis, Insights and Forecast - by Product Type
- 10. Middle East and Africa Rugged Display Industry Analysis, Insights and Forecast, 2019-2031
- 10.1. Market Analysis, Insights and Forecast - by Product Type
- 10.1.1. Smartphone and Handheld Computer
- 10.1.2. Tablet PC
- 10.1.3. Laptop and Notebook
- 10.1.4. Avionics Display
- 10.1.5. Vehicle-mounted Computer
- 10.1.6. Panel PC and Mission-critical Display
- 10.2. Market Analysis, Insights and Forecast - by Level of Ruggedness
- 10.2.1. Semi-rugged
- 10.2.2. Fully-rugged
- 10.2.3. Ultra-rugged
- 10.3. Market Analysis, Insights and Forecast - by Operating System
- 10.3.1. Android
- 10.3.2. Windows
- 10.3.3. Other Operating Systems
- 10.4. Market Analysis, Insights and Forecast - by End User
- 10.4.1. Oil and Gas
- 10.4.2. Government, Defense, and Aerospace
- 10.4.3. Industrial
- 10.4.4. Automotive and Transportation
- 10.4.5. Healthcare
- 10.4.6. Other End Users
- 10.1. Market Analysis, Insights and Forecast - by Product Type
- 11. North America Rugged Display Industry Analysis, Insights and Forecast, 2019-2031
- 11.1. Market Analysis, Insights and Forecast - By Country/Sub-region
- 11.1.1.
- 12. Europe Rugged Display Industry Analysis, Insights and Forecast, 2019-2031
- 12.1. Market Analysis, Insights and Forecast - By Country/Sub-region
- 12.1.1.
- 13. Asia Pacific Rugged Display Industry Analysis, Insights and Forecast, 2019-2031
- 13.1. Market Analysis, Insights and Forecast - By Country/Sub-region
- 13.1.1.
- 14. Latin America Rugged Display Industry Analysis, Insights and Forecast, 2019-2031
- 14.1. Market Analysis, Insights and Forecast - By Country/Sub-region
- 14.1.1.
- 15. Middle East and Africa Rugged Display Industry Analysis, Insights and Forecast, 2019-2031
- 15.1. Market Analysis, Insights and Forecast - By Country/Sub-region
- 15.1.1.
- 16. Competitive Analysis
- 16.1. Global Market Share Analysis 2024
- 16.2. Company Profiles
- 16.2.1 L3 Technologies Inc
- 16.2.1.1. Overview
- 16.2.1.2. Products
- 16.2.1.3. SWOT Analysis
- 16.2.1.4. Recent Developments
- 16.2.1.5. Financials (Based on Availability)
- 16.2.2 Kyocera Corp
- 16.2.2.1. Overview
- 16.2.2.2. Products
- 16.2.2.3. SWOT Analysis
- 16.2.2.4. Recent Developments
- 16.2.2.5. Financials (Based on Availability)
- 16.2.3 Sparton Corp
- 16.2.3.1. Overview
- 16.2.3.2. Products
- 16.2.3.3. SWOT Analysis
- 16.2.3.4. Recent Developments
- 16.2.3.5. Financials (Based on Availability)
- 16.2.4 Getac Technology Corp
- 16.2.4.1. Overview
- 16.2.4.2. Products
- 16.2.4.3. SWOT Analysis
- 16.2.4.4. Recent Developments
- 16.2.4.5. Financials (Based on Availability)
- 16.2.5 General Dynamics Corp
- 16.2.5.1. Overview
- 16.2.5.2. Products
- 16.2.5.3. SWOT Analysis
- 16.2.5.4. Recent Developments
- 16.2.5.5. Financials (Based on Availability)
- 16.2.6 Dell Inc
- 16.2.6.1. Overview
- 16.2.6.2. Products
- 16.2.6.3. SWOT Analysis
- 16.2.6.4. Recent Developments
- 16.2.6.5. Financials (Based on Availability)
- 16.2.7 Xplore Technologies Corp
- 16.2.7.1. Overview
- 16.2.7.2. Products
- 16.2.7.3. SWOT Analysis
- 16.2.7.4. Recent Developments
- 16.2.7.5. Financials (Based on Availability)
- 16.2.8 Beijer Electronics AB
- 16.2.8.1. Overview
- 16.2.8.2. Products
- 16.2.8.3. SWOT Analysis
- 16.2.8.4. Recent Developments
- 16.2.8.5. Financials (Based on Availability)
- 16.2.9 Zebra Technologies Corp
- 16.2.9.1. Overview
- 16.2.9.2. Products
- 16.2.9.3. SWOT Analysis
- 16.2.9.4. Recent Developments
- 16.2.9.5. Financials (Based on Availability)
- 16.2.10 Esterline Technologies Corp
- 16.2.10.1. Overview
- 16.2.10.2. Products
- 16.2.10.3. SWOT Analysis
- 16.2.10.4. Recent Developments
- 16.2.10.5. Financials (Based on Availability)
- 16.2.11 Curtiss-Wright Corp
- 16.2.11.1. Overview
- 16.2.11.2. Products
- 16.2.11.3. SWOT Analysis
- 16.2.11.4. Recent Developments
- 16.2.11.5. Financials (Based on Availability)
- 16.2.12 Panasonic Corporation
- 16.2.12.1. Overview
- 16.2.12.2. Products
- 16.2.12.3. SWOT Analysis
- 16.2.12.4. Recent Developments
- 16.2.12.5. Financials (Based on Availability)
- 16.2.1 L3 Technologies Inc
List of Figures
- Figure 1: Global Rugged Display Industry Revenue Breakdown (Million, %) by Region 2024 & 2032
- Figure 2: North America Rugged Display Industry Revenue (Million), by Country 2024 & 2032
- Figure 3: North America Rugged Display Industry Revenue Share (%), by Country 2024 & 2032
- Figure 4: Europe Rugged Display Industry Revenue (Million), by Country 2024 & 2032
- Figure 5: Europe Rugged Display Industry Revenue Share (%), by Country 2024 & 2032
- Figure 6: Asia Pacific Rugged Display Industry Revenue (Million), by Country 2024 & 2032
- Figure 7: Asia Pacific Rugged Display Industry Revenue Share (%), by Country 2024 & 2032
- Figure 8: Latin America Rugged Display Industry Revenue (Million), by Country 2024 & 2032
- Figure 9: Latin America Rugged Display Industry Revenue Share (%), by Country 2024 & 2032
- Figure 10: Middle East and Africa Rugged Display Industry Revenue (Million), by Country 2024 & 2032
- Figure 11: Middle East and Africa Rugged Display Industry Revenue Share (%), by Country 2024 & 2032
- Figure 12: North America Rugged Display Industry Revenue (Million), by Product Type 2024 & 2032
- Figure 13: North America Rugged Display Industry Revenue Share (%), by Product Type 2024 & 2032
- Figure 14: North America Rugged Display Industry Revenue (Million), by Level of Ruggedness 2024 & 2032
- Figure 15: North America Rugged Display Industry Revenue Share (%), by Level of Ruggedness 2024 & 2032
- Figure 16: North America Rugged Display Industry Revenue (Million), by Operating System 2024 & 2032
- Figure 17: North America Rugged Display Industry Revenue Share (%), by Operating System 2024 & 2032
- Figure 18: North America Rugged Display Industry Revenue (Million), by End User 2024 & 2032
- Figure 19: North America Rugged Display Industry Revenue Share (%), by End User 2024 & 2032
- Figure 20: North America Rugged Display Industry Revenue (Million), by Country 2024 & 2032
- Figure 21: North America Rugged Display Industry Revenue Share (%), by Country 2024 & 2032
- Figure 22: Europe Rugged Display Industry Revenue (Million), by Product Type 2024 & 2032
- Figure 23: Europe Rugged Display Industry Revenue Share (%), by Product Type 2024 & 2032
- Figure 24: Europe Rugged Display Industry Revenue (Million), by Level of Ruggedness 2024 & 2032
- Figure 25: Europe Rugged Display Industry Revenue Share (%), by Level of Ruggedness 2024 & 2032
- Figure 26: Europe Rugged Display Industry Revenue (Million), by Operating System 2024 & 2032
- Figure 27: Europe Rugged Display Industry Revenue Share (%), by Operating System 2024 & 2032
- Figure 28: Europe Rugged Display Industry Revenue (Million), by End User 2024 & 2032
- Figure 29: Europe Rugged Display Industry Revenue Share (%), by End User 2024 & 2032
- Figure 30: Europe Rugged Display Industry Revenue (Million), by Country 2024 & 2032
- Figure 31: Europe Rugged Display Industry Revenue Share (%), by Country 2024 & 2032
- Figure 32: Asia Pacific Rugged Display Industry Revenue (Million), by Product Type 2024 & 2032
- Figure 33: Asia Pacific Rugged Display Industry Revenue Share (%), by Product Type 2024 & 2032
- Figure 34: Asia Pacific Rugged Display Industry Revenue (Million), by Level of Ruggedness 2024 & 2032
- Figure 35: Asia Pacific Rugged Display Industry Revenue Share (%), by Level of Ruggedness 2024 & 2032
- Figure 36: Asia Pacific Rugged Display Industry Revenue (Million), by Operating System 2024 & 2032
- Figure 37: Asia Pacific Rugged Display Industry Revenue Share (%), by Operating System 2024 & 2032
- Figure 38: Asia Pacific Rugged Display Industry Revenue (Million), by End User 2024 & 2032
- Figure 39: Asia Pacific Rugged Display Industry Revenue Share (%), by End User 2024 & 2032
- Figure 40: Asia Pacific Rugged Display Industry Revenue (Million), by Country 2024 & 2032
- Figure 41: Asia Pacific Rugged Display Industry Revenue Share (%), by Country 2024 & 2032
- Figure 42: Latin America Rugged Display Industry Revenue (Million), by Product Type 2024 & 2032
- Figure 43: Latin America Rugged Display Industry Revenue Share (%), by Product Type 2024 & 2032
- Figure 44: Latin America Rugged Display Industry Revenue (Million), by Level of Ruggedness 2024 & 2032
- Figure 45: Latin America Rugged Display Industry Revenue Share (%), by Level of Ruggedness 2024 & 2032
- Figure 46: Latin America Rugged Display Industry Revenue (Million), by Operating System 2024 & 2032
- Figure 47: Latin America Rugged Display Industry Revenue Share (%), by Operating System 2024 & 2032
- Figure 48: Latin America Rugged Display Industry Revenue (Million), by End User 2024 & 2032
- Figure 49: Latin America Rugged Display Industry Revenue Share (%), by End User 2024 & 2032
- Figure 50: Latin America Rugged Display Industry Revenue (Million), by Country 2024 & 2032
- Figure 51: Latin America Rugged Display Industry Revenue Share (%), by Country 2024 & 2032
- Figure 52: Middle East and Africa Rugged Display Industry Revenue (Million), by Product Type 2024 & 2032
- Figure 53: Middle East and Africa Rugged Display Industry Revenue Share (%), by Product Type 2024 & 2032
- Figure 54: Middle East and Africa Rugged Display Industry Revenue (Million), by Level of Ruggedness 2024 & 2032
- Figure 55: Middle East and Africa Rugged Display Industry Revenue Share (%), by Level of Ruggedness 2024 & 2032
- Figure 56: Middle East and Africa Rugged Display Industry Revenue (Million), by Operating System 2024 & 2032
- Figure 57: Middle East and Africa Rugged Display Industry Revenue Share (%), by Operating System 2024 & 2032
- Figure 58: Middle East and Africa Rugged Display Industry Revenue (Million), by End User 2024 & 2032
- Figure 59: Middle East and Africa Rugged Display Industry Revenue Share (%), by End User 2024 & 2032
- Figure 60: Middle East and Africa Rugged Display Industry Revenue (Million), by Country 2024 & 2032
- Figure 61: Middle East and Africa Rugged Display Industry Revenue Share (%), by Country 2024 & 2032
List of Tables
- Table 1: Global Rugged Display Industry Revenue Million Forecast, by Region 2019 & 2032
- Table 2: Global Rugged Display Industry Revenue Million Forecast, by Product Type 2019 & 2032
- Table 3: Global Rugged Display Industry Revenue Million Forecast, by Level of Ruggedness 2019 & 2032
- Table 4: Global Rugged Display Industry Revenue Million Forecast, by Operating System 2019 & 2032
- Table 5: Global Rugged Display Industry Revenue Million Forecast, by End User 2019 & 2032
- Table 6: Global Rugged Display Industry Revenue Million Forecast, by Region 2019 & 2032
- Table 7: Global Rugged Display Industry Revenue Million Forecast, by Country 2019 & 2032
- Table 8: Rugged Display Industry Revenue (Million) Forecast, by Application 2019 & 2032
- Table 9: Global Rugged Display Industry Revenue Million Forecast, by Country 2019 & 2032
- Table 10: Rugged Display Industry Revenue (Million) Forecast, by Application 2019 & 2032
- Table 11: Global Rugged Display Industry Revenue Million Forecast, by Country 2019 & 2032
- Table 12: Rugged Display Industry Revenue (Million) Forecast, by Application 2019 & 2032
- Table 13: Global Rugged Display Industry Revenue Million Forecast, by Country 2019 & 2032
- Table 14: Rugged Display Industry Revenue (Million) Forecast, by Application 2019 & 2032
- Table 15: Global Rugged Display Industry Revenue Million Forecast, by Country 2019 & 2032
- Table 16: Rugged Display Industry Revenue (Million) Forecast, by Application 2019 & 2032
- Table 17: Global Rugged Display Industry Revenue Million Forecast, by Product Type 2019 & 2032
- Table 18: Global Rugged Display Industry Revenue Million Forecast, by Level of Ruggedness 2019 & 2032
- Table 19: Global Rugged Display Industry Revenue Million Forecast, by Operating System 2019 & 2032
- Table 20: Global Rugged Display Industry Revenue Million Forecast, by End User 2019 & 2032
- Table 21: Global Rugged Display Industry Revenue Million Forecast, by Country 2019 & 2032
- Table 22: Global Rugged Display Industry Revenue Million Forecast, by Product Type 2019 & 2032
- Table 23: Global Rugged Display Industry Revenue Million Forecast, by Level of Ruggedness 2019 & 2032
- Table 24: Global Rugged Display Industry Revenue Million Forecast, by Operating System 2019 & 2032
- Table 25: Global Rugged Display Industry Revenue Million Forecast, by End User 2019 & 2032
- Table 26: Global Rugged Display Industry Revenue Million Forecast, by Country 2019 & 2032
- Table 27: Global Rugged Display Industry Revenue Million Forecast, by Product Type 2019 & 2032
- Table 28: Global Rugged Display Industry Revenue Million Forecast, by Level of Ruggedness 2019 & 2032
- Table 29: Global Rugged Display Industry Revenue Million Forecast, by Operating System 2019 & 2032
- Table 30: Global Rugged Display Industry Revenue Million Forecast, by End User 2019 & 2032
- Table 31: Global Rugged Display Industry Revenue Million Forecast, by Country 2019 & 2032
- Table 32: Global Rugged Display Industry Revenue Million Forecast, by Product Type 2019 & 2032
- Table 33: Global Rugged Display Industry Revenue Million Forecast, by Level of Ruggedness 2019 & 2032
- Table 34: Global Rugged Display Industry Revenue Million Forecast, by Operating System 2019 & 2032
- Table 35: Global Rugged Display Industry Revenue Million Forecast, by End User 2019 & 2032
- Table 36: Global Rugged Display Industry Revenue Million Forecast, by Country 2019 & 2032
- Table 37: Global Rugged Display Industry Revenue Million Forecast, by Product Type 2019 & 2032
- Table 38: Global Rugged Display Industry Revenue Million Forecast, by Level of Ruggedness 2019 & 2032
- Table 39: Global Rugged Display Industry Revenue Million Forecast, by Operating System 2019 & 2032
- Table 40: Global Rugged Display Industry Revenue Million Forecast, by End User 2019 & 2032
- Table 41: Global Rugged Display Industry Revenue Million Forecast, by Country 2019 & 2032
Frequently Asked Questions
1. What is the projected Compound Annual Growth Rate (CAGR) of the Rugged Display Industry?
The projected CAGR is approximately 4.43%.
2. Which companies are prominent players in the Rugged Display Industry?
Key companies in the market include L3 Technologies Inc, Kyocera Corp, Sparton Corp, Getac Technology Corp, General Dynamics Corp, Dell Inc, Xplore Technologies Corp, Beijer Electronics AB, Zebra Technologies Corp, Esterline Technologies Corp, Curtiss-Wright Corp, Panasonic Corporation.
3. What are the main segments of the Rugged Display Industry?
The market segments include Product Type, Level of Ruggedness, Operating System, End User.
4. Can you provide details about the market size?
The market size is estimated to be USD 10.39 Million as of 2022.
5. What are some drivers contributing to market growth?
; Reduced Total Cost of Ownership (TCO); Rising Demand for HMI and IoT in Various Industries.
6. What are the notable trends driving market growth?
Rugged Tablets are Expected to Hold Major Share.
7. Are there any restraints impacting market growth?
; Adoption of Consumer-grade Devices for Industrial Applications.
8. Can you provide examples of recent developments in the market?
N/A
9. What pricing options are available for accessing the report?
Pricing options include single-user, multi-user, and enterprise licenses priced at USD 4750, USD 5250, and USD 8750 respectively.
10. Is the market size provided in terms of value or volume?
The market size is provided in terms of value, measured in Million.
11. Are there any specific market keywords associated with the report?
Yes, the market keyword associated with the report is "Rugged Display Industry," which aids in identifying and referencing the specific market segment covered.
12. How do I determine which pricing option suits my needs best?
The pricing options vary based on user requirements and access needs. Individual users may opt for single-user licenses, while businesses requiring broader access may choose multi-user or enterprise licenses for cost-effective access to the report.
13. Are there any additional resources or data provided in the Rugged Display Industry report?
While the report offers comprehensive insights, it's advisable to review the specific contents or supplementary materials provided to ascertain if additional resources or data are available.
14. How can I stay updated on further developments or reports in the Rugged Display Industry?
To stay informed about further developments, trends, and reports in the Rugged Display Industry, consider subscribing to industry newsletters, following relevant companies and organizations, or regularly checking reputable industry news sources and publications.
Methodology
Step 1 - Identification of Relevant Samples Size from Population Database


Step 2 - Approaches for Defining Global Market Size (Value, Volume* & Price*)

Note*: In applicable scenarios
Step 3 - Data Sources
Primary Research
- Web Analytics
- Survey Reports
- Research Institute
- Latest Research Reports
- Opinion Leaders
Secondary Research
- Annual Reports
- White Paper
- Latest Press Release
- Industry Association
- Paid Database
- Investor Presentations

Step 4 - Data Triangulation
Involves using different sources of information in order to increase the validity of a study
These sources are likely to be stakeholders in a program - participants, other researchers, program staff, other community members, and so on.
Then we put all data in single framework & apply various statistical tools to find out the dynamic on the market.
During the analysis stage, feedback from the stakeholder groups would be compared to determine areas of agreement as well as areas of divergence
