

Key Insights
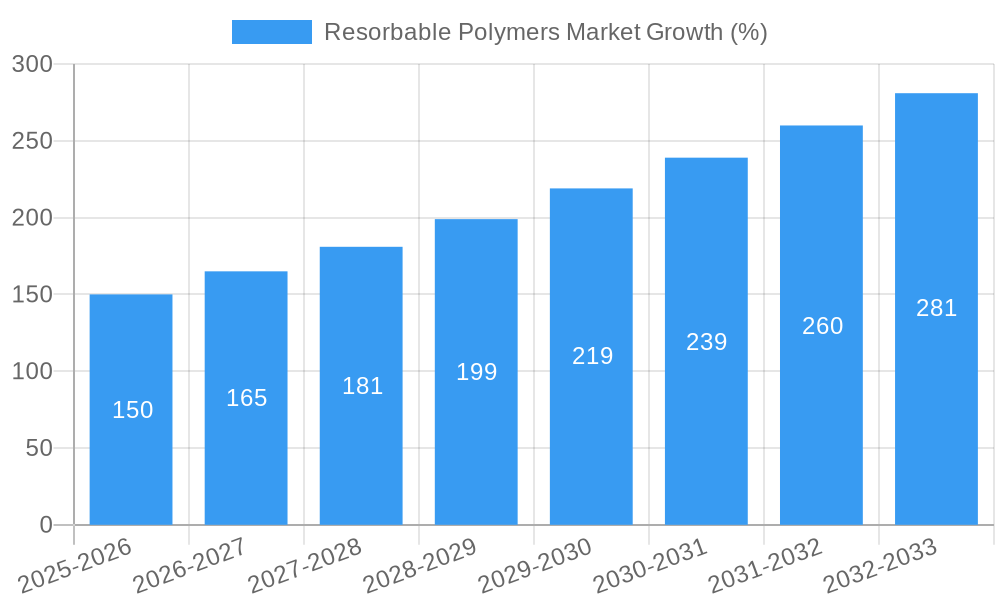
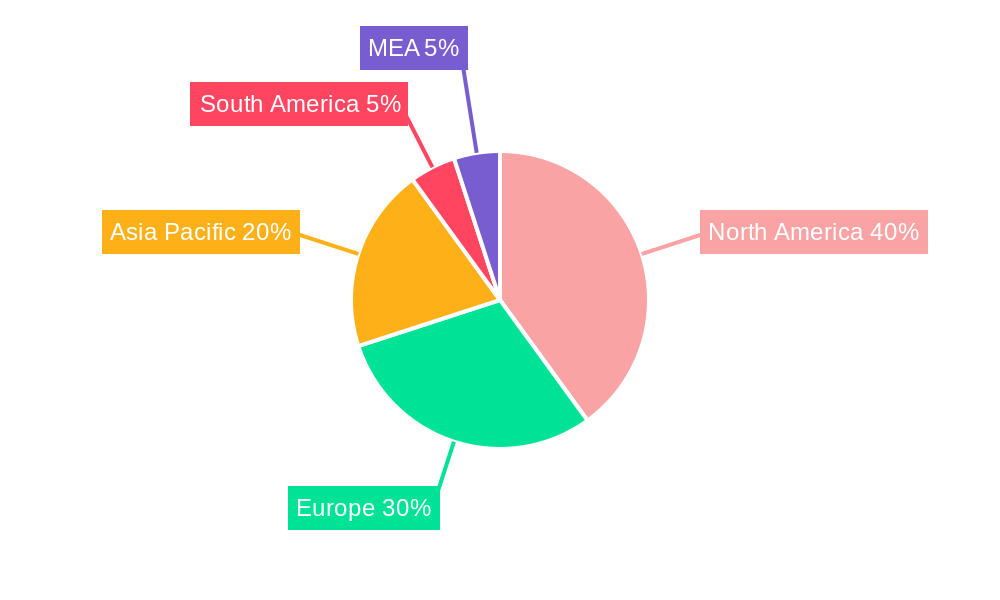
The resorbable polymers market is experiencing robust growth, driven by increasing demand in the medical device and pharmaceutical sectors. A compound annual growth rate (CAGR) exceeding 10% signifies a significant expansion, projected to reach substantial market value by 2033. Key drivers include the rising prevalence of chronic diseases necessitating minimally invasive surgeries and drug delivery systems, coupled with advancements in biomaterial science leading to the development of more effective and biocompatible resorbable polymers. The market segmentation reveals a strong preference for Polylactic Acid (PLA) and Polyglycolic Acid (PGA) due to their established biodegradability and ease of processing, particularly within drug delivery and orthopedic applications. The strong presence of established players like KLS Martin Group and Evonik Industries AG underscores the market's maturity and potential for further innovation. Geographic analysis suggests a dominant North American market share initially, with significant growth opportunities anticipated in the Asia-Pacific region driven by rising healthcare expenditure and expanding medical infrastructure. However, regulatory hurdles and potential challenges related to biocompatibility and degradation rates present some restraints to market expansion. The ongoing research and development efforts focused on improving polymer properties and expanding their applications will likely shape future market dynamics.
The forecast period (2025-2033) presents several strategic opportunities for market participants. Companies are focusing on developing novel formulations with enhanced properties such as improved mechanical strength, controlled degradation rates, and tailored drug release profiles. Strategic partnerships and mergers and acquisitions are anticipated to play a crucial role in consolidating market share and driving innovation. Furthermore, the increasing focus on personalized medicine is expected to further fuel demand for customized resorbable polymer-based medical devices. The competitive landscape is characterized by a mix of large multinational corporations and specialized smaller companies. Success will hinge on the ability to innovate, secure regulatory approvals, and effectively cater to the evolving needs of diverse end-users. Sustained research into biodegradable polymers with improved biocompatibility and efficacy will remain critical to propel the market towards even higher growth trajectories.
Resorbable Polymers Market: A Comprehensive Report (2019-2033)
This insightful report provides a deep dive into the global Resorbable Polymers market, offering a comprehensive analysis of its current state, future trajectory, and key players. Covering the period from 2019 to 2033, with a base year of 2025 and a forecast period of 2025-2033, this report is an indispensable resource for stakeholders seeking to understand and capitalize on the opportunities within this dynamic market. The total market value is estimated at xx Million in 2025 and is projected to reach xx Million by 2033.
Resorbable Polymers Market Composition & Trends
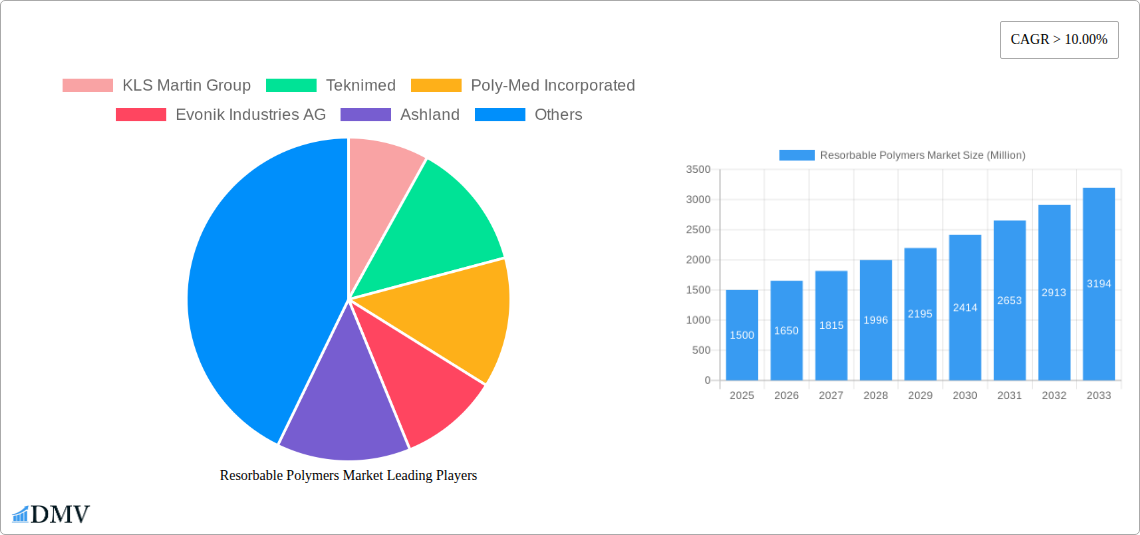
This section analyzes the competitive landscape, innovation drivers, regulatory environment, and market dynamics of the resorbable polymers market. We examine market concentration, assessing the market share distribution among key players such as KLS Martin Group, Teknimed, Poly-Med Incorporated, Evonik Industries AG, Ashland, Biogeneral, Foster Corporation, and CORBION. The report details M&A activities, including deal values and their impact on market consolidation. Innovation catalysts, such as advancements in polymer chemistry and material science, are thoroughly investigated, alongside an analysis of the regulatory landscape impacting product approvals and market access. Furthermore, we explore substitute products and their potential impact on market growth, coupled with an in-depth profile of end-users across various sectors.
- Market Concentration: The market is moderately concentrated, with the top five players holding an estimated xx% market share in 2025.
- M&A Activity: Analysis of significant M&A deals, including deal values and strategic implications. For example, the xx Million acquisition of LACTEL Absorbable Polymers by Evonik in 2021 significantly altered the market landscape.
- Innovation: Focus on novel polymer formulations, improved biocompatibility, and enhanced degradation profiles.
- Regulatory Landscape: Detailed overview of regulatory frameworks and their impact on market growth.
- Substitute Products: Evaluation of competing materials and their market penetration.
Resorbable Polymers Market Industry Evolution
This section charts the historical and projected evolution of the resorbable polymers market. We analyze market growth trajectories from 2019 to 2024, detailing growth rates and key factors influencing market expansion. Technological advancements, such as the development of novel bioresorbable polymers with tailored properties, are discussed in detail, along with the impact of these advancements on market adoption. Shifting consumer demands, particularly in the medical device and pharmaceutical sectors, are examined, providing insights into evolving application preferences and their influence on market segmentation. The analysis incorporates data points on growth rates, adoption metrics, and technological milestones, showcasing the dynamic nature of this market.
Leading Regions, Countries, or Segments in Resorbable Polymers Market
This section identifies the leading regions, countries, and market segments within the resorbable polymers industry. A detailed analysis reveals the dominant segments based on material type (Polylactic Acid (PLA), Polyglycolic Acid (PGA), Polycaprolactone (PCL), PGA/PLA Copolymers) and application (Drug Delivery, Orthopedics). The analysis highlights key drivers for dominance in each segment and region, focusing on investment trends, regulatory support, and market-specific factors.
- Dominant Regions: North America and Europe are currently leading, driven by robust healthcare infrastructure and technological advancements. Asia-Pacific is expected to show significant growth.
- Dominant Materials: PLA and PGA currently hold a significant market share due to their established track record and biocompatibility.
- Dominant Applications: The orthopedics segment demonstrates substantial growth potential driven by the increasing demand for minimally invasive surgical procedures.
- Key Drivers:
- Increased R&D investments in advanced biomaterials.
- Stringent regulatory approvals driving market standardization.
- Growing demand for minimally invasive surgical procedures.
Resorbable Polymers Market Product Innovations
This section showcases recent product innovations in resorbable polymers, including novel formulations, improved performance characteristics, and expanded applications. We analyze the unique selling propositions of newly introduced products, highlighting their advantages over existing alternatives. Technological advancements, such as improved control over degradation rates and enhanced mechanical properties, are also examined.
Propelling Factors for Resorbable Polymers Market Growth
Several factors are driving the growth of the resorbable polymers market. Technological advancements, leading to improved biocompatibility and controlled degradation, are key. Economic factors, such as the rising demand for cost-effective medical solutions and increasing disposable incomes in developing countries, are also significant. Supportive regulatory frameworks, facilitating product approvals and market entry, further contribute to market expansion.
Obstacles in the Resorbable Polymers Market
Despite significant growth potential, the resorbable polymers market faces certain challenges. Regulatory hurdles, including stringent approval processes and varying standards across different regions, can impede market penetration. Supply chain disruptions, especially concerning raw materials, can impact production and increase costs. Intense competition among established players and the emergence of new entrants also pose challenges.
Future Opportunities in Resorbable Polymers Market
The resorbable polymers market presents numerous future opportunities. Expanding into new markets, particularly in developing economies, offers significant growth potential. Developing innovative applications in tissue engineering, drug delivery systems, and regenerative medicine presents further avenues for expansion. Exploring advanced polymer chemistries to improve biodegradability and tailor material properties to specific applications will also shape future market dynamics.
Major Players in the Resorbable Polymers Market Ecosystem
- KLS Martin Group
- Teknimed
- Poly-Med Incorporated
- Evonik Industries AG
- Ashland
- Biogeneral
- Foster Corporation
- CORBION
Key Developments in Resorbable Polymers Market Industry
- Jan 2021: Evonik announced the closing of the LACTEL Absorbable Polymers acquisition from DURECT Corporation.
Strategic Resorbable Polymers Market Forecast
The resorbable polymers market is poised for robust growth in the coming years, driven by technological advancements, increasing demand for minimally invasive medical procedures, and the expansion of its applications in diverse fields. Future market potential is significant, particularly in emerging economies. The continued innovation in biomaterial science and supportive regulatory environments will further fuel market expansion, ensuring strong growth throughout the forecast period.
Resorbable Polymers Market Segmentation
-
1. Material
- 1.1. Polylactic Acid (PLA)
- 1.2. Polyglycolic Acid (PGA)
- 1.3. Polycaprolactone (PCL)
- 1.4. PGA/PLA Copolymers
-
2. Application
- 2.1. Drug Delivery
- 2.2. Orthopedics
Resorbable Polymers Market Segmentation By Geography
-
1. Asia Pacific
- 1.1. China
- 1.2. India
- 1.3. Japan
- 1.4. South Korea
- 1.5. Rest of Asia Pacific
-
2. North America
- 2.1. United States
- 2.2. Canada
- 2.3. Mexico
-
3. Europe
- 3.1. Germany
- 3.2. United Kingdom
- 3.3. Italy
- 3.4. France
- 3.5. Rest of Europe
-
4. South America
- 4.1. Brazil
- 4.2. Argentina
- 4.3. Rest of South America
-
5. Middle East & Africa
- 5.1. UAE
- 5.2. Saudi Arabia
- 5.3. South Africa
- 5.4. Rest of Middle East & Africa
Resorbable Polymers Market REPORT HIGHLIGHTS
| Aspects | Details |
|---|---|
| Study Period | 2019-2033 |
| Base Year | 2024 |
| Estimated Year | 2025 |
| Forecast Period | 2025-2033 |
| Historical Period | 2019-2024 |
| Growth Rate | CAGR of > 10.00% from 2019-2033 |
| Segmentation |
|
Table of Contents
- 1. Introduction
- 1.1. Research Scope
- 1.2. Market Segmentation
- 1.3. Research Methodology
- 1.4. Definitions and Assumptions
- 2. Executive Summary
- 2.1. Introduction
- 3. Market Dynamics
- 3.1. Introduction
- 3.2. Market Drivers
- 3.2.1. Growing Demand from Medical Industry; Other Drivers
- 3.3. Market Restrains
- 3.3.1. Other Restraints
- 3.4. Market Trends
- 3.4.1. Orthopedics to Dominate the Market
- 4. Market Factor Analysis
- 4.1. Porters Five Forces
- 4.2. Supply/Value Chain
- 4.3. PESTEL analysis
- 4.4. Market Entropy
- 4.5. Patent/Trademark Analysis
- 5. Global Resorbable Polymers Market Analysis, Insights and Forecast, 2019-2031
- 5.1. Market Analysis, Insights and Forecast - by Material
- 5.1.1. Polylactic Acid (PLA)
- 5.1.2. Polyglycolic Acid (PGA)
- 5.1.3. Polycaprolactone (PCL)
- 5.1.4. PGA/PLA Copolymers
- 5.2. Market Analysis, Insights and Forecast - by Application
- 5.2.1. Drug Delivery
- 5.2.2. Orthopedics
- 5.3. Market Analysis, Insights and Forecast - by Region
- 5.3.1. Asia Pacific
- 5.3.2. North America
- 5.3.3. Europe
- 5.3.4. South America
- 5.3.5. Middle East & Africa
- 5.1. Market Analysis, Insights and Forecast - by Material
- 6. Asia Pacific Resorbable Polymers Market Analysis, Insights and Forecast, 2019-2031
- 6.1. Market Analysis, Insights and Forecast - by Material
- 6.1.1. Polylactic Acid (PLA)
- 6.1.2. Polyglycolic Acid (PGA)
- 6.1.3. Polycaprolactone (PCL)
- 6.1.4. PGA/PLA Copolymers
- 6.2. Market Analysis, Insights and Forecast - by Application
- 6.2.1. Drug Delivery
- 6.2.2. Orthopedics
- 6.1. Market Analysis, Insights and Forecast - by Material
- 7. North America Resorbable Polymers Market Analysis, Insights and Forecast, 2019-2031
- 7.1. Market Analysis, Insights and Forecast - by Material
- 7.1.1. Polylactic Acid (PLA)
- 7.1.2. Polyglycolic Acid (PGA)
- 7.1.3. Polycaprolactone (PCL)
- 7.1.4. PGA/PLA Copolymers
- 7.2. Market Analysis, Insights and Forecast - by Application
- 7.2.1. Drug Delivery
- 7.2.2. Orthopedics
- 7.1. Market Analysis, Insights and Forecast - by Material
- 8. Europe Resorbable Polymers Market Analysis, Insights and Forecast, 2019-2031
- 8.1. Market Analysis, Insights and Forecast - by Material
- 8.1.1. Polylactic Acid (PLA)
- 8.1.2. Polyglycolic Acid (PGA)
- 8.1.3. Polycaprolactone (PCL)
- 8.1.4. PGA/PLA Copolymers
- 8.2. Market Analysis, Insights and Forecast - by Application
- 8.2.1. Drug Delivery
- 8.2.2. Orthopedics
- 8.1. Market Analysis, Insights and Forecast - by Material
- 9. South America Resorbable Polymers Market Analysis, Insights and Forecast, 2019-2031
- 9.1. Market Analysis, Insights and Forecast - by Material
- 9.1.1. Polylactic Acid (PLA)
- 9.1.2. Polyglycolic Acid (PGA)
- 9.1.3. Polycaprolactone (PCL)
- 9.1.4. PGA/PLA Copolymers
- 9.2. Market Analysis, Insights and Forecast - by Application
- 9.2.1. Drug Delivery
- 9.2.2. Orthopedics
- 9.1. Market Analysis, Insights and Forecast - by Material
- 10. Middle East & Africa Resorbable Polymers Market Analysis, Insights and Forecast, 2019-2031
- 10.1. Market Analysis, Insights and Forecast - by Material
- 10.1.1. Polylactic Acid (PLA)
- 10.1.2. Polyglycolic Acid (PGA)
- 10.1.3. Polycaprolactone (PCL)
- 10.1.4. PGA/PLA Copolymers
- 10.2. Market Analysis, Insights and Forecast - by Application
- 10.2.1. Drug Delivery
- 10.2.2. Orthopedics
- 10.1. Market Analysis, Insights and Forecast - by Material
- 11. North America Resorbable Polymers Market Analysis, Insights and Forecast, 2019-2031
- 11.1. Market Analysis, Insights and Forecast - By Country/Sub-region
- 11.1.1 United States
- 11.1.2 Canada
- 11.1.3 Mexico
- 12. Europe Resorbable Polymers Market Analysis, Insights and Forecast, 2019-2031
- 12.1. Market Analysis, Insights and Forecast - By Country/Sub-region
- 12.1.1 Germany
- 12.1.2 United Kingdom
- 12.1.3 France
- 12.1.4 Spain
- 12.1.5 Italy
- 12.1.6 Spain
- 12.1.7 Belgium
- 12.1.8 Netherland
- 12.1.9 Nordics
- 12.1.10 Rest of Europe
- 13. Asia Pacific Resorbable Polymers Market Analysis, Insights and Forecast, 2019-2031
- 13.1. Market Analysis, Insights and Forecast - By Country/Sub-region
- 13.1.1 China
- 13.1.2 Japan
- 13.1.3 India
- 13.1.4 South Korea
- 13.1.5 Southeast Asia
- 13.1.6 Australia
- 13.1.7 Indonesia
- 13.1.8 Phillipes
- 13.1.9 Singapore
- 13.1.10 Thailandc
- 13.1.11 Rest of Asia Pacific
- 14. South America Resorbable Polymers Market Analysis, Insights and Forecast, 2019-2031
- 14.1. Market Analysis, Insights and Forecast - By Country/Sub-region
- 14.1.1 Brazil
- 14.1.2 Argentina
- 14.1.3 Peru
- 14.1.4 Chile
- 14.1.5 Colombia
- 14.1.6 Ecuador
- 14.1.7 Venezuela
- 14.1.8 Rest of South America
- 15. North America Resorbable Polymers Market Analysis, Insights and Forecast, 2019-2031
- 15.1. Market Analysis, Insights and Forecast - By Country/Sub-region
- 15.1.1 United States
- 15.1.2 Canada
- 15.1.3 Mexico
- 16. MEA Resorbable Polymers Market Analysis, Insights and Forecast, 2019-2031
- 16.1. Market Analysis, Insights and Forecast - By Country/Sub-region
- 16.1.1 United Arab Emirates
- 16.1.2 Saudi Arabia
- 16.1.3 South Africa
- 16.1.4 Rest of Middle East and Africa
- 17. Competitive Analysis
- 17.1. Global Market Share Analysis 2024
- 17.2. Company Profiles
- 17.2.1 KLS Martin Group
- 17.2.1.1. Overview
- 17.2.1.2. Products
- 17.2.1.3. SWOT Analysis
- 17.2.1.4. Recent Developments
- 17.2.1.5. Financials (Based on Availability)
- 17.2.2 Teknimed
- 17.2.2.1. Overview
- 17.2.2.2. Products
- 17.2.2.3. SWOT Analysis
- 17.2.2.4. Recent Developments
- 17.2.2.5. Financials (Based on Availability)
- 17.2.3 Poly-Med Incorporated
- 17.2.3.1. Overview
- 17.2.3.2. Products
- 17.2.3.3. SWOT Analysis
- 17.2.3.4. Recent Developments
- 17.2.3.5. Financials (Based on Availability)
- 17.2.4 Evonik Industries AG
- 17.2.4.1. Overview
- 17.2.4.2. Products
- 17.2.4.3. SWOT Analysis
- 17.2.4.4. Recent Developments
- 17.2.4.5. Financials (Based on Availability)
- 17.2.5 Ashland
- 17.2.5.1. Overview
- 17.2.5.2. Products
- 17.2.5.3. SWOT Analysis
- 17.2.5.4. Recent Developments
- 17.2.5.5. Financials (Based on Availability)
- 17.2.6 Biogeneral
- 17.2.6.1. Overview
- 17.2.6.2. Products
- 17.2.6.3. SWOT Analysis
- 17.2.6.4. Recent Developments
- 17.2.6.5. Financials (Based on Availability)
- 17.2.7 Foster Corporation
- 17.2.7.1. Overview
- 17.2.7.2. Products
- 17.2.7.3. SWOT Analysis
- 17.2.7.4. Recent Developments
- 17.2.7.5. Financials (Based on Availability)
- 17.2.8 CORBION
- 17.2.8.1. Overview
- 17.2.8.2. Products
- 17.2.8.3. SWOT Analysis
- 17.2.8.4. Recent Developments
- 17.2.8.5. Financials (Based on Availability)
- 17.2.1 KLS Martin Group
List of Figures
- Figure 1: Global Resorbable Polymers Market Revenue Breakdown (Million, %) by Region 2024 & 2032
- Figure 2: Global Resorbable Polymers Market Volume Breakdown (K Tons, %) by Region 2024 & 2032
- Figure 3: North America Resorbable Polymers Market Revenue (Million), by Country 2024 & 2032
- Figure 4: North America Resorbable Polymers Market Volume (K Tons), by Country 2024 & 2032
- Figure 5: North America Resorbable Polymers Market Revenue Share (%), by Country 2024 & 2032
- Figure 6: North America Resorbable Polymers Market Volume Share (%), by Country 2024 & 2032
- Figure 7: Europe Resorbable Polymers Market Revenue (Million), by Country 2024 & 2032
- Figure 8: Europe Resorbable Polymers Market Volume (K Tons), by Country 2024 & 2032
- Figure 9: Europe Resorbable Polymers Market Revenue Share (%), by Country 2024 & 2032
- Figure 10: Europe Resorbable Polymers Market Volume Share (%), by Country 2024 & 2032
- Figure 11: Asia Pacific Resorbable Polymers Market Revenue (Million), by Country 2024 & 2032
- Figure 12: Asia Pacific Resorbable Polymers Market Volume (K Tons), by Country 2024 & 2032
- Figure 13: Asia Pacific Resorbable Polymers Market Revenue Share (%), by Country 2024 & 2032
- Figure 14: Asia Pacific Resorbable Polymers Market Volume Share (%), by Country 2024 & 2032
- Figure 15: South America Resorbable Polymers Market Revenue (Million), by Country 2024 & 2032
- Figure 16: South America Resorbable Polymers Market Volume (K Tons), by Country 2024 & 2032
- Figure 17: South America Resorbable Polymers Market Revenue Share (%), by Country 2024 & 2032
- Figure 18: South America Resorbable Polymers Market Volume Share (%), by Country 2024 & 2032
- Figure 19: North America Resorbable Polymers Market Revenue (Million), by Country 2024 & 2032
- Figure 20: North America Resorbable Polymers Market Volume (K Tons), by Country 2024 & 2032
- Figure 21: North America Resorbable Polymers Market Revenue Share (%), by Country 2024 & 2032
- Figure 22: North America Resorbable Polymers Market Volume Share (%), by Country 2024 & 2032
- Figure 23: MEA Resorbable Polymers Market Revenue (Million), by Country 2024 & 2032
- Figure 24: MEA Resorbable Polymers Market Volume (K Tons), by Country 2024 & 2032
- Figure 25: MEA Resorbable Polymers Market Revenue Share (%), by Country 2024 & 2032
- Figure 26: MEA Resorbable Polymers Market Volume Share (%), by Country 2024 & 2032
- Figure 27: Asia Pacific Resorbable Polymers Market Revenue (Million), by Material 2024 & 2032
- Figure 28: Asia Pacific Resorbable Polymers Market Volume (K Tons), by Material 2024 & 2032
- Figure 29: Asia Pacific Resorbable Polymers Market Revenue Share (%), by Material 2024 & 2032
- Figure 30: Asia Pacific Resorbable Polymers Market Volume Share (%), by Material 2024 & 2032
- Figure 31: Asia Pacific Resorbable Polymers Market Revenue (Million), by Application 2024 & 2032
- Figure 32: Asia Pacific Resorbable Polymers Market Volume (K Tons), by Application 2024 & 2032
- Figure 33: Asia Pacific Resorbable Polymers Market Revenue Share (%), by Application 2024 & 2032
- Figure 34: Asia Pacific Resorbable Polymers Market Volume Share (%), by Application 2024 & 2032
- Figure 35: Asia Pacific Resorbable Polymers Market Revenue (Million), by Country 2024 & 2032
- Figure 36: Asia Pacific Resorbable Polymers Market Volume (K Tons), by Country 2024 & 2032
- Figure 37: Asia Pacific Resorbable Polymers Market Revenue Share (%), by Country 2024 & 2032
- Figure 38: Asia Pacific Resorbable Polymers Market Volume Share (%), by Country 2024 & 2032
- Figure 39: North America Resorbable Polymers Market Revenue (Million), by Material 2024 & 2032
- Figure 40: North America Resorbable Polymers Market Volume (K Tons), by Material 2024 & 2032
- Figure 41: North America Resorbable Polymers Market Revenue Share (%), by Material 2024 & 2032
- Figure 42: North America Resorbable Polymers Market Volume Share (%), by Material 2024 & 2032
- Figure 43: North America Resorbable Polymers Market Revenue (Million), by Application 2024 & 2032
- Figure 44: North America Resorbable Polymers Market Volume (K Tons), by Application 2024 & 2032
- Figure 45: North America Resorbable Polymers Market Revenue Share (%), by Application 2024 & 2032
- Figure 46: North America Resorbable Polymers Market Volume Share (%), by Application 2024 & 2032
- Figure 47: North America Resorbable Polymers Market Revenue (Million), by Country 2024 & 2032
- Figure 48: North America Resorbable Polymers Market Volume (K Tons), by Country 2024 & 2032
- Figure 49: North America Resorbable Polymers Market Revenue Share (%), by Country 2024 & 2032
- Figure 50: North America Resorbable Polymers Market Volume Share (%), by Country 2024 & 2032
- Figure 51: Europe Resorbable Polymers Market Revenue (Million), by Material 2024 & 2032
- Figure 52: Europe Resorbable Polymers Market Volume (K Tons), by Material 2024 & 2032
- Figure 53: Europe Resorbable Polymers Market Revenue Share (%), by Material 2024 & 2032
- Figure 54: Europe Resorbable Polymers Market Volume Share (%), by Material 2024 & 2032
- Figure 55: Europe Resorbable Polymers Market Revenue (Million), by Application 2024 & 2032
- Figure 56: Europe Resorbable Polymers Market Volume (K Tons), by Application 2024 & 2032
- Figure 57: Europe Resorbable Polymers Market Revenue Share (%), by Application 2024 & 2032
- Figure 58: Europe Resorbable Polymers Market Volume Share (%), by Application 2024 & 2032
- Figure 59: Europe Resorbable Polymers Market Revenue (Million), by Country 2024 & 2032
- Figure 60: Europe Resorbable Polymers Market Volume (K Tons), by Country 2024 & 2032
- Figure 61: Europe Resorbable Polymers Market Revenue Share (%), by Country 2024 & 2032
- Figure 62: Europe Resorbable Polymers Market Volume Share (%), by Country 2024 & 2032
- Figure 63: South America Resorbable Polymers Market Revenue (Million), by Material 2024 & 2032
- Figure 64: South America Resorbable Polymers Market Volume (K Tons), by Material 2024 & 2032
- Figure 65: South America Resorbable Polymers Market Revenue Share (%), by Material 2024 & 2032
- Figure 66: South America Resorbable Polymers Market Volume Share (%), by Material 2024 & 2032
- Figure 67: South America Resorbable Polymers Market Revenue (Million), by Application 2024 & 2032
- Figure 68: South America Resorbable Polymers Market Volume (K Tons), by Application 2024 & 2032
- Figure 69: South America Resorbable Polymers Market Revenue Share (%), by Application 2024 & 2032
- Figure 70: South America Resorbable Polymers Market Volume Share (%), by Application 2024 & 2032
- Figure 71: South America Resorbable Polymers Market Revenue (Million), by Country 2024 & 2032
- Figure 72: South America Resorbable Polymers Market Volume (K Tons), by Country 2024 & 2032
- Figure 73: South America Resorbable Polymers Market Revenue Share (%), by Country 2024 & 2032
- Figure 74: South America Resorbable Polymers Market Volume Share (%), by Country 2024 & 2032
- Figure 75: Middle East & Africa Resorbable Polymers Market Revenue (Million), by Material 2024 & 2032
- Figure 76: Middle East & Africa Resorbable Polymers Market Volume (K Tons), by Material 2024 & 2032
- Figure 77: Middle East & Africa Resorbable Polymers Market Revenue Share (%), by Material 2024 & 2032
- Figure 78: Middle East & Africa Resorbable Polymers Market Volume Share (%), by Material 2024 & 2032
- Figure 79: Middle East & Africa Resorbable Polymers Market Revenue (Million), by Application 2024 & 2032
- Figure 80: Middle East & Africa Resorbable Polymers Market Volume (K Tons), by Application 2024 & 2032
- Figure 81: Middle East & Africa Resorbable Polymers Market Revenue Share (%), by Application 2024 & 2032
- Figure 82: Middle East & Africa Resorbable Polymers Market Volume Share (%), by Application 2024 & 2032
- Figure 83: Middle East & Africa Resorbable Polymers Market Revenue (Million), by Country 2024 & 2032
- Figure 84: Middle East & Africa Resorbable Polymers Market Volume (K Tons), by Country 2024 & 2032
- Figure 85: Middle East & Africa Resorbable Polymers Market Revenue Share (%), by Country 2024 & 2032
- Figure 86: Middle East & Africa Resorbable Polymers Market Volume Share (%), by Country 2024 & 2032
List of Tables
- Table 1: Global Resorbable Polymers Market Revenue Million Forecast, by Region 2019 & 2032
- Table 2: Global Resorbable Polymers Market Volume K Tons Forecast, by Region 2019 & 2032
- Table 3: Global Resorbable Polymers Market Revenue Million Forecast, by Material 2019 & 2032
- Table 4: Global Resorbable Polymers Market Volume K Tons Forecast, by Material 2019 & 2032
- Table 5: Global Resorbable Polymers Market Revenue Million Forecast, by Application 2019 & 2032
- Table 6: Global Resorbable Polymers Market Volume K Tons Forecast, by Application 2019 & 2032
- Table 7: Global Resorbable Polymers Market Revenue Million Forecast, by Region 2019 & 2032
- Table 8: Global Resorbable Polymers Market Volume K Tons Forecast, by Region 2019 & 2032
- Table 9: Global Resorbable Polymers Market Revenue Million Forecast, by Country 2019 & 2032
- Table 10: Global Resorbable Polymers Market Volume K Tons Forecast, by Country 2019 & 2032
- Table 11: United States Resorbable Polymers Market Revenue (Million) Forecast, by Application 2019 & 2032
- Table 12: United States Resorbable Polymers Market Volume (K Tons) Forecast, by Application 2019 & 2032
- Table 13: Canada Resorbable Polymers Market Revenue (Million) Forecast, by Application 2019 & 2032
- Table 14: Canada Resorbable Polymers Market Volume (K Tons) Forecast, by Application 2019 & 2032
- Table 15: Mexico Resorbable Polymers Market Revenue (Million) Forecast, by Application 2019 & 2032
- Table 16: Mexico Resorbable Polymers Market Volume (K Tons) Forecast, by Application 2019 & 2032
- Table 17: Global Resorbable Polymers Market Revenue Million Forecast, by Country 2019 & 2032
- Table 18: Global Resorbable Polymers Market Volume K Tons Forecast, by Country 2019 & 2032
- Table 19: Germany Resorbable Polymers Market Revenue (Million) Forecast, by Application 2019 & 2032
- Table 20: Germany Resorbable Polymers Market Volume (K Tons) Forecast, by Application 2019 & 2032
- Table 21: United Kingdom Resorbable Polymers Market Revenue (Million) Forecast, by Application 2019 & 2032
- Table 22: United Kingdom Resorbable Polymers Market Volume (K Tons) Forecast, by Application 2019 & 2032
- Table 23: France Resorbable Polymers Market Revenue (Million) Forecast, by Application 2019 & 2032
- Table 24: France Resorbable Polymers Market Volume (K Tons) Forecast, by Application 2019 & 2032
- Table 25: Spain Resorbable Polymers Market Revenue (Million) Forecast, by Application 2019 & 2032
- Table 26: Spain Resorbable Polymers Market Volume (K Tons) Forecast, by Application 2019 & 2032
- Table 27: Italy Resorbable Polymers Market Revenue (Million) Forecast, by Application 2019 & 2032
- Table 28: Italy Resorbable Polymers Market Volume (K Tons) Forecast, by Application 2019 & 2032
- Table 29: Spain Resorbable Polymers Market Revenue (Million) Forecast, by Application 2019 & 2032
- Table 30: Spain Resorbable Polymers Market Volume (K Tons) Forecast, by Application 2019 & 2032
- Table 31: Belgium Resorbable Polymers Market Revenue (Million) Forecast, by Application 2019 & 2032
- Table 32: Belgium Resorbable Polymers Market Volume (K Tons) Forecast, by Application 2019 & 2032
- Table 33: Netherland Resorbable Polymers Market Revenue (Million) Forecast, by Application 2019 & 2032
- Table 34: Netherland Resorbable Polymers Market Volume (K Tons) Forecast, by Application 2019 & 2032
- Table 35: Nordics Resorbable Polymers Market Revenue (Million) Forecast, by Application 2019 & 2032
- Table 36: Nordics Resorbable Polymers Market Volume (K Tons) Forecast, by Application 2019 & 2032
- Table 37: Rest of Europe Resorbable Polymers Market Revenue (Million) Forecast, by Application 2019 & 2032
- Table 38: Rest of Europe Resorbable Polymers Market Volume (K Tons) Forecast, by Application 2019 & 2032
- Table 39: Global Resorbable Polymers Market Revenue Million Forecast, by Country 2019 & 2032
- Table 40: Global Resorbable Polymers Market Volume K Tons Forecast, by Country 2019 & 2032
- Table 41: China Resorbable Polymers Market Revenue (Million) Forecast, by Application 2019 & 2032
- Table 42: China Resorbable Polymers Market Volume (K Tons) Forecast, by Application 2019 & 2032
- Table 43: Japan Resorbable Polymers Market Revenue (Million) Forecast, by Application 2019 & 2032
- Table 44: Japan Resorbable Polymers Market Volume (K Tons) Forecast, by Application 2019 & 2032
- Table 45: India Resorbable Polymers Market Revenue (Million) Forecast, by Application 2019 & 2032
- Table 46: India Resorbable Polymers Market Volume (K Tons) Forecast, by Application 2019 & 2032
- Table 47: South Korea Resorbable Polymers Market Revenue (Million) Forecast, by Application 2019 & 2032
- Table 48: South Korea Resorbable Polymers Market Volume (K Tons) Forecast, by Application 2019 & 2032
- Table 49: Southeast Asia Resorbable Polymers Market Revenue (Million) Forecast, by Application 2019 & 2032
- Table 50: Southeast Asia Resorbable Polymers Market Volume (K Tons) Forecast, by Application 2019 & 2032
- Table 51: Australia Resorbable Polymers Market Revenue (Million) Forecast, by Application 2019 & 2032
- Table 52: Australia Resorbable Polymers Market Volume (K Tons) Forecast, by Application 2019 & 2032
- Table 53: Indonesia Resorbable Polymers Market Revenue (Million) Forecast, by Application 2019 & 2032
- Table 54: Indonesia Resorbable Polymers Market Volume (K Tons) Forecast, by Application 2019 & 2032
- Table 55: Phillipes Resorbable Polymers Market Revenue (Million) Forecast, by Application 2019 & 2032
- Table 56: Phillipes Resorbable Polymers Market Volume (K Tons) Forecast, by Application 2019 & 2032
- Table 57: Singapore Resorbable Polymers Market Revenue (Million) Forecast, by Application 2019 & 2032
- Table 58: Singapore Resorbable Polymers Market Volume (K Tons) Forecast, by Application 2019 & 2032
- Table 59: Thailandc Resorbable Polymers Market Revenue (Million) Forecast, by Application 2019 & 2032
- Table 60: Thailandc Resorbable Polymers Market Volume (K Tons) Forecast, by Application 2019 & 2032
- Table 61: Rest of Asia Pacific Resorbable Polymers Market Revenue (Million) Forecast, by Application 2019 & 2032
- Table 62: Rest of Asia Pacific Resorbable Polymers Market Volume (K Tons) Forecast, by Application 2019 & 2032
- Table 63: Global Resorbable Polymers Market Revenue Million Forecast, by Country 2019 & 2032
- Table 64: Global Resorbable Polymers Market Volume K Tons Forecast, by Country 2019 & 2032
- Table 65: Brazil Resorbable Polymers Market Revenue (Million) Forecast, by Application 2019 & 2032
- Table 66: Brazil Resorbable Polymers Market Volume (K Tons) Forecast, by Application 2019 & 2032
- Table 67: Argentina Resorbable Polymers Market Revenue (Million) Forecast, by Application 2019 & 2032
- Table 68: Argentina Resorbable Polymers Market Volume (K Tons) Forecast, by Application 2019 & 2032
- Table 69: Peru Resorbable Polymers Market Revenue (Million) Forecast, by Application 2019 & 2032
- Table 70: Peru Resorbable Polymers Market Volume (K Tons) Forecast, by Application 2019 & 2032
- Table 71: Chile Resorbable Polymers Market Revenue (Million) Forecast, by Application 2019 & 2032
- Table 72: Chile Resorbable Polymers Market Volume (K Tons) Forecast, by Application 2019 & 2032
- Table 73: Colombia Resorbable Polymers Market Revenue (Million) Forecast, by Application 2019 & 2032
- Table 74: Colombia Resorbable Polymers Market Volume (K Tons) Forecast, by Application 2019 & 2032
- Table 75: Ecuador Resorbable Polymers Market Revenue (Million) Forecast, by Application 2019 & 2032
- Table 76: Ecuador Resorbable Polymers Market Volume (K Tons) Forecast, by Application 2019 & 2032
- Table 77: Venezuela Resorbable Polymers Market Revenue (Million) Forecast, by Application 2019 & 2032
- Table 78: Venezuela Resorbable Polymers Market Volume (K Tons) Forecast, by Application 2019 & 2032
- Table 79: Rest of South America Resorbable Polymers Market Revenue (Million) Forecast, by Application 2019 & 2032
- Table 80: Rest of South America Resorbable Polymers Market Volume (K Tons) Forecast, by Application 2019 & 2032
- Table 81: Global Resorbable Polymers Market Revenue Million Forecast, by Country 2019 & 2032
- Table 82: Global Resorbable Polymers Market Volume K Tons Forecast, by Country 2019 & 2032
- Table 83: United States Resorbable Polymers Market Revenue (Million) Forecast, by Application 2019 & 2032
- Table 84: United States Resorbable Polymers Market Volume (K Tons) Forecast, by Application 2019 & 2032
- Table 85: Canada Resorbable Polymers Market Revenue (Million) Forecast, by Application 2019 & 2032
- Table 86: Canada Resorbable Polymers Market Volume (K Tons) Forecast, by Application 2019 & 2032
- Table 87: Mexico Resorbable Polymers Market Revenue (Million) Forecast, by Application 2019 & 2032
- Table 88: Mexico Resorbable Polymers Market Volume (K Tons) Forecast, by Application 2019 & 2032
- Table 89: Global Resorbable Polymers Market Revenue Million Forecast, by Country 2019 & 2032
- Table 90: Global Resorbable Polymers Market Volume K Tons Forecast, by Country 2019 & 2032
- Table 91: United Arab Emirates Resorbable Polymers Market Revenue (Million) Forecast, by Application 2019 & 2032
- Table 92: United Arab Emirates Resorbable Polymers Market Volume (K Tons) Forecast, by Application 2019 & 2032
- Table 93: Saudi Arabia Resorbable Polymers Market Revenue (Million) Forecast, by Application 2019 & 2032
- Table 94: Saudi Arabia Resorbable Polymers Market Volume (K Tons) Forecast, by Application 2019 & 2032
- Table 95: South Africa Resorbable Polymers Market Revenue (Million) Forecast, by Application 2019 & 2032
- Table 96: South Africa Resorbable Polymers Market Volume (K Tons) Forecast, by Application 2019 & 2032
- Table 97: Rest of Middle East and Africa Resorbable Polymers Market Revenue (Million) Forecast, by Application 2019 & 2032
- Table 98: Rest of Middle East and Africa Resorbable Polymers Market Volume (K Tons) Forecast, by Application 2019 & 2032
- Table 99: Global Resorbable Polymers Market Revenue Million Forecast, by Material 2019 & 2032
- Table 100: Global Resorbable Polymers Market Volume K Tons Forecast, by Material 2019 & 2032
- Table 101: Global Resorbable Polymers Market Revenue Million Forecast, by Application 2019 & 2032
- Table 102: Global Resorbable Polymers Market Volume K Tons Forecast, by Application 2019 & 2032
- Table 103: Global Resorbable Polymers Market Revenue Million Forecast, by Country 2019 & 2032
- Table 104: Global Resorbable Polymers Market Volume K Tons Forecast, by Country 2019 & 2032
- Table 105: China Resorbable Polymers Market Revenue (Million) Forecast, by Application 2019 & 2032
- Table 106: China Resorbable Polymers Market Volume (K Tons) Forecast, by Application 2019 & 2032
- Table 107: India Resorbable Polymers Market Revenue (Million) Forecast, by Application 2019 & 2032
- Table 108: India Resorbable Polymers Market Volume (K Tons) Forecast, by Application 2019 & 2032
- Table 109: Japan Resorbable Polymers Market Revenue (Million) Forecast, by Application 2019 & 2032
- Table 110: Japan Resorbable Polymers Market Volume (K Tons) Forecast, by Application 2019 & 2032
- Table 111: South Korea Resorbable Polymers Market Revenue (Million) Forecast, by Application 2019 & 2032
- Table 112: South Korea Resorbable Polymers Market Volume (K Tons) Forecast, by Application 2019 & 2032
- Table 113: Rest of Asia Pacific Resorbable Polymers Market Revenue (Million) Forecast, by Application 2019 & 2032
- Table 114: Rest of Asia Pacific Resorbable Polymers Market Volume (K Tons) Forecast, by Application 2019 & 2032
- Table 115: Global Resorbable Polymers Market Revenue Million Forecast, by Material 2019 & 2032
- Table 116: Global Resorbable Polymers Market Volume K Tons Forecast, by Material 2019 & 2032
- Table 117: Global Resorbable Polymers Market Revenue Million Forecast, by Application 2019 & 2032
- Table 118: Global Resorbable Polymers Market Volume K Tons Forecast, by Application 2019 & 2032
- Table 119: Global Resorbable Polymers Market Revenue Million Forecast, by Country 2019 & 2032
- Table 120: Global Resorbable Polymers Market Volume K Tons Forecast, by Country 2019 & 2032
- Table 121: United States Resorbable Polymers Market Revenue (Million) Forecast, by Application 2019 & 2032
- Table 122: United States Resorbable Polymers Market Volume (K Tons) Forecast, by Application 2019 & 2032
- Table 123: Canada Resorbable Polymers Market Revenue (Million) Forecast, by Application 2019 & 2032
- Table 124: Canada Resorbable Polymers Market Volume (K Tons) Forecast, by Application 2019 & 2032
- Table 125: Mexico Resorbable Polymers Market Revenue (Million) Forecast, by Application 2019 & 2032
- Table 126: Mexico Resorbable Polymers Market Volume (K Tons) Forecast, by Application 2019 & 2032
- Table 127: Global Resorbable Polymers Market Revenue Million Forecast, by Material 2019 & 2032
- Table 128: Global Resorbable Polymers Market Volume K Tons Forecast, by Material 2019 & 2032
- Table 129: Global Resorbable Polymers Market Revenue Million Forecast, by Application 2019 & 2032
- Table 130: Global Resorbable Polymers Market Volume K Tons Forecast, by Application 2019 & 2032
- Table 131: Global Resorbable Polymers Market Revenue Million Forecast, by Country 2019 & 2032
- Table 132: Global Resorbable Polymers Market Volume K Tons Forecast, by Country 2019 & 2032
- Table 133: Germany Resorbable Polymers Market Revenue (Million) Forecast, by Application 2019 & 2032
- Table 134: Germany Resorbable Polymers Market Volume (K Tons) Forecast, by Application 2019 & 2032
- Table 135: United Kingdom Resorbable Polymers Market Revenue (Million) Forecast, by Application 2019 & 2032
- Table 136: United Kingdom Resorbable Polymers Market Volume (K Tons) Forecast, by Application 2019 & 2032
- Table 137: Italy Resorbable Polymers Market Revenue (Million) Forecast, by Application 2019 & 2032
- Table 138: Italy Resorbable Polymers Market Volume (K Tons) Forecast, by Application 2019 & 2032
- Table 139: France Resorbable Polymers Market Revenue (Million) Forecast, by Application 2019 & 2032
- Table 140: France Resorbable Polymers Market Volume (K Tons) Forecast, by Application 2019 & 2032
- Table 141: Rest of Europe Resorbable Polymers Market Revenue (Million) Forecast, by Application 2019 & 2032
- Table 142: Rest of Europe Resorbable Polymers Market Volume (K Tons) Forecast, by Application 2019 & 2032
- Table 143: Global Resorbable Polymers Market Revenue Million Forecast, by Material 2019 & 2032
- Table 144: Global Resorbable Polymers Market Volume K Tons Forecast, by Material 2019 & 2032
- Table 145: Global Resorbable Polymers Market Revenue Million Forecast, by Application 2019 & 2032
- Table 146: Global Resorbable Polymers Market Volume K Tons Forecast, by Application 2019 & 2032
- Table 147: Global Resorbable Polymers Market Revenue Million Forecast, by Country 2019 & 2032
- Table 148: Global Resorbable Polymers Market Volume K Tons Forecast, by Country 2019 & 2032
- Table 149: Brazil Resorbable Polymers Market Revenue (Million) Forecast, by Application 2019 & 2032
- Table 150: Brazil Resorbable Polymers Market Volume (K Tons) Forecast, by Application 2019 & 2032
- Table 151: Argentina Resorbable Polymers Market Revenue (Million) Forecast, by Application 2019 & 2032
- Table 152: Argentina Resorbable Polymers Market Volume (K Tons) Forecast, by Application 2019 & 2032
- Table 153: Rest of South America Resorbable Polymers Market Revenue (Million) Forecast, by Application 2019 & 2032
- Table 154: Rest of South America Resorbable Polymers Market Volume (K Tons) Forecast, by Application 2019 & 2032
- Table 155: Global Resorbable Polymers Market Revenue Million Forecast, by Material 2019 & 2032
- Table 156: Global Resorbable Polymers Market Volume K Tons Forecast, by Material 2019 & 2032
- Table 157: Global Resorbable Polymers Market Revenue Million Forecast, by Application 2019 & 2032
- Table 158: Global Resorbable Polymers Market Volume K Tons Forecast, by Application 2019 & 2032
- Table 159: Global Resorbable Polymers Market Revenue Million Forecast, by Country 2019 & 2032
- Table 160: Global Resorbable Polymers Market Volume K Tons Forecast, by Country 2019 & 2032
- Table 161: UAE Resorbable Polymers Market Revenue (Million) Forecast, by Application 2019 & 2032
- Table 162: UAE Resorbable Polymers Market Volume (K Tons) Forecast, by Application 2019 & 2032
- Table 163: Saudi Arabia Resorbable Polymers Market Revenue (Million) Forecast, by Application 2019 & 2032
- Table 164: Saudi Arabia Resorbable Polymers Market Volume (K Tons) Forecast, by Application 2019 & 2032
- Table 165: South Africa Resorbable Polymers Market Revenue (Million) Forecast, by Application 2019 & 2032
- Table 166: South Africa Resorbable Polymers Market Volume (K Tons) Forecast, by Application 2019 & 2032
- Table 167: Rest of Middle East & Africa Resorbable Polymers Market Revenue (Million) Forecast, by Application 2019 & 2032
- Table 168: Rest of Middle East & Africa Resorbable Polymers Market Volume (K Tons) Forecast, by Application 2019 & 2032
Frequently Asked Questions
1. What is the projected Compound Annual Growth Rate (CAGR) of the Resorbable Polymers Market?
The projected CAGR is approximately > 10.00%.
2. Which companies are prominent players in the Resorbable Polymers Market?
Key companies in the market include KLS Martin Group, Teknimed, Poly-Med Incorporated, Evonik Industries AG, Ashland, Biogeneral, Foster Corporation, CORBION.
3. What are the main segments of the Resorbable Polymers Market?
The market segments include Material, Application.
4. Can you provide details about the market size?
The market size is estimated to be USD XX Million as of 2022.
5. What are some drivers contributing to market growth?
Growing Demand from Medical Industry; Other Drivers.
6. What are the notable trends driving market growth?
Orthopedics to Dominate the Market.
7. Are there any restraints impacting market growth?
Other Restraints.
8. Can you provide examples of recent developments in the market?
In Jan 2021, Evonik announced the closing of the LACTEL Absorbable Polymers acquisition from DURECT Corporation.
9. What pricing options are available for accessing the report?
Pricing options include single-user, multi-user, and enterprise licenses priced at USD 4750, USD 5250, and USD 8750 respectively.
10. Is the market size provided in terms of value or volume?
The market size is provided in terms of value, measured in Million and volume, measured in K Tons.
11. Are there any specific market keywords associated with the report?
Yes, the market keyword associated with the report is "Resorbable Polymers Market," which aids in identifying and referencing the specific market segment covered.
12. How do I determine which pricing option suits my needs best?
The pricing options vary based on user requirements and access needs. Individual users may opt for single-user licenses, while businesses requiring broader access may choose multi-user or enterprise licenses for cost-effective access to the report.
13. Are there any additional resources or data provided in the Resorbable Polymers Market report?
While the report offers comprehensive insights, it's advisable to review the specific contents or supplementary materials provided to ascertain if additional resources or data are available.
14. How can I stay updated on further developments or reports in the Resorbable Polymers Market?
To stay informed about further developments, trends, and reports in the Resorbable Polymers Market, consider subscribing to industry newsletters, following relevant companies and organizations, or regularly checking reputable industry news sources and publications.
Methodology
Step 1 - Identification of Relevant Samples Size from Population Database


Step 2 - Approaches for Defining Global Market Size (Value, Volume* & Price*)

Note*: In applicable scenarios
Step 3 - Data Sources
Primary Research
- Web Analytics
- Survey Reports
- Research Institute
- Latest Research Reports
- Opinion Leaders
Secondary Research
- Annual Reports
- White Paper
- Latest Press Release
- Industry Association
- Paid Database
- Investor Presentations

Step 4 - Data Triangulation
Involves using different sources of information in order to increase the validity of a study
These sources are likely to be stakeholders in a program - participants, other researchers, program staff, other community members, and so on.
Then we put all data in single framework & apply various statistical tools to find out the dynamic on the market.
During the analysis stage, feedback from the stakeholder groups would be compared to determine areas of agreement as well as areas of divergence
