

Key Insights
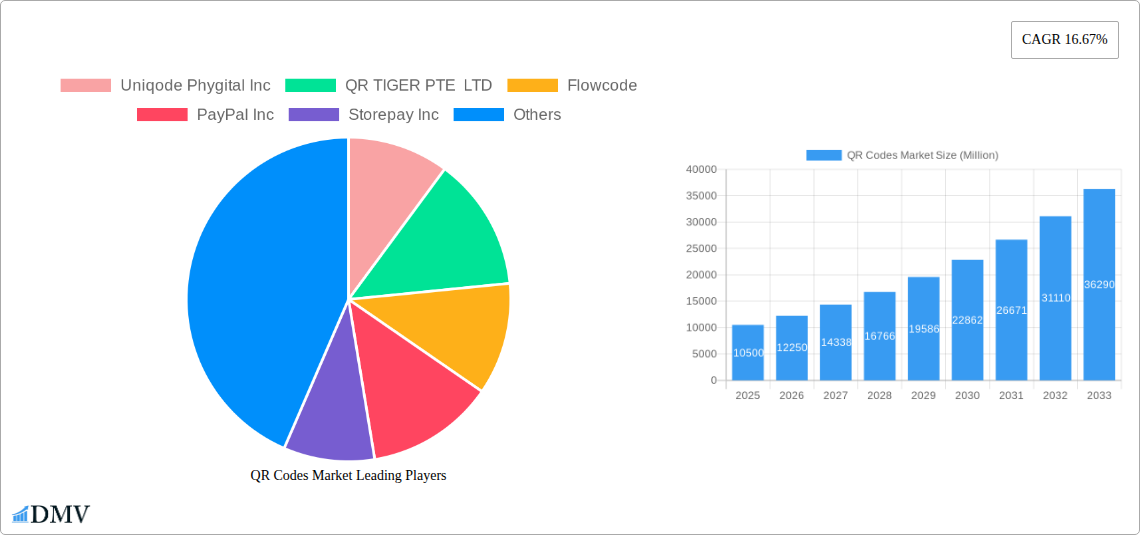
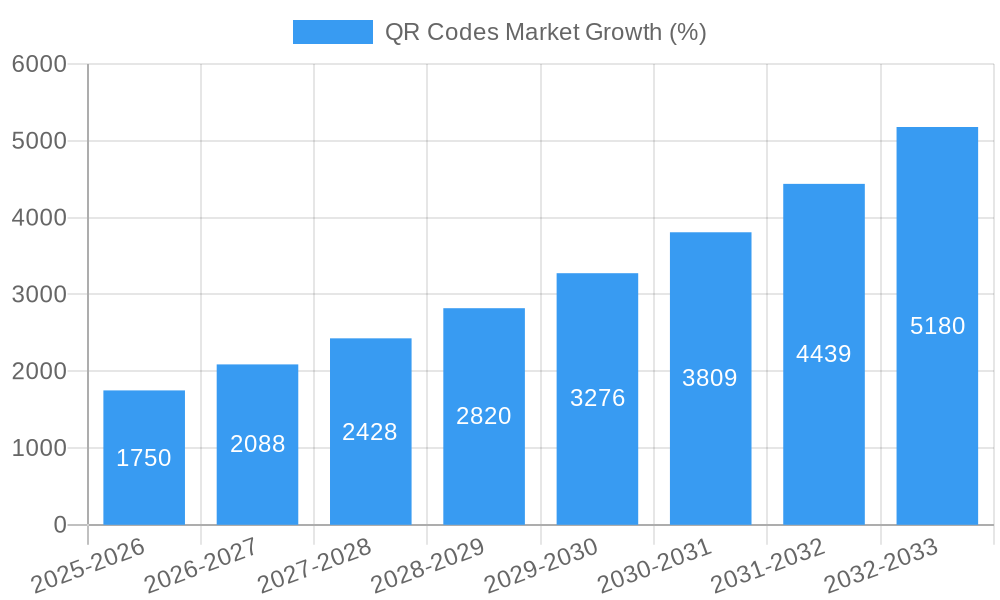
The QR code market is experiencing robust growth, projected to reach a market size of $10.5 billion in 2025 and maintain a Compound Annual Growth Rate (CAGR) of 16.67% from 2025 to 2033. This expansion is driven by several key factors. The increasing adoption of mobile payment systems globally fuels demand for QR codes as a convenient and secure payment method. Furthermore, the rise of contactless transactions, accelerated by the COVID-19 pandemic, has significantly boosted the use of QR codes for various applications beyond payments, including marketing campaigns, event ticketing, and product authentication. The seamless integration of QR codes with smartphones and readily available QR code generation tools contribute to their widespread accessibility and adoption across diverse industries. Technological advancements leading to dynamic and interactive QR codes with enhanced functionalities further expand the market's potential. Major players like PayPal, Square, and UnionPay, along with innovative startups like QR Tiger and Uniqode Phygital, are actively shaping the market landscape through strategic partnerships and technological innovation.
However, the market's growth is not without challenges. Data security concerns and the potential for QR code misuse remain significant restraints. The need for robust security measures and user education is crucial for maintaining consumer trust and wider adoption. Competition among providers is intense, requiring companies to differentiate their offerings through innovative features, user-friendly interfaces, and cost-effective solutions. Regulatory changes and varying levels of technological infrastructure across different regions also present hurdles to widespread market penetration. Despite these challenges, the continued evolution of QR code technology and its increasing integration into various business and personal applications point towards a positive outlook for the market's sustained growth in the coming years. Further penetration into emerging markets with growing smartphone usage will be key for future expansion.
QR Codes Market: A Comprehensive Report (2019-2033)
This insightful report provides a detailed analysis of the QR Codes Market, encompassing historical data (2019-2024), the current market landscape (2025), and a comprehensive forecast (2025-2033). It delves into market dynamics, technological advancements, competitive landscapes, and future growth opportunities, offering invaluable insights for stakeholders seeking to navigate this rapidly evolving sector. The report covers a market valued at xx Million in 2025, projected to reach xx Million by 2033, exhibiting a CAGR of xx%.
QR Codes Market Composition & Trends
This section evaluates the QR Codes Market's competitive intensity, innovation drivers, regulatory environment, substitute products, end-user profiles, and mergers & acquisitions (M&A) activity. The market exhibits a moderately concentrated structure, with key players commanding significant shares. Innovation is driven by advancements in mobile technology, increasing smartphone penetration, and the demand for seamless mobile payment solutions. Regulatory landscapes vary across regions, impacting market growth differentially. The primary substitute for QR codes remains traditional barcode technology, however, QR codes offer superior information capacity and functionality.
- Market Share Distribution (2025):
QR TIGER PTE LTD: xx%
PayPal Inc: xx%
Flowcode: xx%
Others: xx% - M&A Activity (2019-2024): A total of xx M&A deals were recorded, with a cumulative value of xx Million. These deals largely focused on expanding technological capabilities and market reach.
- End-User Profiles: The market caters to a diverse range of end-users, including businesses, consumers, and governments, across various sectors like retail, healthcare, and logistics.
QR Codes Market Industry Evolution
The QR Codes Market has witnessed phenomenal growth since 2019, driven by several factors including increasing smartphone adoption, advancements in mobile payment technologies, and the rise of contactless transactions. The market experienced a significant surge during the COVID-19 pandemic, as businesses and consumers increasingly sought contactless solutions. This trajectory is expected to continue with the integration of QR codes into diverse applications and across numerous industries. Technological advancements like dynamic QR codes, which can be updated after generation, are enhancing functionality and usage scenarios. Consumer demand for convenience, speed, and security is further driving market expansion.
- Growth Rates (2019-2024): The market witnessed an average annual growth rate of xx%.
- Adoption Metrics (2025): xx% of businesses utilize QR codes for at least one application, while xx% of consumers have actively scanned a QR code in the past year.
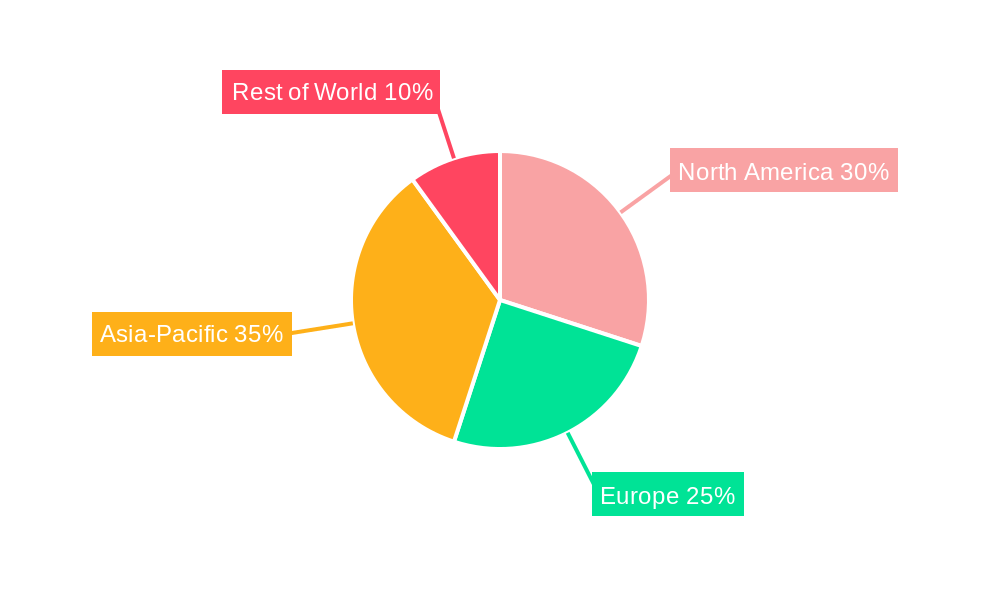
Leading Regions, Countries, or Segments in QR Codes Market
The Asia-Pacific region currently dominates the QR Codes Market, driven primarily by high smartphone penetration, a burgeoning e-commerce sector, and government initiatives promoting digital payments. China and India are leading contributors within this region.
- Key Drivers in Asia-Pacific:
- High smartphone penetration and internet connectivity.
- Extensive mobile payment infrastructure.
- Government support for digital transformation.
- Large and growing consumer base.
- Dominance Factors: The high adoption of mobile payments, coupled with government regulations encouraging digital transactions, is a major factor contributing to the region's dominance. The significant population base and its increasing disposable income also play a crucial role.
QR Codes Market Product Innovations
Recent innovations include dynamic QR codes capable of tracking scans, analytics dashboards providing insights into user engagement, and integration with CRM systems for personalized marketing campaigns. These features enhance the utility of QR codes beyond simple data transfer, transforming them into powerful marketing and engagement tools. The development of sophisticated QR code generators with user-friendly interfaces has also contributed to wider adoption.
Propelling Factors for QR Codes Market Growth
Several factors are driving the QR Codes Market's growth trajectory. The expansion of e-commerce, coupled with the rising demand for contactless transactions, is a major impetus. Technological advancements, such as the ability to embed QR codes in various media and dynamic QR code capabilities, provide new possibilities. Furthermore, government initiatives promoting digital payments across several countries are also bolstering market expansion.
Obstacles in the QR Codes Market
The QR Codes Market faces challenges such as concerns regarding data security and privacy, potential for misuse, and the need for robust infrastructure, particularly in developing countries. Competition from alternative technologies and the cost of implementation also pose some challenges to market growth. Furthermore, the need for clear guidelines and standardized protocols is essential for widespread and safe adoption.
Future Opportunities in QR Codes Market
Future opportunities lie in the integration of QR codes with augmented reality (AR) and virtual reality (VR) technologies, creating immersive and interactive user experiences. Expansion into new sectors like healthcare and logistics, and the development of advanced analytical capabilities associated with QR code usage will also unlock new avenues of growth.
Major Players in the QR Codes Market Ecosystem
- Uniqode Phygital Inc
- QR TIGER PTE LTD
- Flowcode
- PayPal Inc
- Storepay Inc
- UnionPay International Co Ltd
- Block Inc (Square)
- Nearex Technologies Pvt Ltd
- LINE Pay Corporation
- Revolut Technologies Inc
- Ecentric Payment Systems
- Clover Network LLC
Key Developments in QR Codes Market Industry
- July 2024: Bandhan Bank launched a payment solution using Bharat QR Code for its Current and Savings account customers, simplifying payments for self-employed individuals and providing instant payment notifications.
- June 2024: Flowcode unveiled a redesigned product for marketing and analytics teams at large companies, focusing on measuring and maximizing offline conversions through personalized, QR-enabled user journeys.
Strategic QR Codes Market Forecast
The QR Codes Market is poised for sustained growth, fueled by ongoing technological advancements, increasing digitalization, and the expanding adoption of contactless transactions across diverse sectors. The integration of QR codes into new applications and platforms presents significant opportunities for market expansion. The market's trajectory indicates strong potential for continued growth and widespread adoption in the coming years.
QR Codes Market Segmentation
-
1. Type
- 1.1. Website QR Code
- 1.2. Menu QR Code
- 1.3. File Download QR Code
- 1.4. Social Media QR Code
- 1.5. App Store
- 1.6. Others
-
2. Format
- 2.1. Static QR Code
- 2.2. Dynamic QR Code
-
3. End-User Application
- 3.1. Marketing and advertising
- 3.2. Payments and Transactions
- 3.3. Information Sharing
- 3.4. Customer engagement
- 3.5. Others
QR Codes Market Segmentation By Geography
- 1. North America
- 2. Europe
- 3. Asia
- 4. Australia and New Zealand
- 5. Latin America
- 6. Middle East and Africa
QR Codes Market REPORT HIGHLIGHTS
| Aspects | Details |
|---|---|
| Study Period | 2019-2033 |
| Base Year | 2024 |
| Estimated Year | 2025 |
| Forecast Period | 2025-2033 |
| Historical Period | 2019-2024 |
| Growth Rate | CAGR of 16.67% from 2019-2033 |
| Segmentation |
|
Table of Contents
- 1. Introduction
- 1.1. Research Scope
- 1.2. Market Segmentation
- 1.3. Research Methodology
- 1.4. Definitions and Assumptions
- 2. Executive Summary
- 2.1. Introduction
- 3. Market Dynamics
- 3.1. Introduction
- 3.2. Market Drivers
- 3.2.1. Increased Smartphone Penetration; Growing Demand for Contactless Solutions; Increasing need for Security and Fraud Prevention
- 3.3. Market Restrains
- 3.3.1. Increased Smartphone Penetration; Growing Demand for Contactless Solutions; Increasing need for Security and Fraud Prevention
- 3.4. Market Trends
- 3.4.1. The Payments and Transactions Segment is Anticipated to Witness a Significant Growth
- 4. Market Factor Analysis
- 4.1. Porters Five Forces
- 4.2. Supply/Value Chain
- 4.3. PESTEL analysis
- 4.4. Market Entropy
- 4.5. Patent/Trademark Analysis
- 5. Global QR Codes Market Analysis, Insights and Forecast, 2019-2031
- 5.1. Market Analysis, Insights and Forecast - by Type
- 5.1.1. Website QR Code
- 5.1.2. Menu QR Code
- 5.1.3. File Download QR Code
- 5.1.4. Social Media QR Code
- 5.1.5. App Store
- 5.1.6. Others
- 5.2. Market Analysis, Insights and Forecast - by Format
- 5.2.1. Static QR Code
- 5.2.2. Dynamic QR Code
- 5.3. Market Analysis, Insights and Forecast - by End-User Application
- 5.3.1. Marketing and advertising
- 5.3.2. Payments and Transactions
- 5.3.3. Information Sharing
- 5.3.4. Customer engagement
- 5.3.5. Others
- 5.4. Market Analysis, Insights and Forecast - by Region
- 5.4.1. North America
- 5.4.2. Europe
- 5.4.3. Asia
- 5.4.4. Australia and New Zealand
- 5.4.5. Latin America
- 5.4.6. Middle East and Africa
- 5.1. Market Analysis, Insights and Forecast - by Type
- 6. North America QR Codes Market Analysis, Insights and Forecast, 2019-2031
- 6.1. Market Analysis, Insights and Forecast - by Type
- 6.1.1. Website QR Code
- 6.1.2. Menu QR Code
- 6.1.3. File Download QR Code
- 6.1.4. Social Media QR Code
- 6.1.5. App Store
- 6.1.6. Others
- 6.2. Market Analysis, Insights and Forecast - by Format
- 6.2.1. Static QR Code
- 6.2.2. Dynamic QR Code
- 6.3. Market Analysis, Insights and Forecast - by End-User Application
- 6.3.1. Marketing and advertising
- 6.3.2. Payments and Transactions
- 6.3.3. Information Sharing
- 6.3.4. Customer engagement
- 6.3.5. Others
- 6.1. Market Analysis, Insights and Forecast - by Type
- 7. Europe QR Codes Market Analysis, Insights and Forecast, 2019-2031
- 7.1. Market Analysis, Insights and Forecast - by Type
- 7.1.1. Website QR Code
- 7.1.2. Menu QR Code
- 7.1.3. File Download QR Code
- 7.1.4. Social Media QR Code
- 7.1.5. App Store
- 7.1.6. Others
- 7.2. Market Analysis, Insights and Forecast - by Format
- 7.2.1. Static QR Code
- 7.2.2. Dynamic QR Code
- 7.3. Market Analysis, Insights and Forecast - by End-User Application
- 7.3.1. Marketing and advertising
- 7.3.2. Payments and Transactions
- 7.3.3. Information Sharing
- 7.3.4. Customer engagement
- 7.3.5. Others
- 7.1. Market Analysis, Insights and Forecast - by Type
- 8. Asia QR Codes Market Analysis, Insights and Forecast, 2019-2031
- 8.1. Market Analysis, Insights and Forecast - by Type
- 8.1.1. Website QR Code
- 8.1.2. Menu QR Code
- 8.1.3. File Download QR Code
- 8.1.4. Social Media QR Code
- 8.1.5. App Store
- 8.1.6. Others
- 8.2. Market Analysis, Insights and Forecast - by Format
- 8.2.1. Static QR Code
- 8.2.2. Dynamic QR Code
- 8.3. Market Analysis, Insights and Forecast - by End-User Application
- 8.3.1. Marketing and advertising
- 8.3.2. Payments and Transactions
- 8.3.3. Information Sharing
- 8.3.4. Customer engagement
- 8.3.5. Others
- 8.1. Market Analysis, Insights and Forecast - by Type
- 9. Australia and New Zealand QR Codes Market Analysis, Insights and Forecast, 2019-2031
- 9.1. Market Analysis, Insights and Forecast - by Type
- 9.1.1. Website QR Code
- 9.1.2. Menu QR Code
- 9.1.3. File Download QR Code
- 9.1.4. Social Media QR Code
- 9.1.5. App Store
- 9.1.6. Others
- 9.2. Market Analysis, Insights and Forecast - by Format
- 9.2.1. Static QR Code
- 9.2.2. Dynamic QR Code
- 9.3. Market Analysis, Insights and Forecast - by End-User Application
- 9.3.1. Marketing and advertising
- 9.3.2. Payments and Transactions
- 9.3.3. Information Sharing
- 9.3.4. Customer engagement
- 9.3.5. Others
- 9.1. Market Analysis, Insights and Forecast - by Type
- 10. Latin America QR Codes Market Analysis, Insights and Forecast, 2019-2031
- 10.1. Market Analysis, Insights and Forecast - by Type
- 10.1.1. Website QR Code
- 10.1.2. Menu QR Code
- 10.1.3. File Download QR Code
- 10.1.4. Social Media QR Code
- 10.1.5. App Store
- 10.1.6. Others
- 10.2. Market Analysis, Insights and Forecast - by Format
- 10.2.1. Static QR Code
- 10.2.2. Dynamic QR Code
- 10.3. Market Analysis, Insights and Forecast - by End-User Application
- 10.3.1. Marketing and advertising
- 10.3.2. Payments and Transactions
- 10.3.3. Information Sharing
- 10.3.4. Customer engagement
- 10.3.5. Others
- 10.1. Market Analysis, Insights and Forecast - by Type
- 11. Middle East and Africa QR Codes Market Analysis, Insights and Forecast, 2019-2031
- 11.1. Market Analysis, Insights and Forecast - by Type
- 11.1.1. Website QR Code
- 11.1.2. Menu QR Code
- 11.1.3. File Download QR Code
- 11.1.4. Social Media QR Code
- 11.1.5. App Store
- 11.1.6. Others
- 11.2. Market Analysis, Insights and Forecast - by Format
- 11.2.1. Static QR Code
- 11.2.2. Dynamic QR Code
- 11.3. Market Analysis, Insights and Forecast - by End-User Application
- 11.3.1. Marketing and advertising
- 11.3.2. Payments and Transactions
- 11.3.3. Information Sharing
- 11.3.4. Customer engagement
- 11.3.5. Others
- 11.1. Market Analysis, Insights and Forecast - by Type
- 12. Competitive Analysis
- 12.1. Global Market Share Analysis 2024
- 12.2. Company Profiles
- 12.2.1 Uniqode Phygital Inc
- 12.2.1.1. Overview
- 12.2.1.2. Products
- 12.2.1.3. SWOT Analysis
- 12.2.1.4. Recent Developments
- 12.2.1.5. Financials (Based on Availability)
- 12.2.2 QR TIGER PTE LTD
- 12.2.2.1. Overview
- 12.2.2.2. Products
- 12.2.2.3. SWOT Analysis
- 12.2.2.4. Recent Developments
- 12.2.2.5. Financials (Based on Availability)
- 12.2.3 Flowcode
- 12.2.3.1. Overview
- 12.2.3.2. Products
- 12.2.3.3. SWOT Analysis
- 12.2.3.4. Recent Developments
- 12.2.3.5. Financials (Based on Availability)
- 12.2.4 PayPal Inc
- 12.2.4.1. Overview
- 12.2.4.2. Products
- 12.2.4.3. SWOT Analysis
- 12.2.4.4. Recent Developments
- 12.2.4.5. Financials (Based on Availability)
- 12.2.5 Storepay Inc
- 12.2.5.1. Overview
- 12.2.5.2. Products
- 12.2.5.3. SWOT Analysis
- 12.2.5.4. Recent Developments
- 12.2.5.5. Financials (Based on Availability)
- 12.2.6 UnionPay International Co Ltd
- 12.2.6.1. Overview
- 12.2.6.2. Products
- 12.2.6.3. SWOT Analysis
- 12.2.6.4. Recent Developments
- 12.2.6.5. Financials (Based on Availability)
- 12.2.7 Block Inc (Square)
- 12.2.7.1. Overview
- 12.2.7.2. Products
- 12.2.7.3. SWOT Analysis
- 12.2.7.4. Recent Developments
- 12.2.7.5. Financials (Based on Availability)
- 12.2.8 Nearex Technologies Pvt Ltd
- 12.2.8.1. Overview
- 12.2.8.2. Products
- 12.2.8.3. SWOT Analysis
- 12.2.8.4. Recent Developments
- 12.2.8.5. Financials (Based on Availability)
- 12.2.9 LINE Pay Corporation
- 12.2.9.1. Overview
- 12.2.9.2. Products
- 12.2.9.3. SWOT Analysis
- 12.2.9.4. Recent Developments
- 12.2.9.5. Financials (Based on Availability)
- 12.2.10 Revolut Technologies Inc
- 12.2.10.1. Overview
- 12.2.10.2. Products
- 12.2.10.3. SWOT Analysis
- 12.2.10.4. Recent Developments
- 12.2.10.5. Financials (Based on Availability)
- 12.2.11 Ecentric Payment Systems
- 12.2.11.1. Overview
- 12.2.11.2. Products
- 12.2.11.3. SWOT Analysis
- 12.2.11.4. Recent Developments
- 12.2.11.5. Financials (Based on Availability)
- 12.2.12 Clover Network LLC*List Not Exhaustive
- 12.2.12.1. Overview
- 12.2.12.2. Products
- 12.2.12.3. SWOT Analysis
- 12.2.12.4. Recent Developments
- 12.2.12.5. Financials (Based on Availability)
- 12.2.1 Uniqode Phygital Inc
List of Figures
- Figure 1: Global QR Codes Market Revenue Breakdown (Million, %) by Region 2024 & 2032
- Figure 2: Global QR Codes Market Volume Breakdown (Billion, %) by Region 2024 & 2032
- Figure 3: North America QR Codes Market Revenue (Million), by Type 2024 & 2032
- Figure 4: North America QR Codes Market Volume (Billion), by Type 2024 & 2032
- Figure 5: North America QR Codes Market Revenue Share (%), by Type 2024 & 2032
- Figure 6: North America QR Codes Market Volume Share (%), by Type 2024 & 2032
- Figure 7: North America QR Codes Market Revenue (Million), by Format 2024 & 2032
- Figure 8: North America QR Codes Market Volume (Billion), by Format 2024 & 2032
- Figure 9: North America QR Codes Market Revenue Share (%), by Format 2024 & 2032
- Figure 10: North America QR Codes Market Volume Share (%), by Format 2024 & 2032
- Figure 11: North America QR Codes Market Revenue (Million), by End-User Application 2024 & 2032
- Figure 12: North America QR Codes Market Volume (Billion), by End-User Application 2024 & 2032
- Figure 13: North America QR Codes Market Revenue Share (%), by End-User Application 2024 & 2032
- Figure 14: North America QR Codes Market Volume Share (%), by End-User Application 2024 & 2032
- Figure 15: North America QR Codes Market Revenue (Million), by Country 2024 & 2032
- Figure 16: North America QR Codes Market Volume (Billion), by Country 2024 & 2032
- Figure 17: North America QR Codes Market Revenue Share (%), by Country 2024 & 2032
- Figure 18: North America QR Codes Market Volume Share (%), by Country 2024 & 2032
- Figure 19: Europe QR Codes Market Revenue (Million), by Type 2024 & 2032
- Figure 20: Europe QR Codes Market Volume (Billion), by Type 2024 & 2032
- Figure 21: Europe QR Codes Market Revenue Share (%), by Type 2024 & 2032
- Figure 22: Europe QR Codes Market Volume Share (%), by Type 2024 & 2032
- Figure 23: Europe QR Codes Market Revenue (Million), by Format 2024 & 2032
- Figure 24: Europe QR Codes Market Volume (Billion), by Format 2024 & 2032
- Figure 25: Europe QR Codes Market Revenue Share (%), by Format 2024 & 2032
- Figure 26: Europe QR Codes Market Volume Share (%), by Format 2024 & 2032
- Figure 27: Europe QR Codes Market Revenue (Million), by End-User Application 2024 & 2032
- Figure 28: Europe QR Codes Market Volume (Billion), by End-User Application 2024 & 2032
- Figure 29: Europe QR Codes Market Revenue Share (%), by End-User Application 2024 & 2032
- Figure 30: Europe QR Codes Market Volume Share (%), by End-User Application 2024 & 2032
- Figure 31: Europe QR Codes Market Revenue (Million), by Country 2024 & 2032
- Figure 32: Europe QR Codes Market Volume (Billion), by Country 2024 & 2032
- Figure 33: Europe QR Codes Market Revenue Share (%), by Country 2024 & 2032
- Figure 34: Europe QR Codes Market Volume Share (%), by Country 2024 & 2032
- Figure 35: Asia QR Codes Market Revenue (Million), by Type 2024 & 2032
- Figure 36: Asia QR Codes Market Volume (Billion), by Type 2024 & 2032
- Figure 37: Asia QR Codes Market Revenue Share (%), by Type 2024 & 2032
- Figure 38: Asia QR Codes Market Volume Share (%), by Type 2024 & 2032
- Figure 39: Asia QR Codes Market Revenue (Million), by Format 2024 & 2032
- Figure 40: Asia QR Codes Market Volume (Billion), by Format 2024 & 2032
- Figure 41: Asia QR Codes Market Revenue Share (%), by Format 2024 & 2032
- Figure 42: Asia QR Codes Market Volume Share (%), by Format 2024 & 2032
- Figure 43: Asia QR Codes Market Revenue (Million), by End-User Application 2024 & 2032
- Figure 44: Asia QR Codes Market Volume (Billion), by End-User Application 2024 & 2032
- Figure 45: Asia QR Codes Market Revenue Share (%), by End-User Application 2024 & 2032
- Figure 46: Asia QR Codes Market Volume Share (%), by End-User Application 2024 & 2032
- Figure 47: Asia QR Codes Market Revenue (Million), by Country 2024 & 2032
- Figure 48: Asia QR Codes Market Volume (Billion), by Country 2024 & 2032
- Figure 49: Asia QR Codes Market Revenue Share (%), by Country 2024 & 2032
- Figure 50: Asia QR Codes Market Volume Share (%), by Country 2024 & 2032
- Figure 51: Australia and New Zealand QR Codes Market Revenue (Million), by Type 2024 & 2032
- Figure 52: Australia and New Zealand QR Codes Market Volume (Billion), by Type 2024 & 2032
- Figure 53: Australia and New Zealand QR Codes Market Revenue Share (%), by Type 2024 & 2032
- Figure 54: Australia and New Zealand QR Codes Market Volume Share (%), by Type 2024 & 2032
- Figure 55: Australia and New Zealand QR Codes Market Revenue (Million), by Format 2024 & 2032
- Figure 56: Australia and New Zealand QR Codes Market Volume (Billion), by Format 2024 & 2032
- Figure 57: Australia and New Zealand QR Codes Market Revenue Share (%), by Format 2024 & 2032
- Figure 58: Australia and New Zealand QR Codes Market Volume Share (%), by Format 2024 & 2032
- Figure 59: Australia and New Zealand QR Codes Market Revenue (Million), by End-User Application 2024 & 2032
- Figure 60: Australia and New Zealand QR Codes Market Volume (Billion), by End-User Application 2024 & 2032
- Figure 61: Australia and New Zealand QR Codes Market Revenue Share (%), by End-User Application 2024 & 2032
- Figure 62: Australia and New Zealand QR Codes Market Volume Share (%), by End-User Application 2024 & 2032
- Figure 63: Australia and New Zealand QR Codes Market Revenue (Million), by Country 2024 & 2032
- Figure 64: Australia and New Zealand QR Codes Market Volume (Billion), by Country 2024 & 2032
- Figure 65: Australia and New Zealand QR Codes Market Revenue Share (%), by Country 2024 & 2032
- Figure 66: Australia and New Zealand QR Codes Market Volume Share (%), by Country 2024 & 2032
- Figure 67: Latin America QR Codes Market Revenue (Million), by Type 2024 & 2032
- Figure 68: Latin America QR Codes Market Volume (Billion), by Type 2024 & 2032
- Figure 69: Latin America QR Codes Market Revenue Share (%), by Type 2024 & 2032
- Figure 70: Latin America QR Codes Market Volume Share (%), by Type 2024 & 2032
- Figure 71: Latin America QR Codes Market Revenue (Million), by Format 2024 & 2032
- Figure 72: Latin America QR Codes Market Volume (Billion), by Format 2024 & 2032
- Figure 73: Latin America QR Codes Market Revenue Share (%), by Format 2024 & 2032
- Figure 74: Latin America QR Codes Market Volume Share (%), by Format 2024 & 2032
- Figure 75: Latin America QR Codes Market Revenue (Million), by End-User Application 2024 & 2032
- Figure 76: Latin America QR Codes Market Volume (Billion), by End-User Application 2024 & 2032
- Figure 77: Latin America QR Codes Market Revenue Share (%), by End-User Application 2024 & 2032
- Figure 78: Latin America QR Codes Market Volume Share (%), by End-User Application 2024 & 2032
- Figure 79: Latin America QR Codes Market Revenue (Million), by Country 2024 & 2032
- Figure 80: Latin America QR Codes Market Volume (Billion), by Country 2024 & 2032
- Figure 81: Latin America QR Codes Market Revenue Share (%), by Country 2024 & 2032
- Figure 82: Latin America QR Codes Market Volume Share (%), by Country 2024 & 2032
- Figure 83: Middle East and Africa QR Codes Market Revenue (Million), by Type 2024 & 2032
- Figure 84: Middle East and Africa QR Codes Market Volume (Billion), by Type 2024 & 2032
- Figure 85: Middle East and Africa QR Codes Market Revenue Share (%), by Type 2024 & 2032
- Figure 86: Middle East and Africa QR Codes Market Volume Share (%), by Type 2024 & 2032
- Figure 87: Middle East and Africa QR Codes Market Revenue (Million), by Format 2024 & 2032
- Figure 88: Middle East and Africa QR Codes Market Volume (Billion), by Format 2024 & 2032
- Figure 89: Middle East and Africa QR Codes Market Revenue Share (%), by Format 2024 & 2032
- Figure 90: Middle East and Africa QR Codes Market Volume Share (%), by Format 2024 & 2032
- Figure 91: Middle East and Africa QR Codes Market Revenue (Million), by End-User Application 2024 & 2032
- Figure 92: Middle East and Africa QR Codes Market Volume (Billion), by End-User Application 2024 & 2032
- Figure 93: Middle East and Africa QR Codes Market Revenue Share (%), by End-User Application 2024 & 2032
- Figure 94: Middle East and Africa QR Codes Market Volume Share (%), by End-User Application 2024 & 2032
- Figure 95: Middle East and Africa QR Codes Market Revenue (Million), by Country 2024 & 2032
- Figure 96: Middle East and Africa QR Codes Market Volume (Billion), by Country 2024 & 2032
- Figure 97: Middle East and Africa QR Codes Market Revenue Share (%), by Country 2024 & 2032
- Figure 98: Middle East and Africa QR Codes Market Volume Share (%), by Country 2024 & 2032
List of Tables
- Table 1: Global QR Codes Market Revenue Million Forecast, by Region 2019 & 2032
- Table 2: Global QR Codes Market Volume Billion Forecast, by Region 2019 & 2032
- Table 3: Global QR Codes Market Revenue Million Forecast, by Type 2019 & 2032
- Table 4: Global QR Codes Market Volume Billion Forecast, by Type 2019 & 2032
- Table 5: Global QR Codes Market Revenue Million Forecast, by Format 2019 & 2032
- Table 6: Global QR Codes Market Volume Billion Forecast, by Format 2019 & 2032
- Table 7: Global QR Codes Market Revenue Million Forecast, by End-User Application 2019 & 2032
- Table 8: Global QR Codes Market Volume Billion Forecast, by End-User Application 2019 & 2032
- Table 9: Global QR Codes Market Revenue Million Forecast, by Region 2019 & 2032
- Table 10: Global QR Codes Market Volume Billion Forecast, by Region 2019 & 2032
- Table 11: Global QR Codes Market Revenue Million Forecast, by Type 2019 & 2032
- Table 12: Global QR Codes Market Volume Billion Forecast, by Type 2019 & 2032
- Table 13: Global QR Codes Market Revenue Million Forecast, by Format 2019 & 2032
- Table 14: Global QR Codes Market Volume Billion Forecast, by Format 2019 & 2032
- Table 15: Global QR Codes Market Revenue Million Forecast, by End-User Application 2019 & 2032
- Table 16: Global QR Codes Market Volume Billion Forecast, by End-User Application 2019 & 2032
- Table 17: Global QR Codes Market Revenue Million Forecast, by Country 2019 & 2032
- Table 18: Global QR Codes Market Volume Billion Forecast, by Country 2019 & 2032
- Table 19: Global QR Codes Market Revenue Million Forecast, by Type 2019 & 2032
- Table 20: Global QR Codes Market Volume Billion Forecast, by Type 2019 & 2032
- Table 21: Global QR Codes Market Revenue Million Forecast, by Format 2019 & 2032
- Table 22: Global QR Codes Market Volume Billion Forecast, by Format 2019 & 2032
- Table 23: Global QR Codes Market Revenue Million Forecast, by End-User Application 2019 & 2032
- Table 24: Global QR Codes Market Volume Billion Forecast, by End-User Application 2019 & 2032
- Table 25: Global QR Codes Market Revenue Million Forecast, by Country 2019 & 2032
- Table 26: Global QR Codes Market Volume Billion Forecast, by Country 2019 & 2032
- Table 27: Global QR Codes Market Revenue Million Forecast, by Type 2019 & 2032
- Table 28: Global QR Codes Market Volume Billion Forecast, by Type 2019 & 2032
- Table 29: Global QR Codes Market Revenue Million Forecast, by Format 2019 & 2032
- Table 30: Global QR Codes Market Volume Billion Forecast, by Format 2019 & 2032
- Table 31: Global QR Codes Market Revenue Million Forecast, by End-User Application 2019 & 2032
- Table 32: Global QR Codes Market Volume Billion Forecast, by End-User Application 2019 & 2032
- Table 33: Global QR Codes Market Revenue Million Forecast, by Country 2019 & 2032
- Table 34: Global QR Codes Market Volume Billion Forecast, by Country 2019 & 2032
- Table 35: Global QR Codes Market Revenue Million Forecast, by Type 2019 & 2032
- Table 36: Global QR Codes Market Volume Billion Forecast, by Type 2019 & 2032
- Table 37: Global QR Codes Market Revenue Million Forecast, by Format 2019 & 2032
- Table 38: Global QR Codes Market Volume Billion Forecast, by Format 2019 & 2032
- Table 39: Global QR Codes Market Revenue Million Forecast, by End-User Application 2019 & 2032
- Table 40: Global QR Codes Market Volume Billion Forecast, by End-User Application 2019 & 2032
- Table 41: Global QR Codes Market Revenue Million Forecast, by Country 2019 & 2032
- Table 42: Global QR Codes Market Volume Billion Forecast, by Country 2019 & 2032
- Table 43: Global QR Codes Market Revenue Million Forecast, by Type 2019 & 2032
- Table 44: Global QR Codes Market Volume Billion Forecast, by Type 2019 & 2032
- Table 45: Global QR Codes Market Revenue Million Forecast, by Format 2019 & 2032
- Table 46: Global QR Codes Market Volume Billion Forecast, by Format 2019 & 2032
- Table 47: Global QR Codes Market Revenue Million Forecast, by End-User Application 2019 & 2032
- Table 48: Global QR Codes Market Volume Billion Forecast, by End-User Application 2019 & 2032
- Table 49: Global QR Codes Market Revenue Million Forecast, by Country 2019 & 2032
- Table 50: Global QR Codes Market Volume Billion Forecast, by Country 2019 & 2032
- Table 51: Global QR Codes Market Revenue Million Forecast, by Type 2019 & 2032
- Table 52: Global QR Codes Market Volume Billion Forecast, by Type 2019 & 2032
- Table 53: Global QR Codes Market Revenue Million Forecast, by Format 2019 & 2032
- Table 54: Global QR Codes Market Volume Billion Forecast, by Format 2019 & 2032
- Table 55: Global QR Codes Market Revenue Million Forecast, by End-User Application 2019 & 2032
- Table 56: Global QR Codes Market Volume Billion Forecast, by End-User Application 2019 & 2032
- Table 57: Global QR Codes Market Revenue Million Forecast, by Country 2019 & 2032
- Table 58: Global QR Codes Market Volume Billion Forecast, by Country 2019 & 2032
Frequently Asked Questions
1. What is the projected Compound Annual Growth Rate (CAGR) of the QR Codes Market?
The projected CAGR is approximately 16.67%.
2. Which companies are prominent players in the QR Codes Market?
Key companies in the market include Uniqode Phygital Inc, QR TIGER PTE LTD, Flowcode, PayPal Inc, Storepay Inc, UnionPay International Co Ltd, Block Inc (Square), Nearex Technologies Pvt Ltd, LINE Pay Corporation, Revolut Technologies Inc, Ecentric Payment Systems, Clover Network LLC*List Not Exhaustive.
3. What are the main segments of the QR Codes Market?
The market segments include Type, Format, End-User Application.
4. Can you provide details about the market size?
The market size is estimated to be USD 10.5 Million as of 2022.
5. What are some drivers contributing to market growth?
Increased Smartphone Penetration; Growing Demand for Contactless Solutions; Increasing need for Security and Fraud Prevention.
6. What are the notable trends driving market growth?
The Payments and Transactions Segment is Anticipated to Witness a Significant Growth.
7. Are there any restraints impacting market growth?
Increased Smartphone Penetration; Growing Demand for Contactless Solutions; Increasing need for Security and Fraud Prevention.
8. Can you provide examples of recent developments in the market?
July 2024: Bandhan Bank launched its latest payment solution through the Bharat QR Code for its Current account and Savings account customers. The bank claimed that the solution will simplify how these self-employed segment customers make payments at any merchant outlet. An instant notification will also be received on every payment through a small speaker.June 2024: Flowcode, a marketing technology platform, unveiled a reimagined product designed for marketing and analytics teams at F1000 companies focused on measuring and maximizing offline conversions. Flowcode integrates seamlessly with data feeds, such as product catalogs, MLS listings, and more, to automate the creation of personalized, QR-enabled user journeys. This empowers brands to deliver unique, tailored consumer experiences, significantly increasing conversion rates.
9. What pricing options are available for accessing the report?
Pricing options include single-user, multi-user, and enterprise licenses priced at USD 4750, USD 5250, and USD 8750 respectively.
10. Is the market size provided in terms of value or volume?
The market size is provided in terms of value, measured in Million and volume, measured in Billion.
11. Are there any specific market keywords associated with the report?
Yes, the market keyword associated with the report is "QR Codes Market," which aids in identifying and referencing the specific market segment covered.
12. How do I determine which pricing option suits my needs best?
The pricing options vary based on user requirements and access needs. Individual users may opt for single-user licenses, while businesses requiring broader access may choose multi-user or enterprise licenses for cost-effective access to the report.
13. Are there any additional resources or data provided in the QR Codes Market report?
While the report offers comprehensive insights, it's advisable to review the specific contents or supplementary materials provided to ascertain if additional resources or data are available.
14. How can I stay updated on further developments or reports in the QR Codes Market?
To stay informed about further developments, trends, and reports in the QR Codes Market, consider subscribing to industry newsletters, following relevant companies and organizations, or regularly checking reputable industry news sources and publications.
Methodology
Step 1 - Identification of Relevant Samples Size from Population Database


Step 2 - Approaches for Defining Global Market Size (Value, Volume* & Price*)

Note*: In applicable scenarios
Step 3 - Data Sources
Primary Research
- Web Analytics
- Survey Reports
- Research Institute
- Latest Research Reports
- Opinion Leaders
Secondary Research
- Annual Reports
- White Paper
- Latest Press Release
- Industry Association
- Paid Database
- Investor Presentations

Step 4 - Data Triangulation
Involves using different sources of information in order to increase the validity of a study
These sources are likely to be stakeholders in a program - participants, other researchers, program staff, other community members, and so on.
Then we put all data in single framework & apply various statistical tools to find out the dynamic on the market.
During the analysis stage, feedback from the stakeholder groups would be compared to determine areas of agreement as well as areas of divergence
