

Key Insights
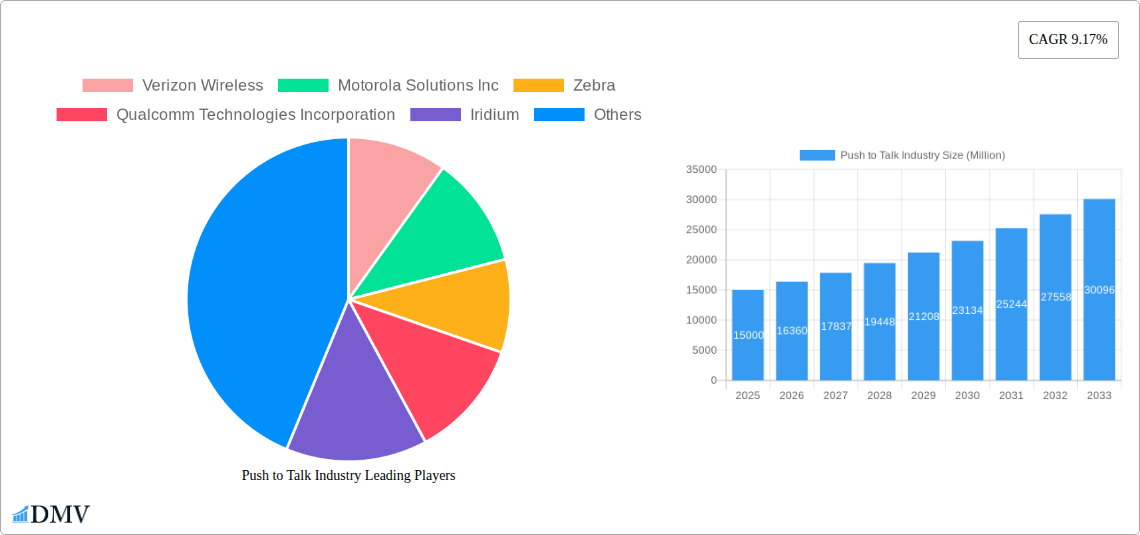
The Push-to-Talk (PTT) industry is experiencing robust growth, driven by increasing demand for instant communication across various sectors. A compound annual growth rate (CAGR) of 9.17% from 2019 to 2024 indicates a significant upward trajectory, projected to continue into the forecast period (2025-2033). This expansion is fueled by several key factors. The rising adoption of PTT solutions in public safety and government sectors, where immediate communication is critical, is a major driver. Furthermore, the increasing integration of PTT capabilities into smartphones and other mobile devices is broadening the market's reach into commercial applications, such as field service management, logistics, and transportation. Technological advancements, like the integration of LTE and 5G networks offering improved coverage and reliability, are also contributing to this growth. While the industry faces some restraints like the high initial investment costs for infrastructure and the potential for network congestion, the overall market outlook remains positive. The segmentation by component (hardware, solutions, services), network type (LMR, cellular), and vertical (public safety, government and defense, commercial) provides a granular view for targeted market strategies. The leading players, including Verizon Wireless, Motorola Solutions, and others, are constantly innovating to enhance their offerings and capture market share. Given the diverse geographic distribution, North America and Asia Pacific are expected to remain key regional markets, driven by technological advancements and high adoption rates within these regions. Future growth will be significantly impacted by ongoing 5G deployment and further integration with existing communication platforms.
The strategic focus for companies in this market will center on developing robust and reliable PTT solutions that cater to specific industry requirements. This includes providing secure, scalable, and cost-effective solutions, focusing on integration with existing workflows, and leveraging emerging technologies like AI for enhanced functionality and improved situational awareness. Partnerships and collaborations within the ecosystem will play a crucial role in expanding market penetration and reaching new customer segments. The continued evolution of network technologies and the growth of IoT (Internet of Things) will present significant opportunities for growth and innovation within the PTT industry throughout the forecast period. The market's future success hinges on delivering solutions that are intuitive, reliable, and seamlessly integrated into the day-to-day operations of its diverse user base.
Push to Talk (PTT) Industry Market Report: 2019-2033
This comprehensive report provides an in-depth analysis of the global Push to Talk (PTT) industry, projecting a market valuation exceeding $XX Million by 2033. The report covers the historical period (2019-2024), the base year (2025), and forecasts from 2025 to 2033, offering invaluable insights for stakeholders across the value chain. Key players like Verizon Wireless, Motorola Solutions Inc, and Qualcomm Technologies Incorporation are profiled, alongside an examination of market segments, technological advancements, and emerging trends shaping this dynamic sector.
Push to Talk Industry Market Composition & Trends
This section evaluates the competitive landscape, technological innovation drivers, regulatory frameworks, substitute technologies, end-user demographics, and mergers & acquisitions (M&A) activity within the $XX Million PTT market. Market concentration is analyzed, revealing the market share distribution among key players. For example, Motorola Solutions and Verizon Wireless likely hold significant shares. M&A activity is assessed, with estimated deal values totaling $XX Million over the study period. Innovation drivers such as the integration of advanced cellular technologies (5G, LTE) and the rise of software-defined radios are explored. The impact of regulatory changes on market access and interoperability is also detailed. Substitute products, such as messaging apps, are compared in terms of functionality and market penetration. Finally, evolving end-user profiles and preferences across different verticals (Public Safety, Government & Defense, Commercial) are thoroughly examined.
- Market Share Distribution (2024): Motorola Solutions Inc (XX%), Verizon Wireless (XX%), Others (XX%)
- Estimated M&A Deal Value (2019-2024): $XX Million
- Key Innovation Catalysts: 5G integration, Software-Defined Radios, AI-powered features
Push to Talk Industry Industry Evolution
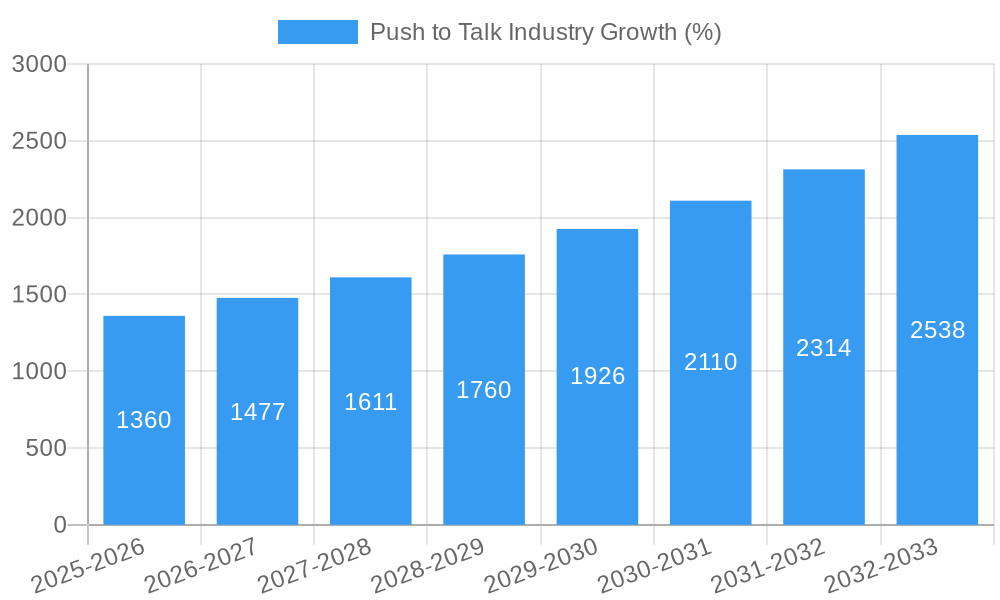
This section delves into the evolutionary trajectory of the PTT industry, charting market growth rates and adoption metrics across the historical and forecast periods. Technological advancements such as improved spectrum efficiency, enhanced device capabilities (e.g., increased battery life, improved audio quality), and the growing adoption of cloud-based PTT solutions are examined. The report analyzes shifting consumer demands, noting the increasing preference for integrated solutions combining PTT with other communication and data services. The transition from legacy Land Mobile Radio (LMR) systems to cellular-based PTT is critically analyzed, alongside its implications for market growth and industry structure. Growth is expected to average XX% annually during the forecast period. Adoption of cellular PTT is projected to increase by XX% annually.
Leading Regions, Countries, or Segments in Push to Talk Industry
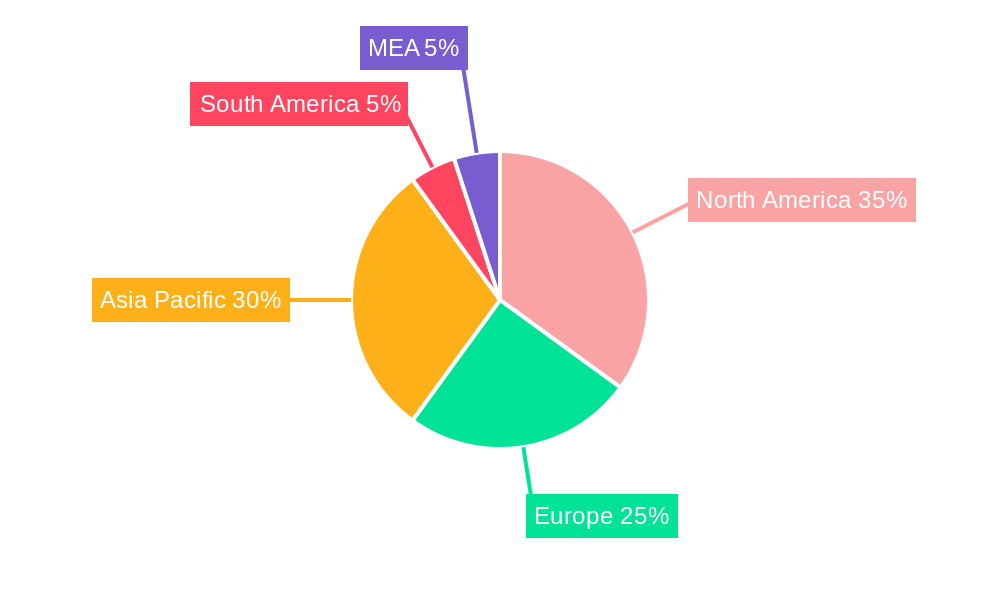
This section identifies the leading regions, countries, and segments within the PTT market. North America (particularly the US) and Europe are likely to remain dominant due to high levels of technological advancement and strong regulatory frameworks supporting public safety and commercial deployments. Within segments, Hardware sales are expected to maintain significant market share, while demand for integrated Services and Solutions is expected to grow rapidly.
Key Drivers:
- Public Safety: High demand for reliable, mission-critical communication in emergency response situations.
- Government & Defense: Stringent communication requirements for secure and coordinated operations.
- Commercial: Increasing adoption of PTT for improved operational efficiency and worker safety in industries like logistics, transportation, and field services.
Dominance Factors:
North America's dominance stems from early adoption of advanced technologies, robust infrastructure investment, and a strong regulatory environment fostering innovation and interoperability.
Push to Talk Industry Product Innovations
Recent innovations in the PTT market include the development of ultra-rugged devices optimized for harsh environments, integrated data and video capabilities, and advanced location tracking features. These improvements enhance situational awareness and operational effectiveness across diverse applications. This includes enhancements to push-to-talk over cellular (PTT-over-Cellular) technology, leading to greater reliability and wider coverage. Many solutions now seamlessly integrate with other enterprise systems, such as workforce management and dispatch platforms, providing comprehensive communication and operational management capabilities.
Propelling Factors for Push to Talk Industry Growth
Several factors contribute to PTT market growth. Technological advancements, including the wider adoption of 5G and LTE networks, are improving network performance and coverage. Economic factors, such as increased investment in infrastructure and enhanced safety regulations across various industries are also contributing to growth. Favorable regulatory environments that encourage the adoption of advanced technologies are further bolstering market expansion. For example, government initiatives focused on improving public safety communications provide a significant boost to market growth.
Obstacles in the Push to Talk Industry Market
Challenges include regulatory hurdles related to spectrum allocation and interoperability standards. Supply chain disruptions can affect the availability of key components, impacting production and timelines. Intense competition among established and emerging players also creates pressure on pricing and margins. The high initial cost of implementing PTT systems can be a barrier for smaller businesses. These factors can negatively impact market growth, particularly in specific geographic regions or industry segments.
Future Opportunities in Push to Talk Industry
Future opportunities include expanding into new markets, particularly in developing economies with growing infrastructure needs and increasing adoption of smartphones. The integration of AI and IoT capabilities offers exciting avenues for innovation. The demand for enhanced security features and privacy protection will drive the adoption of more secure PTT solutions.
Major Players in the Push to Talk Industry Ecosystem
- Verizon Wireless
- Motorola Solutions Inc
- Zebra
- Qualcomm Technologies Incorporation
- Iridium
- Tait Communications
- Telstra
- Hytera
- T-Mobile
- AT&T Inc
Key Developments in Push to Talk Industry Industry
- July 2022: Sonim Technologies launched the XP5plus on the AT&T network, offering a robust PTT-over-Cellular solution for extreme environments. This expands the market reach for ruggedized PTT devices.
- July 2022: Inmarsat partnered with Cobham, Hytera, and Global Beam Telecom to offer a seamless PTT solution in the Middle East, addressing a critical need for reliable communications in enterprise businesses. This enhances market penetration in a region with growing demand for enhanced connectivity.
Strategic Push to Talk Industry Market Forecast
The PTT industry is poised for significant growth, driven by technological advancements, expanding adoption across various sectors, and supportive regulatory environments. Future opportunities include the integration of advanced features like AI-powered functionalities, enhanced security protocols, and seamless integration with existing enterprise systems. This will lead to increased market penetration across a wider range of industries and geographies, creating a substantial market opportunity over the next decade.
Push to Talk Industry Segmentation
-
1. Component
- 1.1. Hardware
- 1.2. Solutions
- 1.3. Services
-
2. Network Type
- 2.1. LMR
- 2.2. Cellular
-
3. Vertical
- 3.1. Public Safety
- 3.2. Government and Defense
- 3.3. Commercial
Push to Talk Industry Segmentation By Geography
- 1. North America
- 2. Europe
- 3. Asia Pacific
- 4. Latin America
- 5. Middle East and Africa
Push to Talk Industry REPORT HIGHLIGHTS
| Aspects | Details |
|---|---|
| Study Period | 2019-2033 |
| Base Year | 2024 |
| Estimated Year | 2025 |
| Forecast Period | 2025-2033 |
| Historical Period | 2019-2024 |
| Growth Rate | CAGR of 9.17% from 2019-2033 |
| Segmentation |
|
Table of Contents
- 1. Introduction
- 1.1. Research Scope
- 1.2. Market Segmentation
- 1.3. Research Methodology
- 1.4. Definitions and Assumptions
- 2. Executive Summary
- 2.1. Introduction
- 3. Market Dynamics
- 3.1. Introduction
- 3.2. Market Drivers
- 3.2.1. Evolving Technologies to Support Growth; Proliferation of Rugged and Ultra-rugged Smartphones; Increasing Transition of Analog LMR Systems to Digital LMR Systems
- 3.3. Market Restrains
- 3.3.1. ; Lack of Control over Operations and Cost Visibility
- 3.4. Market Trends
- 3.4.1. Public Safety and Security Sector to Witness the Highest Adoption of PTT Devices
- 4. Market Factor Analysis
- 4.1. Porters Five Forces
- 4.2. Supply/Value Chain
- 4.3. PESTEL analysis
- 4.4. Market Entropy
- 4.5. Patent/Trademark Analysis
- 5. Global Push to Talk Industry Analysis, Insights and Forecast, 2019-2031
- 5.1. Market Analysis, Insights and Forecast - by Component
- 5.1.1. Hardware
- 5.1.2. Solutions
- 5.1.3. Services
- 5.2. Market Analysis, Insights and Forecast - by Network Type
- 5.2.1. LMR
- 5.2.2. Cellular
- 5.3. Market Analysis, Insights and Forecast - by Vertical
- 5.3.1. Public Safety
- 5.3.2. Government and Defense
- 5.3.3. Commercial
- 5.4. Market Analysis, Insights and Forecast - by Region
- 5.4.1. North America
- 5.4.2. Europe
- 5.4.3. Asia Pacific
- 5.4.4. Latin America
- 5.4.5. Middle East and Africa
- 5.1. Market Analysis, Insights and Forecast - by Component
- 6. North America Push to Talk Industry Analysis, Insights and Forecast, 2019-2031
- 6.1. Market Analysis, Insights and Forecast - by Component
- 6.1.1. Hardware
- 6.1.2. Solutions
- 6.1.3. Services
- 6.2. Market Analysis, Insights and Forecast - by Network Type
- 6.2.1. LMR
- 6.2.2. Cellular
- 6.3. Market Analysis, Insights and Forecast - by Vertical
- 6.3.1. Public Safety
- 6.3.2. Government and Defense
- 6.3.3. Commercial
- 6.1. Market Analysis, Insights and Forecast - by Component
- 7. Europe Push to Talk Industry Analysis, Insights and Forecast, 2019-2031
- 7.1. Market Analysis, Insights and Forecast - by Component
- 7.1.1. Hardware
- 7.1.2. Solutions
- 7.1.3. Services
- 7.2. Market Analysis, Insights and Forecast - by Network Type
- 7.2.1. LMR
- 7.2.2. Cellular
- 7.3. Market Analysis, Insights and Forecast - by Vertical
- 7.3.1. Public Safety
- 7.3.2. Government and Defense
- 7.3.3. Commercial
- 7.1. Market Analysis, Insights and Forecast - by Component
- 8. Asia Pacific Push to Talk Industry Analysis, Insights and Forecast, 2019-2031
- 8.1. Market Analysis, Insights and Forecast - by Component
- 8.1.1. Hardware
- 8.1.2. Solutions
- 8.1.3. Services
- 8.2. Market Analysis, Insights and Forecast - by Network Type
- 8.2.1. LMR
- 8.2.2. Cellular
- 8.3. Market Analysis, Insights and Forecast - by Vertical
- 8.3.1. Public Safety
- 8.3.2. Government and Defense
- 8.3.3. Commercial
- 8.1. Market Analysis, Insights and Forecast - by Component
- 9. Latin America Push to Talk Industry Analysis, Insights and Forecast, 2019-2031
- 9.1. Market Analysis, Insights and Forecast - by Component
- 9.1.1. Hardware
- 9.1.2. Solutions
- 9.1.3. Services
- 9.2. Market Analysis, Insights and Forecast - by Network Type
- 9.2.1. LMR
- 9.2.2. Cellular
- 9.3. Market Analysis, Insights and Forecast - by Vertical
- 9.3.1. Public Safety
- 9.3.2. Government and Defense
- 9.3.3. Commercial
- 9.1. Market Analysis, Insights and Forecast - by Component
- 10. Middle East and Africa Push to Talk Industry Analysis, Insights and Forecast, 2019-2031
- 10.1. Market Analysis, Insights and Forecast - by Component
- 10.1.1. Hardware
- 10.1.2. Solutions
- 10.1.3. Services
- 10.2. Market Analysis, Insights and Forecast - by Network Type
- 10.2.1. LMR
- 10.2.2. Cellular
- 10.3. Market Analysis, Insights and Forecast - by Vertical
- 10.3.1. Public Safety
- 10.3.2. Government and Defense
- 10.3.3. Commercial
- 10.1. Market Analysis, Insights and Forecast - by Component
- 11. North America Push to Talk Industry Analysis, Insights and Forecast, 2019-2031
- 11.1. Market Analysis, Insights and Forecast - By Country/Sub-region
- 11.1.1 United States
- 11.1.2 Canada
- 11.1.3 Mexico
- 12. Europe Push to Talk Industry Analysis, Insights and Forecast, 2019-2031
- 12.1. Market Analysis, Insights and Forecast - By Country/Sub-region
- 12.1.1 Germany
- 12.1.2 United Kingdom
- 12.1.3 France
- 12.1.4 Spain
- 12.1.5 Italy
- 12.1.6 Spain
- 12.1.7 Belgium
- 12.1.8 Netherland
- 12.1.9 Nordics
- 12.1.10 Rest of Europe
- 13. Asia Pacific Push to Talk Industry Analysis, Insights and Forecast, 2019-2031
- 13.1. Market Analysis, Insights and Forecast - By Country/Sub-region
- 13.1.1 China
- 13.1.2 Japan
- 13.1.3 India
- 13.1.4 South Korea
- 13.1.5 Southeast Asia
- 13.1.6 Australia
- 13.1.7 Indonesia
- 13.1.8 Phillipes
- 13.1.9 Singapore
- 13.1.10 Thailandc
- 13.1.11 Rest of Asia Pacific
- 14. South America Push to Talk Industry Analysis, Insights and Forecast, 2019-2031
- 14.1. Market Analysis, Insights and Forecast - By Country/Sub-region
- 14.1.1 Brazil
- 14.1.2 Argentina
- 14.1.3 Peru
- 14.1.4 Chile
- 14.1.5 Colombia
- 14.1.6 Ecuador
- 14.1.7 Venezuela
- 14.1.8 Rest of South America
- 15. North America Push to Talk Industry Analysis, Insights and Forecast, 2019-2031
- 15.1. Market Analysis, Insights and Forecast - By Country/Sub-region
- 15.1.1 United States
- 15.1.2 Canada
- 15.1.3 Mexico
- 16. MEA Push to Talk Industry Analysis, Insights and Forecast, 2019-2031
- 16.1. Market Analysis, Insights and Forecast - By Country/Sub-region
- 16.1.1 United Arab Emirates
- 16.1.2 Saudi Arabia
- 16.1.3 South Africa
- 16.1.4 Rest of Middle East and Africa
- 17. Competitive Analysis
- 17.1. Global Market Share Analysis 2024
- 17.2. Company Profiles
- 17.2.1 Verizon Wireless
- 17.2.1.1. Overview
- 17.2.1.2. Products
- 17.2.1.3. SWOT Analysis
- 17.2.1.4. Recent Developments
- 17.2.1.5. Financials (Based on Availability)
- 17.2.2 Motorola Solutions Inc
- 17.2.2.1. Overview
- 17.2.2.2. Products
- 17.2.2.3. SWOT Analysis
- 17.2.2.4. Recent Developments
- 17.2.2.5. Financials (Based on Availability)
- 17.2.3 Zebra
- 17.2.3.1. Overview
- 17.2.3.2. Products
- 17.2.3.3. SWOT Analysis
- 17.2.3.4. Recent Developments
- 17.2.3.5. Financials (Based on Availability)
- 17.2.4 Qualcomm Technologies Incorporation
- 17.2.4.1. Overview
- 17.2.4.2. Products
- 17.2.4.3. SWOT Analysis
- 17.2.4.4. Recent Developments
- 17.2.4.5. Financials (Based on Availability)
- 17.2.5 Iridium
- 17.2.5.1. Overview
- 17.2.5.2. Products
- 17.2.5.3. SWOT Analysis
- 17.2.5.4. Recent Developments
- 17.2.5.5. Financials (Based on Availability)
- 17.2.6 Tait Communications
- 17.2.6.1. Overview
- 17.2.6.2. Products
- 17.2.6.3. SWOT Analysis
- 17.2.6.4. Recent Developments
- 17.2.6.5. Financials (Based on Availability)
- 17.2.7 Telstra
- 17.2.7.1. Overview
- 17.2.7.2. Products
- 17.2.7.3. SWOT Analysis
- 17.2.7.4. Recent Developments
- 17.2.7.5. Financials (Based on Availability)
- 17.2.8 Hytera
- 17.2.8.1. Overview
- 17.2.8.2. Products
- 17.2.8.3. SWOT Analysis
- 17.2.8.4. Recent Developments
- 17.2.8.5. Financials (Based on Availability)
- 17.2.9 T-Mobile
- 17.2.9.1. Overview
- 17.2.9.2. Products
- 17.2.9.3. SWOT Analysis
- 17.2.9.4. Recent Developments
- 17.2.9.5. Financials (Based on Availability)
- 17.2.10 AT&T Inc
- 17.2.10.1. Overview
- 17.2.10.2. Products
- 17.2.10.3. SWOT Analysis
- 17.2.10.4. Recent Developments
- 17.2.10.5. Financials (Based on Availability)
- 17.2.1 Verizon Wireless
List of Figures
- Figure 1: Global Push to Talk Industry Revenue Breakdown (Million, %) by Region 2024 & 2032
- Figure 2: Global Push to Talk Industry Volume Breakdown (K Unit, %) by Region 2024 & 2032
- Figure 3: North America Push to Talk Industry Revenue (Million), by Country 2024 & 2032
- Figure 4: North America Push to Talk Industry Volume (K Unit), by Country 2024 & 2032
- Figure 5: North America Push to Talk Industry Revenue Share (%), by Country 2024 & 2032
- Figure 6: North America Push to Talk Industry Volume Share (%), by Country 2024 & 2032
- Figure 7: Europe Push to Talk Industry Revenue (Million), by Country 2024 & 2032
- Figure 8: Europe Push to Talk Industry Volume (K Unit), by Country 2024 & 2032
- Figure 9: Europe Push to Talk Industry Revenue Share (%), by Country 2024 & 2032
- Figure 10: Europe Push to Talk Industry Volume Share (%), by Country 2024 & 2032
- Figure 11: Asia Pacific Push to Talk Industry Revenue (Million), by Country 2024 & 2032
- Figure 12: Asia Pacific Push to Talk Industry Volume (K Unit), by Country 2024 & 2032
- Figure 13: Asia Pacific Push to Talk Industry Revenue Share (%), by Country 2024 & 2032
- Figure 14: Asia Pacific Push to Talk Industry Volume Share (%), by Country 2024 & 2032
- Figure 15: South America Push to Talk Industry Revenue (Million), by Country 2024 & 2032
- Figure 16: South America Push to Talk Industry Volume (K Unit), by Country 2024 & 2032
- Figure 17: South America Push to Talk Industry Revenue Share (%), by Country 2024 & 2032
- Figure 18: South America Push to Talk Industry Volume Share (%), by Country 2024 & 2032
- Figure 19: North America Push to Talk Industry Revenue (Million), by Country 2024 & 2032
- Figure 20: North America Push to Talk Industry Volume (K Unit), by Country 2024 & 2032
- Figure 21: North America Push to Talk Industry Revenue Share (%), by Country 2024 & 2032
- Figure 22: North America Push to Talk Industry Volume Share (%), by Country 2024 & 2032
- Figure 23: MEA Push to Talk Industry Revenue (Million), by Country 2024 & 2032
- Figure 24: MEA Push to Talk Industry Volume (K Unit), by Country 2024 & 2032
- Figure 25: MEA Push to Talk Industry Revenue Share (%), by Country 2024 & 2032
- Figure 26: MEA Push to Talk Industry Volume Share (%), by Country 2024 & 2032
- Figure 27: North America Push to Talk Industry Revenue (Million), by Component 2024 & 2032
- Figure 28: North America Push to Talk Industry Volume (K Unit), by Component 2024 & 2032
- Figure 29: North America Push to Talk Industry Revenue Share (%), by Component 2024 & 2032
- Figure 30: North America Push to Talk Industry Volume Share (%), by Component 2024 & 2032
- Figure 31: North America Push to Talk Industry Revenue (Million), by Network Type 2024 & 2032
- Figure 32: North America Push to Talk Industry Volume (K Unit), by Network Type 2024 & 2032
- Figure 33: North America Push to Talk Industry Revenue Share (%), by Network Type 2024 & 2032
- Figure 34: North America Push to Talk Industry Volume Share (%), by Network Type 2024 & 2032
- Figure 35: North America Push to Talk Industry Revenue (Million), by Vertical 2024 & 2032
- Figure 36: North America Push to Talk Industry Volume (K Unit), by Vertical 2024 & 2032
- Figure 37: North America Push to Talk Industry Revenue Share (%), by Vertical 2024 & 2032
- Figure 38: North America Push to Talk Industry Volume Share (%), by Vertical 2024 & 2032
- Figure 39: North America Push to Talk Industry Revenue (Million), by Country 2024 & 2032
- Figure 40: North America Push to Talk Industry Volume (K Unit), by Country 2024 & 2032
- Figure 41: North America Push to Talk Industry Revenue Share (%), by Country 2024 & 2032
- Figure 42: North America Push to Talk Industry Volume Share (%), by Country 2024 & 2032
- Figure 43: Europe Push to Talk Industry Revenue (Million), by Component 2024 & 2032
- Figure 44: Europe Push to Talk Industry Volume (K Unit), by Component 2024 & 2032
- Figure 45: Europe Push to Talk Industry Revenue Share (%), by Component 2024 & 2032
- Figure 46: Europe Push to Talk Industry Volume Share (%), by Component 2024 & 2032
- Figure 47: Europe Push to Talk Industry Revenue (Million), by Network Type 2024 & 2032
- Figure 48: Europe Push to Talk Industry Volume (K Unit), by Network Type 2024 & 2032
- Figure 49: Europe Push to Talk Industry Revenue Share (%), by Network Type 2024 & 2032
- Figure 50: Europe Push to Talk Industry Volume Share (%), by Network Type 2024 & 2032
- Figure 51: Europe Push to Talk Industry Revenue (Million), by Vertical 2024 & 2032
- Figure 52: Europe Push to Talk Industry Volume (K Unit), by Vertical 2024 & 2032
- Figure 53: Europe Push to Talk Industry Revenue Share (%), by Vertical 2024 & 2032
- Figure 54: Europe Push to Talk Industry Volume Share (%), by Vertical 2024 & 2032
- Figure 55: Europe Push to Talk Industry Revenue (Million), by Country 2024 & 2032
- Figure 56: Europe Push to Talk Industry Volume (K Unit), by Country 2024 & 2032
- Figure 57: Europe Push to Talk Industry Revenue Share (%), by Country 2024 & 2032
- Figure 58: Europe Push to Talk Industry Volume Share (%), by Country 2024 & 2032
- Figure 59: Asia Pacific Push to Talk Industry Revenue (Million), by Component 2024 & 2032
- Figure 60: Asia Pacific Push to Talk Industry Volume (K Unit), by Component 2024 & 2032
- Figure 61: Asia Pacific Push to Talk Industry Revenue Share (%), by Component 2024 & 2032
- Figure 62: Asia Pacific Push to Talk Industry Volume Share (%), by Component 2024 & 2032
- Figure 63: Asia Pacific Push to Talk Industry Revenue (Million), by Network Type 2024 & 2032
- Figure 64: Asia Pacific Push to Talk Industry Volume (K Unit), by Network Type 2024 & 2032
- Figure 65: Asia Pacific Push to Talk Industry Revenue Share (%), by Network Type 2024 & 2032
- Figure 66: Asia Pacific Push to Talk Industry Volume Share (%), by Network Type 2024 & 2032
- Figure 67: Asia Pacific Push to Talk Industry Revenue (Million), by Vertical 2024 & 2032
- Figure 68: Asia Pacific Push to Talk Industry Volume (K Unit), by Vertical 2024 & 2032
- Figure 69: Asia Pacific Push to Talk Industry Revenue Share (%), by Vertical 2024 & 2032
- Figure 70: Asia Pacific Push to Talk Industry Volume Share (%), by Vertical 2024 & 2032
- Figure 71: Asia Pacific Push to Talk Industry Revenue (Million), by Country 2024 & 2032
- Figure 72: Asia Pacific Push to Talk Industry Volume (K Unit), by Country 2024 & 2032
- Figure 73: Asia Pacific Push to Talk Industry Revenue Share (%), by Country 2024 & 2032
- Figure 74: Asia Pacific Push to Talk Industry Volume Share (%), by Country 2024 & 2032
- Figure 75: Latin America Push to Talk Industry Revenue (Million), by Component 2024 & 2032
- Figure 76: Latin America Push to Talk Industry Volume (K Unit), by Component 2024 & 2032
- Figure 77: Latin America Push to Talk Industry Revenue Share (%), by Component 2024 & 2032
- Figure 78: Latin America Push to Talk Industry Volume Share (%), by Component 2024 & 2032
- Figure 79: Latin America Push to Talk Industry Revenue (Million), by Network Type 2024 & 2032
- Figure 80: Latin America Push to Talk Industry Volume (K Unit), by Network Type 2024 & 2032
- Figure 81: Latin America Push to Talk Industry Revenue Share (%), by Network Type 2024 & 2032
- Figure 82: Latin America Push to Talk Industry Volume Share (%), by Network Type 2024 & 2032
- Figure 83: Latin America Push to Talk Industry Revenue (Million), by Vertical 2024 & 2032
- Figure 84: Latin America Push to Talk Industry Volume (K Unit), by Vertical 2024 & 2032
- Figure 85: Latin America Push to Talk Industry Revenue Share (%), by Vertical 2024 & 2032
- Figure 86: Latin America Push to Talk Industry Volume Share (%), by Vertical 2024 & 2032
- Figure 87: Latin America Push to Talk Industry Revenue (Million), by Country 2024 & 2032
- Figure 88: Latin America Push to Talk Industry Volume (K Unit), by Country 2024 & 2032
- Figure 89: Latin America Push to Talk Industry Revenue Share (%), by Country 2024 & 2032
- Figure 90: Latin America Push to Talk Industry Volume Share (%), by Country 2024 & 2032
- Figure 91: Middle East and Africa Push to Talk Industry Revenue (Million), by Component 2024 & 2032
- Figure 92: Middle East and Africa Push to Talk Industry Volume (K Unit), by Component 2024 & 2032
- Figure 93: Middle East and Africa Push to Talk Industry Revenue Share (%), by Component 2024 & 2032
- Figure 94: Middle East and Africa Push to Talk Industry Volume Share (%), by Component 2024 & 2032
- Figure 95: Middle East and Africa Push to Talk Industry Revenue (Million), by Network Type 2024 & 2032
- Figure 96: Middle East and Africa Push to Talk Industry Volume (K Unit), by Network Type 2024 & 2032
- Figure 97: Middle East and Africa Push to Talk Industry Revenue Share (%), by Network Type 2024 & 2032
- Figure 98: Middle East and Africa Push to Talk Industry Volume Share (%), by Network Type 2024 & 2032
- Figure 99: Middle East and Africa Push to Talk Industry Revenue (Million), by Vertical 2024 & 2032
- Figure 100: Middle East and Africa Push to Talk Industry Volume (K Unit), by Vertical 2024 & 2032
- Figure 101: Middle East and Africa Push to Talk Industry Revenue Share (%), by Vertical 2024 & 2032
- Figure 102: Middle East and Africa Push to Talk Industry Volume Share (%), by Vertical 2024 & 2032
- Figure 103: Middle East and Africa Push to Talk Industry Revenue (Million), by Country 2024 & 2032
- Figure 104: Middle East and Africa Push to Talk Industry Volume (K Unit), by Country 2024 & 2032
- Figure 105: Middle East and Africa Push to Talk Industry Revenue Share (%), by Country 2024 & 2032
- Figure 106: Middle East and Africa Push to Talk Industry Volume Share (%), by Country 2024 & 2032
List of Tables
- Table 1: Global Push to Talk Industry Revenue Million Forecast, by Region 2019 & 2032
- Table 2: Global Push to Talk Industry Volume K Unit Forecast, by Region 2019 & 2032
- Table 3: Global Push to Talk Industry Revenue Million Forecast, by Component 2019 & 2032
- Table 4: Global Push to Talk Industry Volume K Unit Forecast, by Component 2019 & 2032
- Table 5: Global Push to Talk Industry Revenue Million Forecast, by Network Type 2019 & 2032
- Table 6: Global Push to Talk Industry Volume K Unit Forecast, by Network Type 2019 & 2032
- Table 7: Global Push to Talk Industry Revenue Million Forecast, by Vertical 2019 & 2032
- Table 8: Global Push to Talk Industry Volume K Unit Forecast, by Vertical 2019 & 2032
- Table 9: Global Push to Talk Industry Revenue Million Forecast, by Region 2019 & 2032
- Table 10: Global Push to Talk Industry Volume K Unit Forecast, by Region 2019 & 2032
- Table 11: Global Push to Talk Industry Revenue Million Forecast, by Country 2019 & 2032
- Table 12: Global Push to Talk Industry Volume K Unit Forecast, by Country 2019 & 2032
- Table 13: United States Push to Talk Industry Revenue (Million) Forecast, by Application 2019 & 2032
- Table 14: United States Push to Talk Industry Volume (K Unit) Forecast, by Application 2019 & 2032
- Table 15: Canada Push to Talk Industry Revenue (Million) Forecast, by Application 2019 & 2032
- Table 16: Canada Push to Talk Industry Volume (K Unit) Forecast, by Application 2019 & 2032
- Table 17: Mexico Push to Talk Industry Revenue (Million) Forecast, by Application 2019 & 2032
- Table 18: Mexico Push to Talk Industry Volume (K Unit) Forecast, by Application 2019 & 2032
- Table 19: Global Push to Talk Industry Revenue Million Forecast, by Country 2019 & 2032
- Table 20: Global Push to Talk Industry Volume K Unit Forecast, by Country 2019 & 2032
- Table 21: Germany Push to Talk Industry Revenue (Million) Forecast, by Application 2019 & 2032
- Table 22: Germany Push to Talk Industry Volume (K Unit) Forecast, by Application 2019 & 2032
- Table 23: United Kingdom Push to Talk Industry Revenue (Million) Forecast, by Application 2019 & 2032
- Table 24: United Kingdom Push to Talk Industry Volume (K Unit) Forecast, by Application 2019 & 2032
- Table 25: France Push to Talk Industry Revenue (Million) Forecast, by Application 2019 & 2032
- Table 26: France Push to Talk Industry Volume (K Unit) Forecast, by Application 2019 & 2032
- Table 27: Spain Push to Talk Industry Revenue (Million) Forecast, by Application 2019 & 2032
- Table 28: Spain Push to Talk Industry Volume (K Unit) Forecast, by Application 2019 & 2032
- Table 29: Italy Push to Talk Industry Revenue (Million) Forecast, by Application 2019 & 2032
- Table 30: Italy Push to Talk Industry Volume (K Unit) Forecast, by Application 2019 & 2032
- Table 31: Spain Push to Talk Industry Revenue (Million) Forecast, by Application 2019 & 2032
- Table 32: Spain Push to Talk Industry Volume (K Unit) Forecast, by Application 2019 & 2032
- Table 33: Belgium Push to Talk Industry Revenue (Million) Forecast, by Application 2019 & 2032
- Table 34: Belgium Push to Talk Industry Volume (K Unit) Forecast, by Application 2019 & 2032
- Table 35: Netherland Push to Talk Industry Revenue (Million) Forecast, by Application 2019 & 2032
- Table 36: Netherland Push to Talk Industry Volume (K Unit) Forecast, by Application 2019 & 2032
- Table 37: Nordics Push to Talk Industry Revenue (Million) Forecast, by Application 2019 & 2032
- Table 38: Nordics Push to Talk Industry Volume (K Unit) Forecast, by Application 2019 & 2032
- Table 39: Rest of Europe Push to Talk Industry Revenue (Million) Forecast, by Application 2019 & 2032
- Table 40: Rest of Europe Push to Talk Industry Volume (K Unit) Forecast, by Application 2019 & 2032
- Table 41: Global Push to Talk Industry Revenue Million Forecast, by Country 2019 & 2032
- Table 42: Global Push to Talk Industry Volume K Unit Forecast, by Country 2019 & 2032
- Table 43: China Push to Talk Industry Revenue (Million) Forecast, by Application 2019 & 2032
- Table 44: China Push to Talk Industry Volume (K Unit) Forecast, by Application 2019 & 2032
- Table 45: Japan Push to Talk Industry Revenue (Million) Forecast, by Application 2019 & 2032
- Table 46: Japan Push to Talk Industry Volume (K Unit) Forecast, by Application 2019 & 2032
- Table 47: India Push to Talk Industry Revenue (Million) Forecast, by Application 2019 & 2032
- Table 48: India Push to Talk Industry Volume (K Unit) Forecast, by Application 2019 & 2032
- Table 49: South Korea Push to Talk Industry Revenue (Million) Forecast, by Application 2019 & 2032
- Table 50: South Korea Push to Talk Industry Volume (K Unit) Forecast, by Application 2019 & 2032
- Table 51: Southeast Asia Push to Talk Industry Revenue (Million) Forecast, by Application 2019 & 2032
- Table 52: Southeast Asia Push to Talk Industry Volume (K Unit) Forecast, by Application 2019 & 2032
- Table 53: Australia Push to Talk Industry Revenue (Million) Forecast, by Application 2019 & 2032
- Table 54: Australia Push to Talk Industry Volume (K Unit) Forecast, by Application 2019 & 2032
- Table 55: Indonesia Push to Talk Industry Revenue (Million) Forecast, by Application 2019 & 2032
- Table 56: Indonesia Push to Talk Industry Volume (K Unit) Forecast, by Application 2019 & 2032
- Table 57: Phillipes Push to Talk Industry Revenue (Million) Forecast, by Application 2019 & 2032
- Table 58: Phillipes Push to Talk Industry Volume (K Unit) Forecast, by Application 2019 & 2032
- Table 59: Singapore Push to Talk Industry Revenue (Million) Forecast, by Application 2019 & 2032
- Table 60: Singapore Push to Talk Industry Volume (K Unit) Forecast, by Application 2019 & 2032
- Table 61: Thailandc Push to Talk Industry Revenue (Million) Forecast, by Application 2019 & 2032
- Table 62: Thailandc Push to Talk Industry Volume (K Unit) Forecast, by Application 2019 & 2032
- Table 63: Rest of Asia Pacific Push to Talk Industry Revenue (Million) Forecast, by Application 2019 & 2032
- Table 64: Rest of Asia Pacific Push to Talk Industry Volume (K Unit) Forecast, by Application 2019 & 2032
- Table 65: Global Push to Talk Industry Revenue Million Forecast, by Country 2019 & 2032
- Table 66: Global Push to Talk Industry Volume K Unit Forecast, by Country 2019 & 2032
- Table 67: Brazil Push to Talk Industry Revenue (Million) Forecast, by Application 2019 & 2032
- Table 68: Brazil Push to Talk Industry Volume (K Unit) Forecast, by Application 2019 & 2032
- Table 69: Argentina Push to Talk Industry Revenue (Million) Forecast, by Application 2019 & 2032
- Table 70: Argentina Push to Talk Industry Volume (K Unit) Forecast, by Application 2019 & 2032
- Table 71: Peru Push to Talk Industry Revenue (Million) Forecast, by Application 2019 & 2032
- Table 72: Peru Push to Talk Industry Volume (K Unit) Forecast, by Application 2019 & 2032
- Table 73: Chile Push to Talk Industry Revenue (Million) Forecast, by Application 2019 & 2032
- Table 74: Chile Push to Talk Industry Volume (K Unit) Forecast, by Application 2019 & 2032
- Table 75: Colombia Push to Talk Industry Revenue (Million) Forecast, by Application 2019 & 2032
- Table 76: Colombia Push to Talk Industry Volume (K Unit) Forecast, by Application 2019 & 2032
- Table 77: Ecuador Push to Talk Industry Revenue (Million) Forecast, by Application 2019 & 2032
- Table 78: Ecuador Push to Talk Industry Volume (K Unit) Forecast, by Application 2019 & 2032
- Table 79: Venezuela Push to Talk Industry Revenue (Million) Forecast, by Application 2019 & 2032
- Table 80: Venezuela Push to Talk Industry Volume (K Unit) Forecast, by Application 2019 & 2032
- Table 81: Rest of South America Push to Talk Industry Revenue (Million) Forecast, by Application 2019 & 2032
- Table 82: Rest of South America Push to Talk Industry Volume (K Unit) Forecast, by Application 2019 & 2032
- Table 83: Global Push to Talk Industry Revenue Million Forecast, by Country 2019 & 2032
- Table 84: Global Push to Talk Industry Volume K Unit Forecast, by Country 2019 & 2032
- Table 85: United States Push to Talk Industry Revenue (Million) Forecast, by Application 2019 & 2032
- Table 86: United States Push to Talk Industry Volume (K Unit) Forecast, by Application 2019 & 2032
- Table 87: Canada Push to Talk Industry Revenue (Million) Forecast, by Application 2019 & 2032
- Table 88: Canada Push to Talk Industry Volume (K Unit) Forecast, by Application 2019 & 2032
- Table 89: Mexico Push to Talk Industry Revenue (Million) Forecast, by Application 2019 & 2032
- Table 90: Mexico Push to Talk Industry Volume (K Unit) Forecast, by Application 2019 & 2032
- Table 91: Global Push to Talk Industry Revenue Million Forecast, by Country 2019 & 2032
- Table 92: Global Push to Talk Industry Volume K Unit Forecast, by Country 2019 & 2032
- Table 93: United Arab Emirates Push to Talk Industry Revenue (Million) Forecast, by Application 2019 & 2032
- Table 94: United Arab Emirates Push to Talk Industry Volume (K Unit) Forecast, by Application 2019 & 2032
- Table 95: Saudi Arabia Push to Talk Industry Revenue (Million) Forecast, by Application 2019 & 2032
- Table 96: Saudi Arabia Push to Talk Industry Volume (K Unit) Forecast, by Application 2019 & 2032
- Table 97: South Africa Push to Talk Industry Revenue (Million) Forecast, by Application 2019 & 2032
- Table 98: South Africa Push to Talk Industry Volume (K Unit) Forecast, by Application 2019 & 2032
- Table 99: Rest of Middle East and Africa Push to Talk Industry Revenue (Million) Forecast, by Application 2019 & 2032
- Table 100: Rest of Middle East and Africa Push to Talk Industry Volume (K Unit) Forecast, by Application 2019 & 2032
- Table 101: Global Push to Talk Industry Revenue Million Forecast, by Component 2019 & 2032
- Table 102: Global Push to Talk Industry Volume K Unit Forecast, by Component 2019 & 2032
- Table 103: Global Push to Talk Industry Revenue Million Forecast, by Network Type 2019 & 2032
- Table 104: Global Push to Talk Industry Volume K Unit Forecast, by Network Type 2019 & 2032
- Table 105: Global Push to Talk Industry Revenue Million Forecast, by Vertical 2019 & 2032
- Table 106: Global Push to Talk Industry Volume K Unit Forecast, by Vertical 2019 & 2032
- Table 107: Global Push to Talk Industry Revenue Million Forecast, by Country 2019 & 2032
- Table 108: Global Push to Talk Industry Volume K Unit Forecast, by Country 2019 & 2032
- Table 109: Global Push to Talk Industry Revenue Million Forecast, by Component 2019 & 2032
- Table 110: Global Push to Talk Industry Volume K Unit Forecast, by Component 2019 & 2032
- Table 111: Global Push to Talk Industry Revenue Million Forecast, by Network Type 2019 & 2032
- Table 112: Global Push to Talk Industry Volume K Unit Forecast, by Network Type 2019 & 2032
- Table 113: Global Push to Talk Industry Revenue Million Forecast, by Vertical 2019 & 2032
- Table 114: Global Push to Talk Industry Volume K Unit Forecast, by Vertical 2019 & 2032
- Table 115: Global Push to Talk Industry Revenue Million Forecast, by Country 2019 & 2032
- Table 116: Global Push to Talk Industry Volume K Unit Forecast, by Country 2019 & 2032
- Table 117: Global Push to Talk Industry Revenue Million Forecast, by Component 2019 & 2032
- Table 118: Global Push to Talk Industry Volume K Unit Forecast, by Component 2019 & 2032
- Table 119: Global Push to Talk Industry Revenue Million Forecast, by Network Type 2019 & 2032
- Table 120: Global Push to Talk Industry Volume K Unit Forecast, by Network Type 2019 & 2032
- Table 121: Global Push to Talk Industry Revenue Million Forecast, by Vertical 2019 & 2032
- Table 122: Global Push to Talk Industry Volume K Unit Forecast, by Vertical 2019 & 2032
- Table 123: Global Push to Talk Industry Revenue Million Forecast, by Country 2019 & 2032
- Table 124: Global Push to Talk Industry Volume K Unit Forecast, by Country 2019 & 2032
- Table 125: Global Push to Talk Industry Revenue Million Forecast, by Component 2019 & 2032
- Table 126: Global Push to Talk Industry Volume K Unit Forecast, by Component 2019 & 2032
- Table 127: Global Push to Talk Industry Revenue Million Forecast, by Network Type 2019 & 2032
- Table 128: Global Push to Talk Industry Volume K Unit Forecast, by Network Type 2019 & 2032
- Table 129: Global Push to Talk Industry Revenue Million Forecast, by Vertical 2019 & 2032
- Table 130: Global Push to Talk Industry Volume K Unit Forecast, by Vertical 2019 & 2032
- Table 131: Global Push to Talk Industry Revenue Million Forecast, by Country 2019 & 2032
- Table 132: Global Push to Talk Industry Volume K Unit Forecast, by Country 2019 & 2032
- Table 133: Global Push to Talk Industry Revenue Million Forecast, by Component 2019 & 2032
- Table 134: Global Push to Talk Industry Volume K Unit Forecast, by Component 2019 & 2032
- Table 135: Global Push to Talk Industry Revenue Million Forecast, by Network Type 2019 & 2032
- Table 136: Global Push to Talk Industry Volume K Unit Forecast, by Network Type 2019 & 2032
- Table 137: Global Push to Talk Industry Revenue Million Forecast, by Vertical 2019 & 2032
- Table 138: Global Push to Talk Industry Volume K Unit Forecast, by Vertical 2019 & 2032
- Table 139: Global Push to Talk Industry Revenue Million Forecast, by Country 2019 & 2032
- Table 140: Global Push to Talk Industry Volume K Unit Forecast, by Country 2019 & 2032
Frequently Asked Questions
1. What is the projected Compound Annual Growth Rate (CAGR) of the Push to Talk Industry?
The projected CAGR is approximately 9.17%.
2. Which companies are prominent players in the Push to Talk Industry?
Key companies in the market include Verizon Wireless, Motorola Solutions Inc, Zebra, Qualcomm Technologies Incorporation, Iridium, Tait Communications, Telstra, Hytera, T-Mobile, AT&T Inc.
3. What are the main segments of the Push to Talk Industry?
The market segments include Component, Network Type, Vertical.
4. Can you provide details about the market size?
The market size is estimated to be USD XX Million as of 2022.
5. What are some drivers contributing to market growth?
Evolving Technologies to Support Growth; Proliferation of Rugged and Ultra-rugged Smartphones; Increasing Transition of Analog LMR Systems to Digital LMR Systems.
6. What are the notable trends driving market growth?
Public Safety and Security Sector to Witness the Highest Adoption of PTT Devices.
7. Are there any restraints impacting market growth?
; Lack of Control over Operations and Cost Visibility.
8. Can you provide examples of recent developments in the market?
In July 2022: Sonim Technologies announced the launch of the XP5plus on the AT&T network; this will offer the best of both cellular and radio-like capabilities for businesses and employees working in extreme conditions. The XP5plus is built on the legacy of its predecessor, the XP5s, which is one of the most widely used PTT-over-Cellular ultra-rugged devices among frontline workers and first responders who need instant, reliable communications when it matters most.
9. What pricing options are available for accessing the report?
Pricing options include single-user, multi-user, and enterprise licenses priced at USD 4750, USD 5250, and USD 8750 respectively.
10. Is the market size provided in terms of value or volume?
The market size is provided in terms of value, measured in Million and volume, measured in K Unit.
11. Are there any specific market keywords associated with the report?
Yes, the market keyword associated with the report is "Push to Talk Industry," which aids in identifying and referencing the specific market segment covered.
12. How do I determine which pricing option suits my needs best?
The pricing options vary based on user requirements and access needs. Individual users may opt for single-user licenses, while businesses requiring broader access may choose multi-user or enterprise licenses for cost-effective access to the report.
13. Are there any additional resources or data provided in the Push to Talk Industry report?
While the report offers comprehensive insights, it's advisable to review the specific contents or supplementary materials provided to ascertain if additional resources or data are available.
14. How can I stay updated on further developments or reports in the Push to Talk Industry?
To stay informed about further developments, trends, and reports in the Push to Talk Industry, consider subscribing to industry newsletters, following relevant companies and organizations, or regularly checking reputable industry news sources and publications.
Methodology
Step 1 - Identification of Relevant Samples Size from Population Database


Step 2 - Approaches for Defining Global Market Size (Value, Volume* & Price*)

Note*: In applicable scenarios
Step 3 - Data Sources
Primary Research
- Web Analytics
- Survey Reports
- Research Institute
- Latest Research Reports
- Opinion Leaders
Secondary Research
- Annual Reports
- White Paper
- Latest Press Release
- Industry Association
- Paid Database
- Investor Presentations

Step 4 - Data Triangulation
Involves using different sources of information in order to increase the validity of a study
These sources are likely to be stakeholders in a program - participants, other researchers, program staff, other community members, and so on.
Then we put all data in single framework & apply various statistical tools to find out the dynamic on the market.
During the analysis stage, feedback from the stakeholder groups would be compared to determine areas of agreement as well as areas of divergence
