

Key Insights
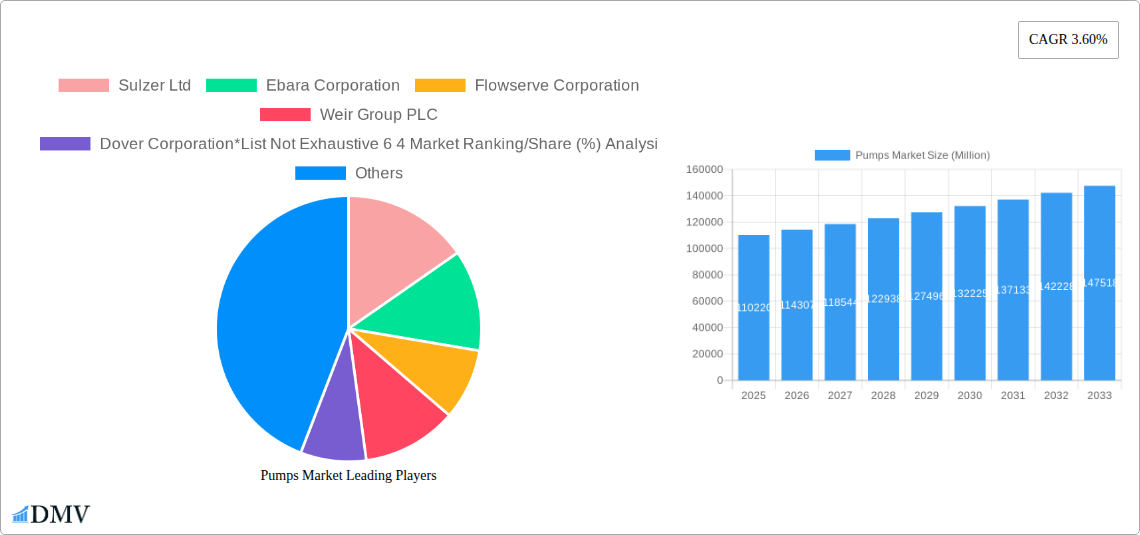
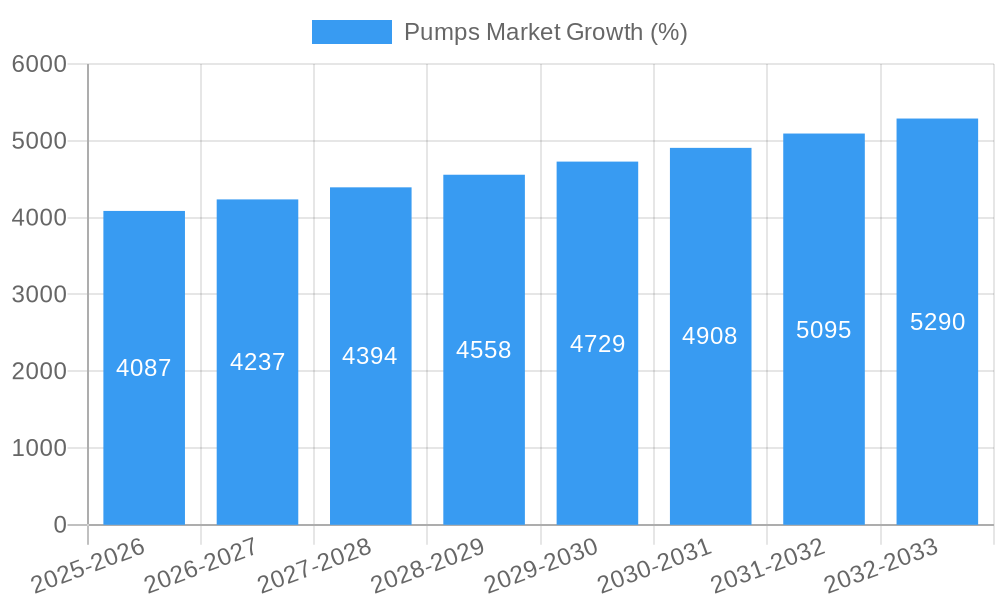
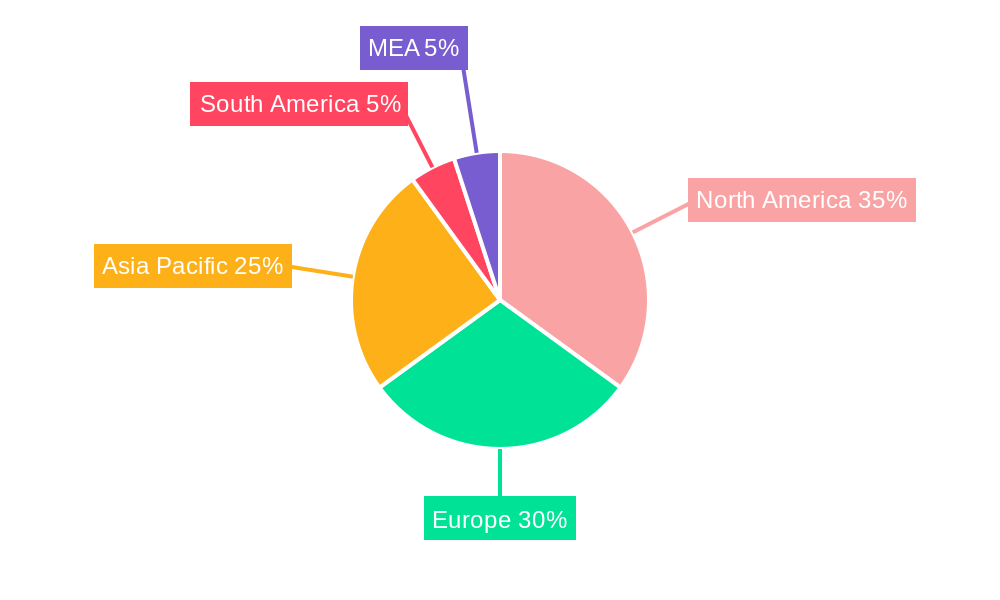
The global pumps market, valued at $110.22 billion in 2025, is projected to experience steady growth, driven by increasing demand across diverse end-use industries. A compound annual growth rate (CAGR) of 3.60% from 2025 to 2033 indicates a significant expansion, reaching an estimated value exceeding $150 billion by 2033. Key drivers include the burgeoning oil and gas sector's ongoing infrastructure development, the expanding water and wastewater treatment facilities globally, and the growth of the chemical and petrochemical industries. Furthermore, rising investments in power generation and mining operations contribute to increased pump demand. Market segmentation reveals centrifugal pumps as the dominant type, reflecting their versatility and cost-effectiveness. Geographic analysis suggests North America and Europe currently hold substantial market shares, yet the Asia-Pacific region is poised for accelerated growth, fueled by rapid industrialization and infrastructure projects in countries like China and India. Competition within the market is fierce, with major players like Sulzer, Ebara, Flowserve, and Weir Group vying for market share through technological innovation and strategic partnerships. However, factors such as stringent environmental regulations and fluctuations in commodity prices could pose challenges to sustained market growth.
The market is witnessing several key trends. Technological advancements in pump design, such as the development of energy-efficient and smart pumps, are gaining traction. Furthermore, increasing emphasis on sustainability and reduced environmental impact is driving demand for eco-friendly pump solutions. The integration of digital technologies, like IoT and predictive maintenance, is improving operational efficiency and reducing downtime. While the market faces certain restraints such as raw material price volatility and potential supply chain disruptions, the overall outlook remains positive, with continued growth anticipated across all major segments and regions. Companies are focusing on product diversification, strategic acquisitions, and expansion into emerging markets to capitalize on the growth opportunities presented by this dynamic sector.
Pumps Market: A Comprehensive Report (2019-2033)
This insightful report provides a detailed analysis of the global Pumps Market, encompassing historical data (2019-2024), the base year (2025), and a comprehensive forecast (2025-2033). It delves into market segmentation, competitive dynamics, technological advancements, and future growth prospects, offering invaluable insights for stakeholders across the industry. The market is projected to reach xx Million by 2033, exhibiting a CAGR of xx% during the forecast period.
Pumps Market Composition & Trends
The global Pumps Market is characterized by a moderately concentrated landscape, with key players like Sulzer Ltd, Ebara Corporation, Flowserve Corporation, Weir Group PLC, and Dover Corporation holding significant market share. However, the presence of numerous smaller players and regional manufacturers creates a dynamic competitive environment. Innovation in materials, energy efficiency, and smart technologies is a key catalyst for growth. Stringent environmental regulations, particularly concerning water and wastewater treatment, are shaping market dynamics, while the increasing adoption of automation and digitalization is driving demand for sophisticated pump systems. Substitute products, such as alternative fluid handling methods, pose a moderate threat. The report analyzes mergers and acquisitions (M&A) activities, including deal values, impacting the market's competitive structure.
- Market Concentration: Moderately concentrated, with top 6 players holding approximately xx% market share in 2025.
- Innovation: Focus on energy efficiency, smart pumps, and advanced materials.
- Regulatory Landscape: Stringent environmental regulations drive demand for sustainable solutions.
- Substitute Products: Limited, but alternative fluid handling methods represent a potential challenge.
- End-User Profile: Diversified across various industries including Oil & Gas, Water & Wastewater, and Chemicals.
- M&A Activity: Analysis includes xx deals with a total estimated value of xx Million between 2019 and 2024.
Pumps Market Industry Evolution
The Pumps Market has witnessed consistent growth over the past years, driven by increasing industrialization, infrastructure development, and rising demand across diverse end-use sectors. Technological advancements, including the introduction of variable speed drives, improved materials, and smart pump technologies, have enhanced efficiency and reliability. Shifting consumer demands are focused on sustainability, cost-effectiveness, and ease of maintenance. Growth has been particularly strong in emerging economies due to rapid industrialization and infrastructure projects. The report analyzes growth trajectories, technological shifts, and evolving consumer preferences with detailed data points including:
- Historical Growth Rate (2019-2024): xx% CAGR
- Projected Growth Rate (2025-2033): xx% CAGR
- Adoption of Smart Pump Technologies: xx% by 2033 (projected).
- Market Segmentation Trends: Increasing demand for centrifugal pumps in water & wastewater treatment and positive displacement pumps in oil & gas.
Leading Regions, Countries, or Segments in Pumps Market
The North American region is currently the dominant market for pumps, driven by robust industrial activity and infrastructure investments in the U.S. Within the segment breakdown, the Oil and Gas end-user sector exhibits significant growth due to ongoing exploration and production activities. Centrifugal pumps are the leading type in terms of market share owing to their versatility and cost-effectiveness.
- Key Drivers for North America: Strong industrial base, significant investments in infrastructure, and high demand from the oil and gas sector.
- Key Drivers for Oil and Gas segment: Increased exploration and production activities, coupled with the need for efficient and reliable pumping solutions.
- Key Drivers for Centrifugal Pumps: Cost-effectiveness, versatility, and suitability for diverse applications.
Pumps Market Product Innovations
Recent innovations include the development of energy-efficient pumps incorporating variable speed drives and advanced materials. Smart pumps with integrated sensors and remote monitoring capabilities are also gaining traction. These innovations enhance operational efficiency, reduce energy consumption, and minimize maintenance requirements. Unique selling propositions include enhanced reliability, longer lifespan, and improved performance.
Propelling Factors for Pumps Market Growth
Technological advancements such as smart pumps and energy-efficient designs are driving market growth. The increasing need for efficient water and wastewater management is also a key factor, particularly in developing countries. Favorable government policies and infrastructure investments further contribute to the market's expansion.
Obstacles in the Pumps Market Market
Fluctuations in raw material prices and supply chain disruptions pose significant challenges. Intense competition from established and emerging players puts pressure on pricing and profitability. Stringent environmental regulations also necessitate significant investments in compliance. The combined impact of these factors is estimated to reduce overall market growth by approximately xx% during the forecast period.
Future Opportunities in Pumps Market
Emerging markets in Asia and Africa present significant growth potential. The increasing adoption of renewable energy sources is creating demand for pumps in geothermal and solar applications. The development of next-generation pumps with enhanced features and functionalities is an important area for future innovation.
Major Players in the Pumps Market Ecosystem
- Sulzer Ltd
- Ebara Corporation
- Flowserve Corporation
- Weir Group PLC
- Dover Corporation
- Clyde Union Inc
- Schlumberger Ltd
- KSB SE & Co KGaA
- ITT Inc
- Grundfos Holding AS
- Baker Hughes Company
Key Developments in Pumps Market Industry
- December 2023: Packo Pumps website merged with Verder Liquids website, expanding product offerings.
- May 2023: ClydeUnion Pumps signed an agreement with ONGC for pump maintenance services in India.
- February 2023: Motion & Control Enterprises acquired Precision Pump & Valve, strengthening its presence in the oil and gas sector.
Strategic Pumps Market Market Forecast
The Pumps Market is poised for sustained growth, driven by technological advancements, infrastructural development, and rising demand across various industries. The market's potential is significant, particularly in emerging economies and specialized applications. Continued innovation in energy efficiency, sustainability, and smart technologies will shape future market dynamics.
Pumps Market Segmentation
-
1. Type
- 1.1. Centrifugal Pump
- 1.2. Positive Displacement Pump
-
2. End User
- 2.1. Oil and Gas
- 2.2. Water and Wastewater
- 2.3. Chemicals and Petrochemicals
- 2.4. Mining Industry
- 2.5. Power Generation
- 2.6. Other End Users
Pumps Market Segmentation By Geography
-
1. North America
- 1.1. United States
- 1.2. Canada
- 1.3. Rest of North America
-
2. Europe
- 2.1. Germany
- 2.2. France
- 2.3. Spain
- 2.4. United Kingdom
- 2.5. Russia
- 2.6. NORDIC
- 2.7. Italy
- 2.8. Turkey
- 2.9. Rest of Europe
-
3. Asia Pacific
- 3.1. China
- 3.2. India
- 3.3. Japan
- 3.4. South Korea
- 3.5. Australia
- 3.6. Malaysia
- 3.7. Thailand
- 3.8. Indonesia
- 3.9. Vietnam
- 3.10. Rest of Asia Pacific
-
4. South America
- 4.1. Brazil
- 4.2. Argentina
- 4.3. Colombia
- 4.4. Rest of South America
-
5. Middle East and Africa
- 5.1. Saudi Arabia
- 5.2. United Arab Emirates
- 5.3. South Africa
- 5.4. Nigeria
- 5.5. Qatar
- 5.6. Egypt
- 5.7. Rest of the Middle East and Africa
Pumps Market REPORT HIGHLIGHTS
| Aspects | Details |
|---|---|
| Study Period | 2019-2033 |
| Base Year | 2024 |
| Estimated Year | 2025 |
| Forecast Period | 2025-2033 |
| Historical Period | 2019-2024 |
| Growth Rate | CAGR of 3.60% from 2019-2033 |
| Segmentation |
|
Table of Contents
- 1. Introduction
- 1.1. Research Scope
- 1.2. Market Segmentation
- 1.3. Research Methodology
- 1.4. Definitions and Assumptions
- 2. Executive Summary
- 2.1. Introduction
- 3. Market Dynamics
- 3.1. Introduction
- 3.2. Market Drivers
- 3.2.1. Increasing Infrastructure Development4.; Rising Emphasis Water and Wastewater Management
- 3.3. Market Restrains
- 3.3.1. Volatility in Raw Material Prices
- 3.4. Market Trends
- 3.4.1. Oil and Gas Sector Expected to Witness Significant Growth
- 4. Market Factor Analysis
- 4.1. Porters Five Forces
- 4.2. Supply/Value Chain
- 4.3. PESTEL analysis
- 4.4. Market Entropy
- 4.5. Patent/Trademark Analysis
- 5. Global Pumps Market Analysis, Insights and Forecast, 2019-2031
- 5.1. Market Analysis, Insights and Forecast - by Type
- 5.1.1. Centrifugal Pump
- 5.1.2. Positive Displacement Pump
- 5.2. Market Analysis, Insights and Forecast - by End User
- 5.2.1. Oil and Gas
- 5.2.2. Water and Wastewater
- 5.2.3. Chemicals and Petrochemicals
- 5.2.4. Mining Industry
- 5.2.5. Power Generation
- 5.2.6. Other End Users
- 5.3. Market Analysis, Insights and Forecast - by Region
- 5.3.1. North America
- 5.3.2. Europe
- 5.3.3. Asia Pacific
- 5.3.4. South America
- 5.3.5. Middle East and Africa
- 5.1. Market Analysis, Insights and Forecast - by Type
- 6. North America Pumps Market Analysis, Insights and Forecast, 2019-2031
- 6.1. Market Analysis, Insights and Forecast - by Type
- 6.1.1. Centrifugal Pump
- 6.1.2. Positive Displacement Pump
- 6.2. Market Analysis, Insights and Forecast - by End User
- 6.2.1. Oil and Gas
- 6.2.2. Water and Wastewater
- 6.2.3. Chemicals and Petrochemicals
- 6.2.4. Mining Industry
- 6.2.5. Power Generation
- 6.2.6. Other End Users
- 6.1. Market Analysis, Insights and Forecast - by Type
- 7. Europe Pumps Market Analysis, Insights and Forecast, 2019-2031
- 7.1. Market Analysis, Insights and Forecast - by Type
- 7.1.1. Centrifugal Pump
- 7.1.2. Positive Displacement Pump
- 7.2. Market Analysis, Insights and Forecast - by End User
- 7.2.1. Oil and Gas
- 7.2.2. Water and Wastewater
- 7.2.3. Chemicals and Petrochemicals
- 7.2.4. Mining Industry
- 7.2.5. Power Generation
- 7.2.6. Other End Users
- 7.1. Market Analysis, Insights and Forecast - by Type
- 8. Asia Pacific Pumps Market Analysis, Insights and Forecast, 2019-2031
- 8.1. Market Analysis, Insights and Forecast - by Type
- 8.1.1. Centrifugal Pump
- 8.1.2. Positive Displacement Pump
- 8.2. Market Analysis, Insights and Forecast - by End User
- 8.2.1. Oil and Gas
- 8.2.2. Water and Wastewater
- 8.2.3. Chemicals and Petrochemicals
- 8.2.4. Mining Industry
- 8.2.5. Power Generation
- 8.2.6. Other End Users
- 8.1. Market Analysis, Insights and Forecast - by Type
- 9. South America Pumps Market Analysis, Insights and Forecast, 2019-2031
- 9.1. Market Analysis, Insights and Forecast - by Type
- 9.1.1. Centrifugal Pump
- 9.1.2. Positive Displacement Pump
- 9.2. Market Analysis, Insights and Forecast - by End User
- 9.2.1. Oil and Gas
- 9.2.2. Water and Wastewater
- 9.2.3. Chemicals and Petrochemicals
- 9.2.4. Mining Industry
- 9.2.5. Power Generation
- 9.2.6. Other End Users
- 9.1. Market Analysis, Insights and Forecast - by Type
- 10. Middle East and Africa Pumps Market Analysis, Insights and Forecast, 2019-2031
- 10.1. Market Analysis, Insights and Forecast - by Type
- 10.1.1. Centrifugal Pump
- 10.1.2. Positive Displacement Pump
- 10.2. Market Analysis, Insights and Forecast - by End User
- 10.2.1. Oil and Gas
- 10.2.2. Water and Wastewater
- 10.2.3. Chemicals and Petrochemicals
- 10.2.4. Mining Industry
- 10.2.5. Power Generation
- 10.2.6. Other End Users
- 10.1. Market Analysis, Insights and Forecast - by Type
- 11. North America Pumps Market Analysis, Insights and Forecast, 2019-2031
- 11.1. Market Analysis, Insights and Forecast - By Country/Sub-region
- 11.1.1 United States
- 11.1.2 Canada
- 11.1.3 Mexico
- 12. Europe Pumps Market Analysis, Insights and Forecast, 2019-2031
- 12.1. Market Analysis, Insights and Forecast - By Country/Sub-region
- 12.1.1 Germany
- 12.1.2 United Kingdom
- 12.1.3 France
- 12.1.4 Spain
- 12.1.5 Italy
- 12.1.6 Spain
- 12.1.7 Belgium
- 12.1.8 Netherland
- 12.1.9 Nordics
- 12.1.10 Rest of Europe
- 13. Asia Pacific Pumps Market Analysis, Insights and Forecast, 2019-2031
- 13.1. Market Analysis, Insights and Forecast - By Country/Sub-region
- 13.1.1 China
- 13.1.2 Japan
- 13.1.3 India
- 13.1.4 South Korea
- 13.1.5 Southeast Asia
- 13.1.6 Australia
- 13.1.7 Indonesia
- 13.1.8 Phillipes
- 13.1.9 Singapore
- 13.1.10 Thailandc
- 13.1.11 Rest of Asia Pacific
- 14. South America Pumps Market Analysis, Insights and Forecast, 2019-2031
- 14.1. Market Analysis, Insights and Forecast - By Country/Sub-region
- 14.1.1 Brazil
- 14.1.2 Argentina
- 14.1.3 Peru
- 14.1.4 Chile
- 14.1.5 Colombia
- 14.1.6 Ecuador
- 14.1.7 Venezuela
- 14.1.8 Rest of South America
- 15. MEA Pumps Market Analysis, Insights and Forecast, 2019-2031
- 15.1. Market Analysis, Insights and Forecast - By Country/Sub-region
- 15.1.1 United Arab Emirates
- 15.1.2 Saudi Arabia
- 15.1.3 South Africa
- 15.1.4 Rest of Middle East and Africa
- 16. Competitive Analysis
- 16.1. Global Market Share Analysis 2024
- 16.2. Company Profiles
- 16.2.1 Sulzer Ltd
- 16.2.1.1. Overview
- 16.2.1.2. Products
- 16.2.1.3. SWOT Analysis
- 16.2.1.4. Recent Developments
- 16.2.1.5. Financials (Based on Availability)
- 16.2.2 Ebara Corporation
- 16.2.2.1. Overview
- 16.2.2.2. Products
- 16.2.2.3. SWOT Analysis
- 16.2.2.4. Recent Developments
- 16.2.2.5. Financials (Based on Availability)
- 16.2.3 Flowserve Corporation
- 16.2.3.1. Overview
- 16.2.3.2. Products
- 16.2.3.3. SWOT Analysis
- 16.2.3.4. Recent Developments
- 16.2.3.5. Financials (Based on Availability)
- 16.2.4 Weir Group PLC
- 16.2.4.1. Overview
- 16.2.4.2. Products
- 16.2.4.3. SWOT Analysis
- 16.2.4.4. Recent Developments
- 16.2.4.5. Financials (Based on Availability)
- 16.2.5 Dover Corporation*List Not Exhaustive 6 4 Market Ranking/Share (%) Analysi
- 16.2.5.1. Overview
- 16.2.5.2. Products
- 16.2.5.3. SWOT Analysis
- 16.2.5.4. Recent Developments
- 16.2.5.5. Financials (Based on Availability)
- 16.2.6 Clyde Union Inc
- 16.2.6.1. Overview
- 16.2.6.2. Products
- 16.2.6.3. SWOT Analysis
- 16.2.6.4. Recent Developments
- 16.2.6.5. Financials (Based on Availability)
- 16.2.7 Schlumberger Ltd
- 16.2.7.1. Overview
- 16.2.7.2. Products
- 16.2.7.3. SWOT Analysis
- 16.2.7.4. Recent Developments
- 16.2.7.5. Financials (Based on Availability)
- 16.2.8 KSB SE & Co KGaA
- 16.2.8.1. Overview
- 16.2.8.2. Products
- 16.2.8.3. SWOT Analysis
- 16.2.8.4. Recent Developments
- 16.2.8.5. Financials (Based on Availability)
- 16.2.9 ITT Inc
- 16.2.9.1. Overview
- 16.2.9.2. Products
- 16.2.9.3. SWOT Analysis
- 16.2.9.4. Recent Developments
- 16.2.9.5. Financials (Based on Availability)
- 16.2.10 Grundfos Holding AS
- 16.2.10.1. Overview
- 16.2.10.2. Products
- 16.2.10.3. SWOT Analysis
- 16.2.10.4. Recent Developments
- 16.2.10.5. Financials (Based on Availability)
- 16.2.11 Baker Hughes Company
- 16.2.11.1. Overview
- 16.2.11.2. Products
- 16.2.11.3. SWOT Analysis
- 16.2.11.4. Recent Developments
- 16.2.11.5. Financials (Based on Availability)
- 16.2.1 Sulzer Ltd
List of Figures
- Figure 1: Global Pumps Market Revenue Breakdown (Million, %) by Region 2024 & 2032
- Figure 2: Global Pumps Market Volume Breakdown (K Unit, %) by Region 2024 & 2032
- Figure 3: North America Pumps Market Revenue (Million), by Country 2024 & 2032
- Figure 4: North America Pumps Market Volume (K Unit), by Country 2024 & 2032
- Figure 5: North America Pumps Market Revenue Share (%), by Country 2024 & 2032
- Figure 6: North America Pumps Market Volume Share (%), by Country 2024 & 2032
- Figure 7: Europe Pumps Market Revenue (Million), by Country 2024 & 2032
- Figure 8: Europe Pumps Market Volume (K Unit), by Country 2024 & 2032
- Figure 9: Europe Pumps Market Revenue Share (%), by Country 2024 & 2032
- Figure 10: Europe Pumps Market Volume Share (%), by Country 2024 & 2032
- Figure 11: Asia Pacific Pumps Market Revenue (Million), by Country 2024 & 2032
- Figure 12: Asia Pacific Pumps Market Volume (K Unit), by Country 2024 & 2032
- Figure 13: Asia Pacific Pumps Market Revenue Share (%), by Country 2024 & 2032
- Figure 14: Asia Pacific Pumps Market Volume Share (%), by Country 2024 & 2032
- Figure 15: South America Pumps Market Revenue (Million), by Country 2024 & 2032
- Figure 16: South America Pumps Market Volume (K Unit), by Country 2024 & 2032
- Figure 17: South America Pumps Market Revenue Share (%), by Country 2024 & 2032
- Figure 18: South America Pumps Market Volume Share (%), by Country 2024 & 2032
- Figure 19: MEA Pumps Market Revenue (Million), by Country 2024 & 2032
- Figure 20: MEA Pumps Market Volume (K Unit), by Country 2024 & 2032
- Figure 21: MEA Pumps Market Revenue Share (%), by Country 2024 & 2032
- Figure 22: MEA Pumps Market Volume Share (%), by Country 2024 & 2032
- Figure 23: North America Pumps Market Revenue (Million), by Type 2024 & 2032
- Figure 24: North America Pumps Market Volume (K Unit), by Type 2024 & 2032
- Figure 25: North America Pumps Market Revenue Share (%), by Type 2024 & 2032
- Figure 26: North America Pumps Market Volume Share (%), by Type 2024 & 2032
- Figure 27: North America Pumps Market Revenue (Million), by End User 2024 & 2032
- Figure 28: North America Pumps Market Volume (K Unit), by End User 2024 & 2032
- Figure 29: North America Pumps Market Revenue Share (%), by End User 2024 & 2032
- Figure 30: North America Pumps Market Volume Share (%), by End User 2024 & 2032
- Figure 31: North America Pumps Market Revenue (Million), by Country 2024 & 2032
- Figure 32: North America Pumps Market Volume (K Unit), by Country 2024 & 2032
- Figure 33: North America Pumps Market Revenue Share (%), by Country 2024 & 2032
- Figure 34: North America Pumps Market Volume Share (%), by Country 2024 & 2032
- Figure 35: Europe Pumps Market Revenue (Million), by Type 2024 & 2032
- Figure 36: Europe Pumps Market Volume (K Unit), by Type 2024 & 2032
- Figure 37: Europe Pumps Market Revenue Share (%), by Type 2024 & 2032
- Figure 38: Europe Pumps Market Volume Share (%), by Type 2024 & 2032
- Figure 39: Europe Pumps Market Revenue (Million), by End User 2024 & 2032
- Figure 40: Europe Pumps Market Volume (K Unit), by End User 2024 & 2032
- Figure 41: Europe Pumps Market Revenue Share (%), by End User 2024 & 2032
- Figure 42: Europe Pumps Market Volume Share (%), by End User 2024 & 2032
- Figure 43: Europe Pumps Market Revenue (Million), by Country 2024 & 2032
- Figure 44: Europe Pumps Market Volume (K Unit), by Country 2024 & 2032
- Figure 45: Europe Pumps Market Revenue Share (%), by Country 2024 & 2032
- Figure 46: Europe Pumps Market Volume Share (%), by Country 2024 & 2032
- Figure 47: Asia Pacific Pumps Market Revenue (Million), by Type 2024 & 2032
- Figure 48: Asia Pacific Pumps Market Volume (K Unit), by Type 2024 & 2032
- Figure 49: Asia Pacific Pumps Market Revenue Share (%), by Type 2024 & 2032
- Figure 50: Asia Pacific Pumps Market Volume Share (%), by Type 2024 & 2032
- Figure 51: Asia Pacific Pumps Market Revenue (Million), by End User 2024 & 2032
- Figure 52: Asia Pacific Pumps Market Volume (K Unit), by End User 2024 & 2032
- Figure 53: Asia Pacific Pumps Market Revenue Share (%), by End User 2024 & 2032
- Figure 54: Asia Pacific Pumps Market Volume Share (%), by End User 2024 & 2032
- Figure 55: Asia Pacific Pumps Market Revenue (Million), by Country 2024 & 2032
- Figure 56: Asia Pacific Pumps Market Volume (K Unit), by Country 2024 & 2032
- Figure 57: Asia Pacific Pumps Market Revenue Share (%), by Country 2024 & 2032
- Figure 58: Asia Pacific Pumps Market Volume Share (%), by Country 2024 & 2032
- Figure 59: South America Pumps Market Revenue (Million), by Type 2024 & 2032
- Figure 60: South America Pumps Market Volume (K Unit), by Type 2024 & 2032
- Figure 61: South America Pumps Market Revenue Share (%), by Type 2024 & 2032
- Figure 62: South America Pumps Market Volume Share (%), by Type 2024 & 2032
- Figure 63: South America Pumps Market Revenue (Million), by End User 2024 & 2032
- Figure 64: South America Pumps Market Volume (K Unit), by End User 2024 & 2032
- Figure 65: South America Pumps Market Revenue Share (%), by End User 2024 & 2032
- Figure 66: South America Pumps Market Volume Share (%), by End User 2024 & 2032
- Figure 67: South America Pumps Market Revenue (Million), by Country 2024 & 2032
- Figure 68: South America Pumps Market Volume (K Unit), by Country 2024 & 2032
- Figure 69: South America Pumps Market Revenue Share (%), by Country 2024 & 2032
- Figure 70: South America Pumps Market Volume Share (%), by Country 2024 & 2032
- Figure 71: Middle East and Africa Pumps Market Revenue (Million), by Type 2024 & 2032
- Figure 72: Middle East and Africa Pumps Market Volume (K Unit), by Type 2024 & 2032
- Figure 73: Middle East and Africa Pumps Market Revenue Share (%), by Type 2024 & 2032
- Figure 74: Middle East and Africa Pumps Market Volume Share (%), by Type 2024 & 2032
- Figure 75: Middle East and Africa Pumps Market Revenue (Million), by End User 2024 & 2032
- Figure 76: Middle East and Africa Pumps Market Volume (K Unit), by End User 2024 & 2032
- Figure 77: Middle East and Africa Pumps Market Revenue Share (%), by End User 2024 & 2032
- Figure 78: Middle East and Africa Pumps Market Volume Share (%), by End User 2024 & 2032
- Figure 79: Middle East and Africa Pumps Market Revenue (Million), by Country 2024 & 2032
- Figure 80: Middle East and Africa Pumps Market Volume (K Unit), by Country 2024 & 2032
- Figure 81: Middle East and Africa Pumps Market Revenue Share (%), by Country 2024 & 2032
- Figure 82: Middle East and Africa Pumps Market Volume Share (%), by Country 2024 & 2032
List of Tables
- Table 1: Global Pumps Market Revenue Million Forecast, by Region 2019 & 2032
- Table 2: Global Pumps Market Volume K Unit Forecast, by Region 2019 & 2032
- Table 3: Global Pumps Market Revenue Million Forecast, by Type 2019 & 2032
- Table 4: Global Pumps Market Volume K Unit Forecast, by Type 2019 & 2032
- Table 5: Global Pumps Market Revenue Million Forecast, by End User 2019 & 2032
- Table 6: Global Pumps Market Volume K Unit Forecast, by End User 2019 & 2032
- Table 7: Global Pumps Market Revenue Million Forecast, by Region 2019 & 2032
- Table 8: Global Pumps Market Volume K Unit Forecast, by Region 2019 & 2032
- Table 9: Global Pumps Market Revenue Million Forecast, by Country 2019 & 2032
- Table 10: Global Pumps Market Volume K Unit Forecast, by Country 2019 & 2032
- Table 11: United States Pumps Market Revenue (Million) Forecast, by Application 2019 & 2032
- Table 12: United States Pumps Market Volume (K Unit) Forecast, by Application 2019 & 2032
- Table 13: Canada Pumps Market Revenue (Million) Forecast, by Application 2019 & 2032
- Table 14: Canada Pumps Market Volume (K Unit) Forecast, by Application 2019 & 2032
- Table 15: Mexico Pumps Market Revenue (Million) Forecast, by Application 2019 & 2032
- Table 16: Mexico Pumps Market Volume (K Unit) Forecast, by Application 2019 & 2032
- Table 17: Global Pumps Market Revenue Million Forecast, by Country 2019 & 2032
- Table 18: Global Pumps Market Volume K Unit Forecast, by Country 2019 & 2032
- Table 19: Germany Pumps Market Revenue (Million) Forecast, by Application 2019 & 2032
- Table 20: Germany Pumps Market Volume (K Unit) Forecast, by Application 2019 & 2032
- Table 21: United Kingdom Pumps Market Revenue (Million) Forecast, by Application 2019 & 2032
- Table 22: United Kingdom Pumps Market Volume (K Unit) Forecast, by Application 2019 & 2032
- Table 23: France Pumps Market Revenue (Million) Forecast, by Application 2019 & 2032
- Table 24: France Pumps Market Volume (K Unit) Forecast, by Application 2019 & 2032
- Table 25: Spain Pumps Market Revenue (Million) Forecast, by Application 2019 & 2032
- Table 26: Spain Pumps Market Volume (K Unit) Forecast, by Application 2019 & 2032
- Table 27: Italy Pumps Market Revenue (Million) Forecast, by Application 2019 & 2032
- Table 28: Italy Pumps Market Volume (K Unit) Forecast, by Application 2019 & 2032
- Table 29: Spain Pumps Market Revenue (Million) Forecast, by Application 2019 & 2032
- Table 30: Spain Pumps Market Volume (K Unit) Forecast, by Application 2019 & 2032
- Table 31: Belgium Pumps Market Revenue (Million) Forecast, by Application 2019 & 2032
- Table 32: Belgium Pumps Market Volume (K Unit) Forecast, by Application 2019 & 2032
- Table 33: Netherland Pumps Market Revenue (Million) Forecast, by Application 2019 & 2032
- Table 34: Netherland Pumps Market Volume (K Unit) Forecast, by Application 2019 & 2032
- Table 35: Nordics Pumps Market Revenue (Million) Forecast, by Application 2019 & 2032
- Table 36: Nordics Pumps Market Volume (K Unit) Forecast, by Application 2019 & 2032
- Table 37: Rest of Europe Pumps Market Revenue (Million) Forecast, by Application 2019 & 2032
- Table 38: Rest of Europe Pumps Market Volume (K Unit) Forecast, by Application 2019 & 2032
- Table 39: Global Pumps Market Revenue Million Forecast, by Country 2019 & 2032
- Table 40: Global Pumps Market Volume K Unit Forecast, by Country 2019 & 2032
- Table 41: China Pumps Market Revenue (Million) Forecast, by Application 2019 & 2032
- Table 42: China Pumps Market Volume (K Unit) Forecast, by Application 2019 & 2032
- Table 43: Japan Pumps Market Revenue (Million) Forecast, by Application 2019 & 2032
- Table 44: Japan Pumps Market Volume (K Unit) Forecast, by Application 2019 & 2032
- Table 45: India Pumps Market Revenue (Million) Forecast, by Application 2019 & 2032
- Table 46: India Pumps Market Volume (K Unit) Forecast, by Application 2019 & 2032
- Table 47: South Korea Pumps Market Revenue (Million) Forecast, by Application 2019 & 2032
- Table 48: South Korea Pumps Market Volume (K Unit) Forecast, by Application 2019 & 2032
- Table 49: Southeast Asia Pumps Market Revenue (Million) Forecast, by Application 2019 & 2032
- Table 50: Southeast Asia Pumps Market Volume (K Unit) Forecast, by Application 2019 & 2032
- Table 51: Australia Pumps Market Revenue (Million) Forecast, by Application 2019 & 2032
- Table 52: Australia Pumps Market Volume (K Unit) Forecast, by Application 2019 & 2032
- Table 53: Indonesia Pumps Market Revenue (Million) Forecast, by Application 2019 & 2032
- Table 54: Indonesia Pumps Market Volume (K Unit) Forecast, by Application 2019 & 2032
- Table 55: Phillipes Pumps Market Revenue (Million) Forecast, by Application 2019 & 2032
- Table 56: Phillipes Pumps Market Volume (K Unit) Forecast, by Application 2019 & 2032
- Table 57: Singapore Pumps Market Revenue (Million) Forecast, by Application 2019 & 2032
- Table 58: Singapore Pumps Market Volume (K Unit) Forecast, by Application 2019 & 2032
- Table 59: Thailandc Pumps Market Revenue (Million) Forecast, by Application 2019 & 2032
- Table 60: Thailandc Pumps Market Volume (K Unit) Forecast, by Application 2019 & 2032
- Table 61: Rest of Asia Pacific Pumps Market Revenue (Million) Forecast, by Application 2019 & 2032
- Table 62: Rest of Asia Pacific Pumps Market Volume (K Unit) Forecast, by Application 2019 & 2032
- Table 63: Global Pumps Market Revenue Million Forecast, by Country 2019 & 2032
- Table 64: Global Pumps Market Volume K Unit Forecast, by Country 2019 & 2032
- Table 65: Brazil Pumps Market Revenue (Million) Forecast, by Application 2019 & 2032
- Table 66: Brazil Pumps Market Volume (K Unit) Forecast, by Application 2019 & 2032
- Table 67: Argentina Pumps Market Revenue (Million) Forecast, by Application 2019 & 2032
- Table 68: Argentina Pumps Market Volume (K Unit) Forecast, by Application 2019 & 2032
- Table 69: Peru Pumps Market Revenue (Million) Forecast, by Application 2019 & 2032
- Table 70: Peru Pumps Market Volume (K Unit) Forecast, by Application 2019 & 2032
- Table 71: Chile Pumps Market Revenue (Million) Forecast, by Application 2019 & 2032
- Table 72: Chile Pumps Market Volume (K Unit) Forecast, by Application 2019 & 2032
- Table 73: Colombia Pumps Market Revenue (Million) Forecast, by Application 2019 & 2032
- Table 74: Colombia Pumps Market Volume (K Unit) Forecast, by Application 2019 & 2032
- Table 75: Ecuador Pumps Market Revenue (Million) Forecast, by Application 2019 & 2032
- Table 76: Ecuador Pumps Market Volume (K Unit) Forecast, by Application 2019 & 2032
- Table 77: Venezuela Pumps Market Revenue (Million) Forecast, by Application 2019 & 2032
- Table 78: Venezuela Pumps Market Volume (K Unit) Forecast, by Application 2019 & 2032
- Table 79: Rest of South America Pumps Market Revenue (Million) Forecast, by Application 2019 & 2032
- Table 80: Rest of South America Pumps Market Volume (K Unit) Forecast, by Application 2019 & 2032
- Table 81: Global Pumps Market Revenue Million Forecast, by Country 2019 & 2032
- Table 82: Global Pumps Market Volume K Unit Forecast, by Country 2019 & 2032
- Table 83: United Arab Emirates Pumps Market Revenue (Million) Forecast, by Application 2019 & 2032
- Table 84: United Arab Emirates Pumps Market Volume (K Unit) Forecast, by Application 2019 & 2032
- Table 85: Saudi Arabia Pumps Market Revenue (Million) Forecast, by Application 2019 & 2032
- Table 86: Saudi Arabia Pumps Market Volume (K Unit) Forecast, by Application 2019 & 2032
- Table 87: South Africa Pumps Market Revenue (Million) Forecast, by Application 2019 & 2032
- Table 88: South Africa Pumps Market Volume (K Unit) Forecast, by Application 2019 & 2032
- Table 89: Rest of Middle East and Africa Pumps Market Revenue (Million) Forecast, by Application 2019 & 2032
- Table 90: Rest of Middle East and Africa Pumps Market Volume (K Unit) Forecast, by Application 2019 & 2032
- Table 91: Global Pumps Market Revenue Million Forecast, by Type 2019 & 2032
- Table 92: Global Pumps Market Volume K Unit Forecast, by Type 2019 & 2032
- Table 93: Global Pumps Market Revenue Million Forecast, by End User 2019 & 2032
- Table 94: Global Pumps Market Volume K Unit Forecast, by End User 2019 & 2032
- Table 95: Global Pumps Market Revenue Million Forecast, by Country 2019 & 2032
- Table 96: Global Pumps Market Volume K Unit Forecast, by Country 2019 & 2032
- Table 97: United States Pumps Market Revenue (Million) Forecast, by Application 2019 & 2032
- Table 98: United States Pumps Market Volume (K Unit) Forecast, by Application 2019 & 2032
- Table 99: Canada Pumps Market Revenue (Million) Forecast, by Application 2019 & 2032
- Table 100: Canada Pumps Market Volume (K Unit) Forecast, by Application 2019 & 2032
- Table 101: Rest of North America Pumps Market Revenue (Million) Forecast, by Application 2019 & 2032
- Table 102: Rest of North America Pumps Market Volume (K Unit) Forecast, by Application 2019 & 2032
- Table 103: Global Pumps Market Revenue Million Forecast, by Type 2019 & 2032
- Table 104: Global Pumps Market Volume K Unit Forecast, by Type 2019 & 2032
- Table 105: Global Pumps Market Revenue Million Forecast, by End User 2019 & 2032
- Table 106: Global Pumps Market Volume K Unit Forecast, by End User 2019 & 2032
- Table 107: Global Pumps Market Revenue Million Forecast, by Country 2019 & 2032
- Table 108: Global Pumps Market Volume K Unit Forecast, by Country 2019 & 2032
- Table 109: Germany Pumps Market Revenue (Million) Forecast, by Application 2019 & 2032
- Table 110: Germany Pumps Market Volume (K Unit) Forecast, by Application 2019 & 2032
- Table 111: France Pumps Market Revenue (Million) Forecast, by Application 2019 & 2032
- Table 112: France Pumps Market Volume (K Unit) Forecast, by Application 2019 & 2032
- Table 113: Spain Pumps Market Revenue (Million) Forecast, by Application 2019 & 2032
- Table 114: Spain Pumps Market Volume (K Unit) Forecast, by Application 2019 & 2032
- Table 115: United Kingdom Pumps Market Revenue (Million) Forecast, by Application 2019 & 2032
- Table 116: United Kingdom Pumps Market Volume (K Unit) Forecast, by Application 2019 & 2032
- Table 117: Russia Pumps Market Revenue (Million) Forecast, by Application 2019 & 2032
- Table 118: Russia Pumps Market Volume (K Unit) Forecast, by Application 2019 & 2032
- Table 119: NORDIC Pumps Market Revenue (Million) Forecast, by Application 2019 & 2032
- Table 120: NORDIC Pumps Market Volume (K Unit) Forecast, by Application 2019 & 2032
- Table 121: Italy Pumps Market Revenue (Million) Forecast, by Application 2019 & 2032
- Table 122: Italy Pumps Market Volume (K Unit) Forecast, by Application 2019 & 2032
- Table 123: Turkey Pumps Market Revenue (Million) Forecast, by Application 2019 & 2032
- Table 124: Turkey Pumps Market Volume (K Unit) Forecast, by Application 2019 & 2032
- Table 125: Rest of Europe Pumps Market Revenue (Million) Forecast, by Application 2019 & 2032
- Table 126: Rest of Europe Pumps Market Volume (K Unit) Forecast, by Application 2019 & 2032
- Table 127: Global Pumps Market Revenue Million Forecast, by Type 2019 & 2032
- Table 128: Global Pumps Market Volume K Unit Forecast, by Type 2019 & 2032
- Table 129: Global Pumps Market Revenue Million Forecast, by End User 2019 & 2032
- Table 130: Global Pumps Market Volume K Unit Forecast, by End User 2019 & 2032
- Table 131: Global Pumps Market Revenue Million Forecast, by Country 2019 & 2032
- Table 132: Global Pumps Market Volume K Unit Forecast, by Country 2019 & 2032
- Table 133: China Pumps Market Revenue (Million) Forecast, by Application 2019 & 2032
- Table 134: China Pumps Market Volume (K Unit) Forecast, by Application 2019 & 2032
- Table 135: India Pumps Market Revenue (Million) Forecast, by Application 2019 & 2032
- Table 136: India Pumps Market Volume (K Unit) Forecast, by Application 2019 & 2032
- Table 137: Japan Pumps Market Revenue (Million) Forecast, by Application 2019 & 2032
- Table 138: Japan Pumps Market Volume (K Unit) Forecast, by Application 2019 & 2032
- Table 139: South Korea Pumps Market Revenue (Million) Forecast, by Application 2019 & 2032
- Table 140: South Korea Pumps Market Volume (K Unit) Forecast, by Application 2019 & 2032
- Table 141: Australia Pumps Market Revenue (Million) Forecast, by Application 2019 & 2032
- Table 142: Australia Pumps Market Volume (K Unit) Forecast, by Application 2019 & 2032
- Table 143: Malaysia Pumps Market Revenue (Million) Forecast, by Application 2019 & 2032
- Table 144: Malaysia Pumps Market Volume (K Unit) Forecast, by Application 2019 & 2032
- Table 145: Thailand Pumps Market Revenue (Million) Forecast, by Application 2019 & 2032
- Table 146: Thailand Pumps Market Volume (K Unit) Forecast, by Application 2019 & 2032
- Table 147: Indonesia Pumps Market Revenue (Million) Forecast, by Application 2019 & 2032
- Table 148: Indonesia Pumps Market Volume (K Unit) Forecast, by Application 2019 & 2032
- Table 149: Vietnam Pumps Market Revenue (Million) Forecast, by Application 2019 & 2032
- Table 150: Vietnam Pumps Market Volume (K Unit) Forecast, by Application 2019 & 2032
- Table 151: Rest of Asia Pacific Pumps Market Revenue (Million) Forecast, by Application 2019 & 2032
- Table 152: Rest of Asia Pacific Pumps Market Volume (K Unit) Forecast, by Application 2019 & 2032
- Table 153: Global Pumps Market Revenue Million Forecast, by Type 2019 & 2032
- Table 154: Global Pumps Market Volume K Unit Forecast, by Type 2019 & 2032
- Table 155: Global Pumps Market Revenue Million Forecast, by End User 2019 & 2032
- Table 156: Global Pumps Market Volume K Unit Forecast, by End User 2019 & 2032
- Table 157: Global Pumps Market Revenue Million Forecast, by Country 2019 & 2032
- Table 158: Global Pumps Market Volume K Unit Forecast, by Country 2019 & 2032
- Table 159: Brazil Pumps Market Revenue (Million) Forecast, by Application 2019 & 2032
- Table 160: Brazil Pumps Market Volume (K Unit) Forecast, by Application 2019 & 2032
- Table 161: Argentina Pumps Market Revenue (Million) Forecast, by Application 2019 & 2032
- Table 162: Argentina Pumps Market Volume (K Unit) Forecast, by Application 2019 & 2032
- Table 163: Colombia Pumps Market Revenue (Million) Forecast, by Application 2019 & 2032
- Table 164: Colombia Pumps Market Volume (K Unit) Forecast, by Application 2019 & 2032
- Table 165: Rest of South America Pumps Market Revenue (Million) Forecast, by Application 2019 & 2032
- Table 166: Rest of South America Pumps Market Volume (K Unit) Forecast, by Application 2019 & 2032
- Table 167: Global Pumps Market Revenue Million Forecast, by Type 2019 & 2032
- Table 168: Global Pumps Market Volume K Unit Forecast, by Type 2019 & 2032
- Table 169: Global Pumps Market Revenue Million Forecast, by End User 2019 & 2032
- Table 170: Global Pumps Market Volume K Unit Forecast, by End User 2019 & 2032
- Table 171: Global Pumps Market Revenue Million Forecast, by Country 2019 & 2032
- Table 172: Global Pumps Market Volume K Unit Forecast, by Country 2019 & 2032
- Table 173: Saudi Arabia Pumps Market Revenue (Million) Forecast, by Application 2019 & 2032
- Table 174: Saudi Arabia Pumps Market Volume (K Unit) Forecast, by Application 2019 & 2032
- Table 175: United Arab Emirates Pumps Market Revenue (Million) Forecast, by Application 2019 & 2032
- Table 176: United Arab Emirates Pumps Market Volume (K Unit) Forecast, by Application 2019 & 2032
- Table 177: South Africa Pumps Market Revenue (Million) Forecast, by Application 2019 & 2032
- Table 178: South Africa Pumps Market Volume (K Unit) Forecast, by Application 2019 & 2032
- Table 179: Nigeria Pumps Market Revenue (Million) Forecast, by Application 2019 & 2032
- Table 180: Nigeria Pumps Market Volume (K Unit) Forecast, by Application 2019 & 2032
- Table 181: Qatar Pumps Market Revenue (Million) Forecast, by Application 2019 & 2032
- Table 182: Qatar Pumps Market Volume (K Unit) Forecast, by Application 2019 & 2032
- Table 183: Egypt Pumps Market Revenue (Million) Forecast, by Application 2019 & 2032
- Table 184: Egypt Pumps Market Volume (K Unit) Forecast, by Application 2019 & 2032
- Table 185: Rest of the Middle East and Africa Pumps Market Revenue (Million) Forecast, by Application 2019 & 2032
- Table 186: Rest of the Middle East and Africa Pumps Market Volume (K Unit) Forecast, by Application 2019 & 2032
Frequently Asked Questions
1. What is the projected Compound Annual Growth Rate (CAGR) of the Pumps Market?
The projected CAGR is approximately 3.60%.
2. Which companies are prominent players in the Pumps Market?
Key companies in the market include Sulzer Ltd, Ebara Corporation, Flowserve Corporation, Weir Group PLC, Dover Corporation*List Not Exhaustive 6 4 Market Ranking/Share (%) Analysi, Clyde Union Inc, Schlumberger Ltd, KSB SE & Co KGaA, ITT Inc, Grundfos Holding AS, Baker Hughes Company.
3. What are the main segments of the Pumps Market?
The market segments include Type, End User.
4. Can you provide details about the market size?
The market size is estimated to be USD 110.22 Million as of 2022.
5. What are some drivers contributing to market growth?
Increasing Infrastructure Development4.; Rising Emphasis Water and Wastewater Management.
6. What are the notable trends driving market growth?
Oil and Gas Sector Expected to Witness Significant Growth.
7. Are there any restraints impacting market growth?
Volatility in Raw Material Prices.
8. Can you provide examples of recent developments in the market?
December 2023: The Packo Pumps website merged with the Verder Liquids website. The collaboration aims to reinforce the relationship between Verder and Packo and provide customers with a broader range of pump technologies.
9. What pricing options are available for accessing the report?
Pricing options include single-user, multi-user, and enterprise licenses priced at USD 4750, USD 5250, and USD 8750 respectively.
10. Is the market size provided in terms of value or volume?
The market size is provided in terms of value, measured in Million and volume, measured in K Unit.
11. Are there any specific market keywords associated with the report?
Yes, the market keyword associated with the report is "Pumps Market," which aids in identifying and referencing the specific market segment covered.
12. How do I determine which pricing option suits my needs best?
The pricing options vary based on user requirements and access needs. Individual users may opt for single-user licenses, while businesses requiring broader access may choose multi-user or enterprise licenses for cost-effective access to the report.
13. Are there any additional resources or data provided in the Pumps Market report?
While the report offers comprehensive insights, it's advisable to review the specific contents or supplementary materials provided to ascertain if additional resources or data are available.
14. How can I stay updated on further developments or reports in the Pumps Market?
To stay informed about further developments, trends, and reports in the Pumps Market, consider subscribing to industry newsletters, following relevant companies and organizations, or regularly checking reputable industry news sources and publications.
Methodology
Step 1 - Identification of Relevant Samples Size from Population Database


Step 2 - Approaches for Defining Global Market Size (Value, Volume* & Price*)

Note*: In applicable scenarios
Step 3 - Data Sources
Primary Research
- Web Analytics
- Survey Reports
- Research Institute
- Latest Research Reports
- Opinion Leaders
Secondary Research
- Annual Reports
- White Paper
- Latest Press Release
- Industry Association
- Paid Database
- Investor Presentations

Step 4 - Data Triangulation
Involves using different sources of information in order to increase the validity of a study
These sources are likely to be stakeholders in a program - participants, other researchers, program staff, other community members, and so on.
Then we put all data in single framework & apply various statistical tools to find out the dynamic on the market.
During the analysis stage, feedback from the stakeholder groups would be compared to determine areas of agreement as well as areas of divergence
