

Key Insights
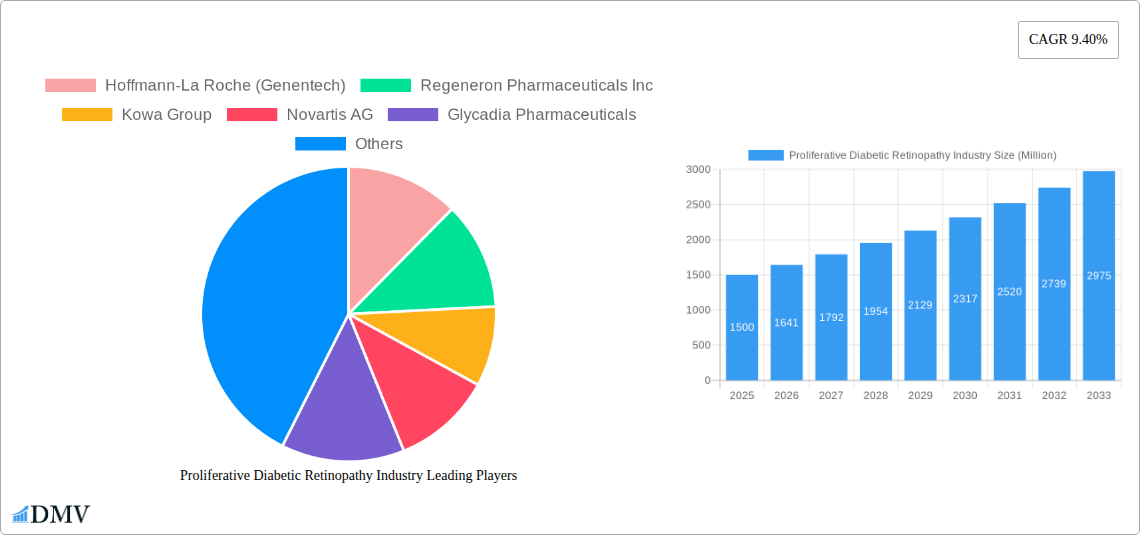
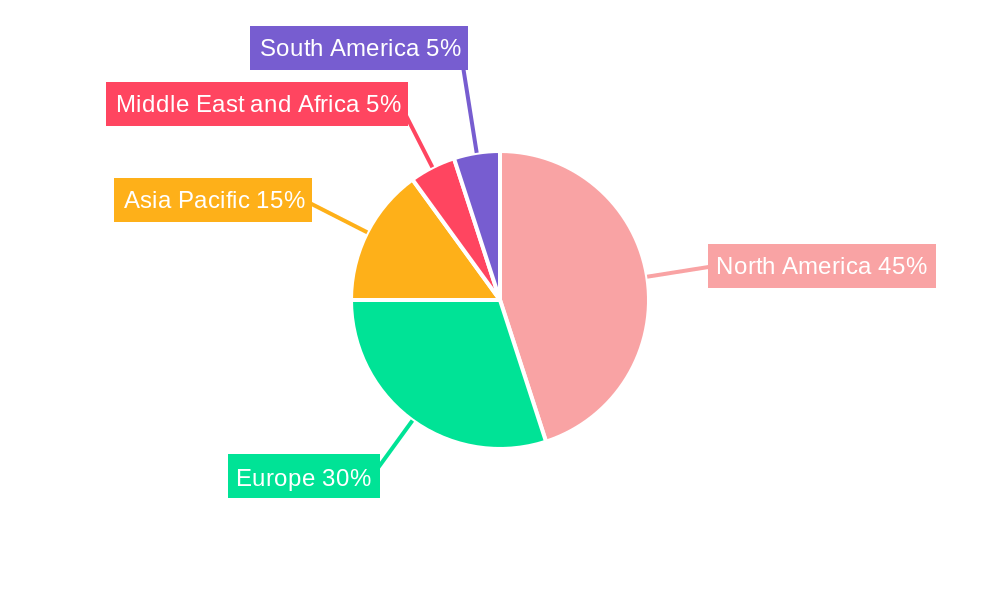
The proliferative diabetic retinopathy (PDR) market, valued at approximately $XX million in 2025, is projected to experience robust growth, exhibiting a compound annual growth rate (CAGR) of 9.40% from 2025 to 2033. This expansion is driven by several key factors. The rising prevalence of diabetes globally, coupled with an aging population increasingly susceptible to diabetic complications like PDR, significantly fuels market demand. Technological advancements in diagnostic tools and treatment modalities, including the development of more effective anti-VEGF agents and refined laser surgery techniques, contribute to improved patient outcomes and market growth. Furthermore, increased healthcare spending and growing awareness of PDR among both patients and healthcare professionals are fostering greater access to diagnosis and treatment, further bolstering market expansion. However, high treatment costs, particularly for advanced therapies like anti-VEGF injections, pose a significant restraint to market penetration, especially in low- and middle-income countries. The market is segmented by treatment type, encompassing anti-VEGF agents (holding a substantial market share due to their efficacy), corticosteroids, laser surgery, and other therapeutic approaches. Geographic analysis reveals strong growth in North America and Europe, driven by advanced healthcare infrastructure and high awareness. However, the Asia-Pacific region is expected to witness significant growth in the coming years, fueled by the increasing prevalence of diabetes and rising disposable incomes.
The competitive landscape is characterized by the presence of major pharmaceutical companies such as Hoffmann-La Roche (Genentech), Regeneron Pharmaceuticals Inc., and Novartis AG, alongside several smaller specialized players. These companies are engaged in ongoing research and development efforts to introduce novel therapies and improve existing treatments. Future market growth will depend heavily on the continued innovation in treatment options, improved affordability, and successful public health initiatives aimed at early detection and management of diabetes and its associated complications. The market is poised for continued expansion as the need for effective PDR management continues to rise globally. Strategic partnerships and collaborations between pharmaceutical companies and healthcare providers will play a critical role in expanding access to treatment and ensuring better patient outcomes.
Proliferative Diabetic Retinopathy Industry Market Report: 2019-2033
This comprehensive report provides an in-depth analysis of the Proliferative Diabetic Retinopathy (PDR) industry, offering invaluable insights for stakeholders seeking to navigate this dynamic market. The study period spans 2019-2033, with 2025 serving as both the base and estimated year. The forecast period extends from 2025-2033, encompassing historical data from 2019-2024. The report meticulously analyzes market size, segmentation by treatment type (Anti-VEGF Agents, Corticosteroids, Laser Surgery, Others), leading players, and future growth projections, valued in Millions.
Proliferative Diabetic Retinopathy Industry Market Composition & Trends
This section evaluates the competitive landscape, innovation drivers, regulatory frameworks, and market dynamics within the PDR industry. The market is characterized by a moderate level of concentration, with key players like Hoffmann-La Roche (Genentech), Regeneron Pharmaceuticals Inc, and Novartis AG holding significant market share. The xx% market share held by the top three players reflects a competitive but not overly saturated environment. Innovation is driven by the continuous development of novel therapies and treatment approaches, particularly within Anti-VEGF agents. Regulatory landscapes vary across geographies, influencing market access and pricing strategies. Substitute products, while limited, include alternative surgical techniques and supportive care measures. M&A activities have contributed to market consolidation, with deal values exceeding xx Million in recent years, reflecting the industry's strong growth potential. End-user profiles primarily consist of ophthalmologists and specialized eye care centers.
- Market Concentration: Moderately concentrated, top 3 players holding approximately xx% market share.
- Innovation Catalysts: Advancements in Anti-VEGF agents and novel drug delivery systems.
- Regulatory Landscape: Varying regulations across geographies influencing market access.
- Substitute Products: Limited, mainly alternative surgical techniques and supportive care.
- M&A Activity: Significant deals exceeding xx Million in recent years.
- End-User Profile: Ophthalmologists and specialized eye care centers.
Proliferative Diabetic Retinopathy Industry Industry Evolution
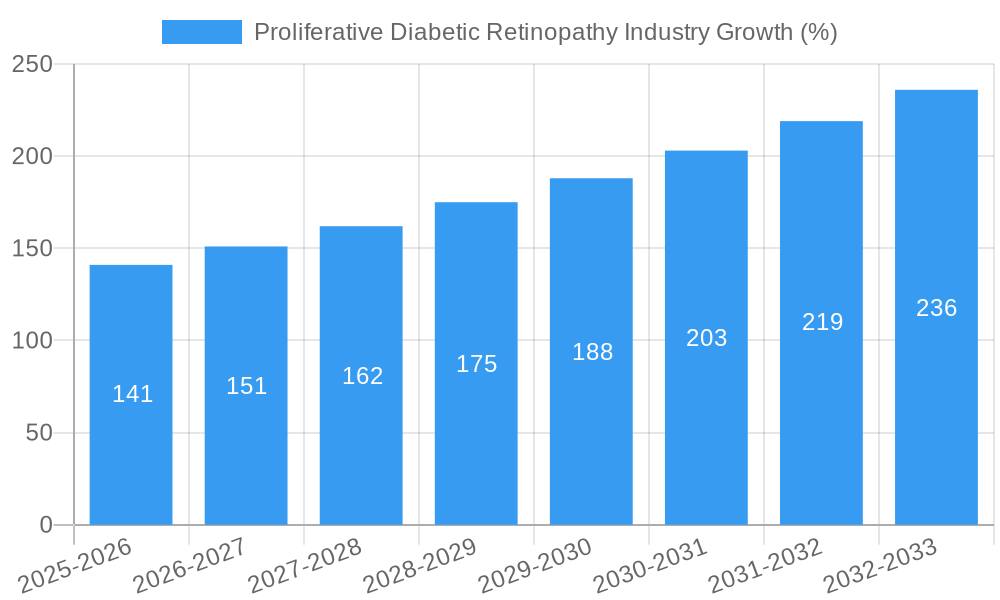
The PDR market has witnessed significant evolution, driven by technological advancements and changing treatment paradigms. The global market exhibited a Compound Annual Growth Rate (CAGR) of xx% during the historical period (2019-2024), projected to reach xx Million by 2025 and further grow at a CAGR of xx% during the forecast period (2025-2033), reaching xx Million by 2033. This growth is largely fueled by increasing prevalence of diabetes, improved diagnostic capabilities, and the introduction of more effective therapies. Technological advancements, particularly in drug delivery mechanisms and imaging techniques, have significantly improved treatment outcomes. Patient demand for less invasive and more effective treatments is also driving market growth. The adoption rate of Anti-VEGF agents has increased significantly, surpassing xx% in 2024, highlighting their effectiveness and widespread use. The increasing awareness of PDR and improved access to healthcare in developing economies also contribute to market expansion.
Leading Regions, Countries, or Segments in Proliferative Diabetic Retinopathy Industry
North America currently dominates the PDR market, driven by high prevalence of diabetes, advanced healthcare infrastructure, and strong regulatory support. Within treatment types, Anti-VEGF agents represent the largest segment, accounting for xx% of the market in 2024.
Key Drivers for North American Dominance:
- High prevalence of diabetes.
- Robust healthcare infrastructure and access to advanced therapies.
- Strong regulatory support and reimbursement policies.
- High investment in research and development.
Key Drivers for Anti-VEGF Agent Segment Dominance:
- Superior efficacy compared to other treatment modalities.
- Growing adoption rate due to improved outcomes and reduced invasiveness.
- Ongoing research and development leading to new and improved formulations.
Proliferative Diabetic Retinopathy Industry Product Innovations
Recent innovations in PDR treatment focus on improving efficacy, reducing side effects, and enhancing convenience. Novel formulations of Anti-VEGF agents with extended duration of action are gaining popularity, reducing the frequency of injections. Advanced drug delivery systems, including sustained-release implants, are also being developed to improve patient compliance and reduce treatment burden. These innovations represent significant advancements in PDR management, offering superior outcomes and improved quality of life for patients.
Propelling Factors for Proliferative Diabetic Retinopathy Industry Growth
The PDR market's growth is fueled by several factors, including the rising prevalence of diabetes globally, technological advancements in treatment modalities, increasing awareness about PDR among patients and healthcare professionals, and favorable regulatory support for new therapies. Economic factors such as growing healthcare spending and insurance coverage further contribute to market expansion. The development of more effective and less invasive treatments also drives growth.
Obstacles in the Proliferative Diabetic Retinopathy Industry Market
Despite the significant growth potential, the PDR market faces challenges. High treatment costs, limited access to healthcare in certain regions, potential side effects associated with certain therapies, and complexities in regulatory approvals represent significant barriers to market expansion. Supply chain disruptions and intense competition among established players also pose challenges.
Future Opportunities in Proliferative Diabetic Retinopathy Industry
Future opportunities in the PDR market include the development of novel therapies with enhanced efficacy and safety profiles, expansion into underserved markets, and the development of personalized medicine approaches. The potential for innovative drug delivery systems, such as gene therapy, also presents significant growth opportunities.
Major Players in the Proliferative Diabetic Retinopathy Industry Ecosystem
- Hoffmann-La Roche (Genentech)
- Regeneron Pharmaceuticals Inc
- Kowa Group
- Novartis AG
- Glycadia Pharmaceuticals
- Oxurion NV
- Alimera Sciences
- Allergan Plc
- BCN Peptides
Key Developments in Proliferative Diabetic Retinopathy Industry Industry
- 2022-Q4: Regeneron Pharmaceuticals announces positive phase III clinical trial results for a new Anti-VEGF agent.
- 2023-Q1: Novartis AG launches a new sustained-release implant for PDR treatment.
- 2024-Q2: A strategic partnership is formed between two major players to accelerate development of a novel therapy.
Strategic Proliferative Diabetic Retinopathy Industry Market Forecast
The PDR market is poised for robust growth, driven by ongoing innovation, expanding treatment access, and increasing awareness. The focus on developing next-generation therapies and personalized medicine approaches will continue to shape market dynamics, unlocking significant growth potential across various regions. The market is expected to witness further consolidation through M&A activities as key players strive to enhance their market presence and treatment portfolios.
Proliferative Diabetic Retinopathy Industry Segmentation
-
1. Treatment Type
- 1.1. Anti-VEGF Agents
- 1.2. Corticosteroids
- 1.3. Laser Surgery
- 1.4. Others
Proliferative Diabetic Retinopathy Industry Segmentation By Geography
-
1. North America
- 1.1. United States
- 1.2. Canada
- 1.3. Mexico
-
2. Europe
- 2.1. Germany
- 2.2. United Kingdom
- 2.3. France
- 2.4. Italy
- 2.5. Spain
- 2.6. Rest of Europe
-
3. Asia Pacific
- 3.1. China
- 3.2. Japan
- 3.3. India
- 3.4. Australia
- 3.5. South Korea
- 3.6. Rest of Asia Pacific
-
4. Middle East and Africa
- 4.1. GCC
- 4.2. South Africa
- 4.3. Rest of Middle East and Africa
-
5. South America
- 5.1. Brazil
- 5.2. Argentina
- 5.3. Rest of South America
Proliferative Diabetic Retinopathy Industry REPORT HIGHLIGHTS
| Aspects | Details |
|---|---|
| Study Period | 2019-2033 |
| Base Year | 2024 |
| Estimated Year | 2025 |
| Forecast Period | 2025-2033 |
| Historical Period | 2019-2024 |
| Growth Rate | CAGR of 9.40% from 2019-2033 |
| Segmentation |
|
Table of Contents
- 1. Introduction
- 1.1. Research Scope
- 1.2. Market Segmentation
- 1.3. Research Methodology
- 1.4. Definitions and Assumptions
- 2. Executive Summary
- 2.1. Introduction
- 3. Market Dynamics
- 3.1. Introduction
- 3.2. Market Drivers
- 3.2.1. ; Rising Prevalence of Diabetes Increases Risk of Diabetic Retinopathy; Availability of Advanced Technology and Minimally Invasive Laser Technique
- 3.3. Market Restrains
- 3.3.1. ; Extended Approval Time for Drugs
- 3.4. Market Trends
- 3.4.1. Anti-VEGF Agents Segment is Expected to Witness a Healthy CAGR
- 4. Market Factor Analysis
- 4.1. Porters Five Forces
- 4.2. Supply/Value Chain
- 4.3. PESTEL analysis
- 4.4. Market Entropy
- 4.5. Patent/Trademark Analysis
- 5. Global Proliferative Diabetic Retinopathy Industry Analysis, Insights and Forecast, 2019-2031
- 5.1. Market Analysis, Insights and Forecast - by Treatment Type
- 5.1.1. Anti-VEGF Agents
- 5.1.2. Corticosteroids
- 5.1.3. Laser Surgery
- 5.1.4. Others
- 5.2. Market Analysis, Insights and Forecast - by Region
- 5.2.1. North America
- 5.2.2. Europe
- 5.2.3. Asia Pacific
- 5.2.4. Middle East and Africa
- 5.2.5. South America
- 5.1. Market Analysis, Insights and Forecast - by Treatment Type
- 6. North America Proliferative Diabetic Retinopathy Industry Analysis, Insights and Forecast, 2019-2031
- 6.1. Market Analysis, Insights and Forecast - by Treatment Type
- 6.1.1. Anti-VEGF Agents
- 6.1.2. Corticosteroids
- 6.1.3. Laser Surgery
- 6.1.4. Others
- 6.1. Market Analysis, Insights and Forecast - by Treatment Type
- 7. Europe Proliferative Diabetic Retinopathy Industry Analysis, Insights and Forecast, 2019-2031
- 7.1. Market Analysis, Insights and Forecast - by Treatment Type
- 7.1.1. Anti-VEGF Agents
- 7.1.2. Corticosteroids
- 7.1.3. Laser Surgery
- 7.1.4. Others
- 7.1. Market Analysis, Insights and Forecast - by Treatment Type
- 8. Asia Pacific Proliferative Diabetic Retinopathy Industry Analysis, Insights and Forecast, 2019-2031
- 8.1. Market Analysis, Insights and Forecast - by Treatment Type
- 8.1.1. Anti-VEGF Agents
- 8.1.2. Corticosteroids
- 8.1.3. Laser Surgery
- 8.1.4. Others
- 8.1. Market Analysis, Insights and Forecast - by Treatment Type
- 9. Middle East and Africa Proliferative Diabetic Retinopathy Industry Analysis, Insights and Forecast, 2019-2031
- 9.1. Market Analysis, Insights and Forecast - by Treatment Type
- 9.1.1. Anti-VEGF Agents
- 9.1.2. Corticosteroids
- 9.1.3. Laser Surgery
- 9.1.4. Others
- 9.1. Market Analysis, Insights and Forecast - by Treatment Type
- 10. South America Proliferative Diabetic Retinopathy Industry Analysis, Insights and Forecast, 2019-2031
- 10.1. Market Analysis, Insights and Forecast - by Treatment Type
- 10.1.1. Anti-VEGF Agents
- 10.1.2. Corticosteroids
- 10.1.3. Laser Surgery
- 10.1.4. Others
- 10.1. Market Analysis, Insights and Forecast - by Treatment Type
- 11. North America Proliferative Diabetic Retinopathy Industry Analysis, Insights and Forecast, 2019-2031
- 11.1. Market Analysis, Insights and Forecast - By Country/Sub-region
- 11.1.1 United States
- 11.1.2 Canada
- 11.1.3 Mexico
- 12. Europe Proliferative Diabetic Retinopathy Industry Analysis, Insights and Forecast, 2019-2031
- 12.1. Market Analysis, Insights and Forecast - By Country/Sub-region
- 12.1.1 Germany
- 12.1.2 United Kingdom
- 12.1.3 France
- 12.1.4 Italy
- 12.1.5 Spain
- 12.1.6 Rest of Europe
- 13. Asia Pacific Proliferative Diabetic Retinopathy Industry Analysis, Insights and Forecast, 2019-2031
- 13.1. Market Analysis, Insights and Forecast - By Country/Sub-region
- 13.1.1 China
- 13.1.2 Japan
- 13.1.3 India
- 13.1.4 Australia
- 13.1.5 South Korea
- 13.1.6 Rest of Asia Pacific
- 14. Middle East and Africa Proliferative Diabetic Retinopathy Industry Analysis, Insights and Forecast, 2019-2031
- 14.1. Market Analysis, Insights and Forecast - By Country/Sub-region
- 14.1.1 GCC
- 14.1.2 South Africa
- 14.1.3 Rest of Middle East and Africa
- 15. South America Proliferative Diabetic Retinopathy Industry Analysis, Insights and Forecast, 2019-2031
- 15.1. Market Analysis, Insights and Forecast - By Country/Sub-region
- 15.1.1 Brazil
- 15.1.2 Argentina
- 15.1.3 Rest of South America
- 16. Competitive Analysis
- 16.1. Global Market Share Analysis 2024
- 16.2. Company Profiles
- 16.2.1 Hoffmann-La Roche (Genentech)
- 16.2.1.1. Overview
- 16.2.1.2. Products
- 16.2.1.3. SWOT Analysis
- 16.2.1.4. Recent Developments
- 16.2.1.5. Financials (Based on Availability)
- 16.2.2 Regeneron Pharmaceuticals Inc
- 16.2.2.1. Overview
- 16.2.2.2. Products
- 16.2.2.3. SWOT Analysis
- 16.2.2.4. Recent Developments
- 16.2.2.5. Financials (Based on Availability)
- 16.2.3 Kowa Group
- 16.2.3.1. Overview
- 16.2.3.2. Products
- 16.2.3.3. SWOT Analysis
- 16.2.3.4. Recent Developments
- 16.2.3.5. Financials (Based on Availability)
- 16.2.4 Novartis AG
- 16.2.4.1. Overview
- 16.2.4.2. Products
- 16.2.4.3. SWOT Analysis
- 16.2.4.4. Recent Developments
- 16.2.4.5. Financials (Based on Availability)
- 16.2.5 Glycadia Pharmaceuticals
- 16.2.5.1. Overview
- 16.2.5.2. Products
- 16.2.5.3. SWOT Analysis
- 16.2.5.4. Recent Developments
- 16.2.5.5. Financials (Based on Availability)
- 16.2.6 Oxurion NV
- 16.2.6.1. Overview
- 16.2.6.2. Products
- 16.2.6.3. SWOT Analysis
- 16.2.6.4. Recent Developments
- 16.2.6.5. Financials (Based on Availability)
- 16.2.7 Alimera Sciences
- 16.2.7.1. Overview
- 16.2.7.2. Products
- 16.2.7.3. SWOT Analysis
- 16.2.7.4. Recent Developments
- 16.2.7.5. Financials (Based on Availability)
- 16.2.8 Allergan Plc
- 16.2.8.1. Overview
- 16.2.8.2. Products
- 16.2.8.3. SWOT Analysis
- 16.2.8.4. Recent Developments
- 16.2.8.5. Financials (Based on Availability)
- 16.2.9 BCN Peptides
- 16.2.9.1. Overview
- 16.2.9.2. Products
- 16.2.9.3. SWOT Analysis
- 16.2.9.4. Recent Developments
- 16.2.9.5. Financials (Based on Availability)
- 16.2.1 Hoffmann-La Roche (Genentech)
List of Figures
- Figure 1: Global Proliferative Diabetic Retinopathy Industry Revenue Breakdown (Million, %) by Region 2024 & 2032
- Figure 2: Global Proliferative Diabetic Retinopathy Industry Volume Breakdown (K Unit, %) by Region 2024 & 2032
- Figure 3: North America Proliferative Diabetic Retinopathy Industry Revenue (Million), by Country 2024 & 2032
- Figure 4: North America Proliferative Diabetic Retinopathy Industry Volume (K Unit), by Country 2024 & 2032
- Figure 5: North America Proliferative Diabetic Retinopathy Industry Revenue Share (%), by Country 2024 & 2032
- Figure 6: North America Proliferative Diabetic Retinopathy Industry Volume Share (%), by Country 2024 & 2032
- Figure 7: Europe Proliferative Diabetic Retinopathy Industry Revenue (Million), by Country 2024 & 2032
- Figure 8: Europe Proliferative Diabetic Retinopathy Industry Volume (K Unit), by Country 2024 & 2032
- Figure 9: Europe Proliferative Diabetic Retinopathy Industry Revenue Share (%), by Country 2024 & 2032
- Figure 10: Europe Proliferative Diabetic Retinopathy Industry Volume Share (%), by Country 2024 & 2032
- Figure 11: Asia Pacific Proliferative Diabetic Retinopathy Industry Revenue (Million), by Country 2024 & 2032
- Figure 12: Asia Pacific Proliferative Diabetic Retinopathy Industry Volume (K Unit), by Country 2024 & 2032
- Figure 13: Asia Pacific Proliferative Diabetic Retinopathy Industry Revenue Share (%), by Country 2024 & 2032
- Figure 14: Asia Pacific Proliferative Diabetic Retinopathy Industry Volume Share (%), by Country 2024 & 2032
- Figure 15: Middle East and Africa Proliferative Diabetic Retinopathy Industry Revenue (Million), by Country 2024 & 2032
- Figure 16: Middle East and Africa Proliferative Diabetic Retinopathy Industry Volume (K Unit), by Country 2024 & 2032
- Figure 17: Middle East and Africa Proliferative Diabetic Retinopathy Industry Revenue Share (%), by Country 2024 & 2032
- Figure 18: Middle East and Africa Proliferative Diabetic Retinopathy Industry Volume Share (%), by Country 2024 & 2032
- Figure 19: South America Proliferative Diabetic Retinopathy Industry Revenue (Million), by Country 2024 & 2032
- Figure 20: South America Proliferative Diabetic Retinopathy Industry Volume (K Unit), by Country 2024 & 2032
- Figure 21: South America Proliferative Diabetic Retinopathy Industry Revenue Share (%), by Country 2024 & 2032
- Figure 22: South America Proliferative Diabetic Retinopathy Industry Volume Share (%), by Country 2024 & 2032
- Figure 23: North America Proliferative Diabetic Retinopathy Industry Revenue (Million), by Treatment Type 2024 & 2032
- Figure 24: North America Proliferative Diabetic Retinopathy Industry Volume (K Unit), by Treatment Type 2024 & 2032
- Figure 25: North America Proliferative Diabetic Retinopathy Industry Revenue Share (%), by Treatment Type 2024 & 2032
- Figure 26: North America Proliferative Diabetic Retinopathy Industry Volume Share (%), by Treatment Type 2024 & 2032
- Figure 27: North America Proliferative Diabetic Retinopathy Industry Revenue (Million), by Country 2024 & 2032
- Figure 28: North America Proliferative Diabetic Retinopathy Industry Volume (K Unit), by Country 2024 & 2032
- Figure 29: North America Proliferative Diabetic Retinopathy Industry Revenue Share (%), by Country 2024 & 2032
- Figure 30: North America Proliferative Diabetic Retinopathy Industry Volume Share (%), by Country 2024 & 2032
- Figure 31: Europe Proliferative Diabetic Retinopathy Industry Revenue (Million), by Treatment Type 2024 & 2032
- Figure 32: Europe Proliferative Diabetic Retinopathy Industry Volume (K Unit), by Treatment Type 2024 & 2032
- Figure 33: Europe Proliferative Diabetic Retinopathy Industry Revenue Share (%), by Treatment Type 2024 & 2032
- Figure 34: Europe Proliferative Diabetic Retinopathy Industry Volume Share (%), by Treatment Type 2024 & 2032
- Figure 35: Europe Proliferative Diabetic Retinopathy Industry Revenue (Million), by Country 2024 & 2032
- Figure 36: Europe Proliferative Diabetic Retinopathy Industry Volume (K Unit), by Country 2024 & 2032
- Figure 37: Europe Proliferative Diabetic Retinopathy Industry Revenue Share (%), by Country 2024 & 2032
- Figure 38: Europe Proliferative Diabetic Retinopathy Industry Volume Share (%), by Country 2024 & 2032
- Figure 39: Asia Pacific Proliferative Diabetic Retinopathy Industry Revenue (Million), by Treatment Type 2024 & 2032
- Figure 40: Asia Pacific Proliferative Diabetic Retinopathy Industry Volume (K Unit), by Treatment Type 2024 & 2032
- Figure 41: Asia Pacific Proliferative Diabetic Retinopathy Industry Revenue Share (%), by Treatment Type 2024 & 2032
- Figure 42: Asia Pacific Proliferative Diabetic Retinopathy Industry Volume Share (%), by Treatment Type 2024 & 2032
- Figure 43: Asia Pacific Proliferative Diabetic Retinopathy Industry Revenue (Million), by Country 2024 & 2032
- Figure 44: Asia Pacific Proliferative Diabetic Retinopathy Industry Volume (K Unit), by Country 2024 & 2032
- Figure 45: Asia Pacific Proliferative Diabetic Retinopathy Industry Revenue Share (%), by Country 2024 & 2032
- Figure 46: Asia Pacific Proliferative Diabetic Retinopathy Industry Volume Share (%), by Country 2024 & 2032
- Figure 47: Middle East and Africa Proliferative Diabetic Retinopathy Industry Revenue (Million), by Treatment Type 2024 & 2032
- Figure 48: Middle East and Africa Proliferative Diabetic Retinopathy Industry Volume (K Unit), by Treatment Type 2024 & 2032
- Figure 49: Middle East and Africa Proliferative Diabetic Retinopathy Industry Revenue Share (%), by Treatment Type 2024 & 2032
- Figure 50: Middle East and Africa Proliferative Diabetic Retinopathy Industry Volume Share (%), by Treatment Type 2024 & 2032
- Figure 51: Middle East and Africa Proliferative Diabetic Retinopathy Industry Revenue (Million), by Country 2024 & 2032
- Figure 52: Middle East and Africa Proliferative Diabetic Retinopathy Industry Volume (K Unit), by Country 2024 & 2032
- Figure 53: Middle East and Africa Proliferative Diabetic Retinopathy Industry Revenue Share (%), by Country 2024 & 2032
- Figure 54: Middle East and Africa Proliferative Diabetic Retinopathy Industry Volume Share (%), by Country 2024 & 2032
- Figure 55: South America Proliferative Diabetic Retinopathy Industry Revenue (Million), by Treatment Type 2024 & 2032
- Figure 56: South America Proliferative Diabetic Retinopathy Industry Volume (K Unit), by Treatment Type 2024 & 2032
- Figure 57: South America Proliferative Diabetic Retinopathy Industry Revenue Share (%), by Treatment Type 2024 & 2032
- Figure 58: South America Proliferative Diabetic Retinopathy Industry Volume Share (%), by Treatment Type 2024 & 2032
- Figure 59: South America Proliferative Diabetic Retinopathy Industry Revenue (Million), by Country 2024 & 2032
- Figure 60: South America Proliferative Diabetic Retinopathy Industry Volume (K Unit), by Country 2024 & 2032
- Figure 61: South America Proliferative Diabetic Retinopathy Industry Revenue Share (%), by Country 2024 & 2032
- Figure 62: South America Proliferative Diabetic Retinopathy Industry Volume Share (%), by Country 2024 & 2032
List of Tables
- Table 1: Global Proliferative Diabetic Retinopathy Industry Revenue Million Forecast, by Region 2019 & 2032
- Table 2: Global Proliferative Diabetic Retinopathy Industry Volume K Unit Forecast, by Region 2019 & 2032
- Table 3: Global Proliferative Diabetic Retinopathy Industry Revenue Million Forecast, by Treatment Type 2019 & 2032
- Table 4: Global Proliferative Diabetic Retinopathy Industry Volume K Unit Forecast, by Treatment Type 2019 & 2032
- Table 5: Global Proliferative Diabetic Retinopathy Industry Revenue Million Forecast, by Region 2019 & 2032
- Table 6: Global Proliferative Diabetic Retinopathy Industry Volume K Unit Forecast, by Region 2019 & 2032
- Table 7: Global Proliferative Diabetic Retinopathy Industry Revenue Million Forecast, by Country 2019 & 2032
- Table 8: Global Proliferative Diabetic Retinopathy Industry Volume K Unit Forecast, by Country 2019 & 2032
- Table 9: United States Proliferative Diabetic Retinopathy Industry Revenue (Million) Forecast, by Application 2019 & 2032
- Table 10: United States Proliferative Diabetic Retinopathy Industry Volume (K Unit) Forecast, by Application 2019 & 2032
- Table 11: Canada Proliferative Diabetic Retinopathy Industry Revenue (Million) Forecast, by Application 2019 & 2032
- Table 12: Canada Proliferative Diabetic Retinopathy Industry Volume (K Unit) Forecast, by Application 2019 & 2032
- Table 13: Mexico Proliferative Diabetic Retinopathy Industry Revenue (Million) Forecast, by Application 2019 & 2032
- Table 14: Mexico Proliferative Diabetic Retinopathy Industry Volume (K Unit) Forecast, by Application 2019 & 2032
- Table 15: Global Proliferative Diabetic Retinopathy Industry Revenue Million Forecast, by Country 2019 & 2032
- Table 16: Global Proliferative Diabetic Retinopathy Industry Volume K Unit Forecast, by Country 2019 & 2032
- Table 17: Germany Proliferative Diabetic Retinopathy Industry Revenue (Million) Forecast, by Application 2019 & 2032
- Table 18: Germany Proliferative Diabetic Retinopathy Industry Volume (K Unit) Forecast, by Application 2019 & 2032
- Table 19: United Kingdom Proliferative Diabetic Retinopathy Industry Revenue (Million) Forecast, by Application 2019 & 2032
- Table 20: United Kingdom Proliferative Diabetic Retinopathy Industry Volume (K Unit) Forecast, by Application 2019 & 2032
- Table 21: France Proliferative Diabetic Retinopathy Industry Revenue (Million) Forecast, by Application 2019 & 2032
- Table 22: France Proliferative Diabetic Retinopathy Industry Volume (K Unit) Forecast, by Application 2019 & 2032
- Table 23: Italy Proliferative Diabetic Retinopathy Industry Revenue (Million) Forecast, by Application 2019 & 2032
- Table 24: Italy Proliferative Diabetic Retinopathy Industry Volume (K Unit) Forecast, by Application 2019 & 2032
- Table 25: Spain Proliferative Diabetic Retinopathy Industry Revenue (Million) Forecast, by Application 2019 & 2032
- Table 26: Spain Proliferative Diabetic Retinopathy Industry Volume (K Unit) Forecast, by Application 2019 & 2032
- Table 27: Rest of Europe Proliferative Diabetic Retinopathy Industry Revenue (Million) Forecast, by Application 2019 & 2032
- Table 28: Rest of Europe Proliferative Diabetic Retinopathy Industry Volume (K Unit) Forecast, by Application 2019 & 2032
- Table 29: Global Proliferative Diabetic Retinopathy Industry Revenue Million Forecast, by Country 2019 & 2032
- Table 30: Global Proliferative Diabetic Retinopathy Industry Volume K Unit Forecast, by Country 2019 & 2032
- Table 31: China Proliferative Diabetic Retinopathy Industry Revenue (Million) Forecast, by Application 2019 & 2032
- Table 32: China Proliferative Diabetic Retinopathy Industry Volume (K Unit) Forecast, by Application 2019 & 2032
- Table 33: Japan Proliferative Diabetic Retinopathy Industry Revenue (Million) Forecast, by Application 2019 & 2032
- Table 34: Japan Proliferative Diabetic Retinopathy Industry Volume (K Unit) Forecast, by Application 2019 & 2032
- Table 35: India Proliferative Diabetic Retinopathy Industry Revenue (Million) Forecast, by Application 2019 & 2032
- Table 36: India Proliferative Diabetic Retinopathy Industry Volume (K Unit) Forecast, by Application 2019 & 2032
- Table 37: Australia Proliferative Diabetic Retinopathy Industry Revenue (Million) Forecast, by Application 2019 & 2032
- Table 38: Australia Proliferative Diabetic Retinopathy Industry Volume (K Unit) Forecast, by Application 2019 & 2032
- Table 39: South Korea Proliferative Diabetic Retinopathy Industry Revenue (Million) Forecast, by Application 2019 & 2032
- Table 40: South Korea Proliferative Diabetic Retinopathy Industry Volume (K Unit) Forecast, by Application 2019 & 2032
- Table 41: Rest of Asia Pacific Proliferative Diabetic Retinopathy Industry Revenue (Million) Forecast, by Application 2019 & 2032
- Table 42: Rest of Asia Pacific Proliferative Diabetic Retinopathy Industry Volume (K Unit) Forecast, by Application 2019 & 2032
- Table 43: Global Proliferative Diabetic Retinopathy Industry Revenue Million Forecast, by Country 2019 & 2032
- Table 44: Global Proliferative Diabetic Retinopathy Industry Volume K Unit Forecast, by Country 2019 & 2032
- Table 45: GCC Proliferative Diabetic Retinopathy Industry Revenue (Million) Forecast, by Application 2019 & 2032
- Table 46: GCC Proliferative Diabetic Retinopathy Industry Volume (K Unit) Forecast, by Application 2019 & 2032
- Table 47: South Africa Proliferative Diabetic Retinopathy Industry Revenue (Million) Forecast, by Application 2019 & 2032
- Table 48: South Africa Proliferative Diabetic Retinopathy Industry Volume (K Unit) Forecast, by Application 2019 & 2032
- Table 49: Rest of Middle East and Africa Proliferative Diabetic Retinopathy Industry Revenue (Million) Forecast, by Application 2019 & 2032
- Table 50: Rest of Middle East and Africa Proliferative Diabetic Retinopathy Industry Volume (K Unit) Forecast, by Application 2019 & 2032
- Table 51: Global Proliferative Diabetic Retinopathy Industry Revenue Million Forecast, by Country 2019 & 2032
- Table 52: Global Proliferative Diabetic Retinopathy Industry Volume K Unit Forecast, by Country 2019 & 2032
- Table 53: Brazil Proliferative Diabetic Retinopathy Industry Revenue (Million) Forecast, by Application 2019 & 2032
- Table 54: Brazil Proliferative Diabetic Retinopathy Industry Volume (K Unit) Forecast, by Application 2019 & 2032
- Table 55: Argentina Proliferative Diabetic Retinopathy Industry Revenue (Million) Forecast, by Application 2019 & 2032
- Table 56: Argentina Proliferative Diabetic Retinopathy Industry Volume (K Unit) Forecast, by Application 2019 & 2032
- Table 57: Rest of South America Proliferative Diabetic Retinopathy Industry Revenue (Million) Forecast, by Application 2019 & 2032
- Table 58: Rest of South America Proliferative Diabetic Retinopathy Industry Volume (K Unit) Forecast, by Application 2019 & 2032
- Table 59: Global Proliferative Diabetic Retinopathy Industry Revenue Million Forecast, by Treatment Type 2019 & 2032
- Table 60: Global Proliferative Diabetic Retinopathy Industry Volume K Unit Forecast, by Treatment Type 2019 & 2032
- Table 61: Global Proliferative Diabetic Retinopathy Industry Revenue Million Forecast, by Country 2019 & 2032
- Table 62: Global Proliferative Diabetic Retinopathy Industry Volume K Unit Forecast, by Country 2019 & 2032
- Table 63: United States Proliferative Diabetic Retinopathy Industry Revenue (Million) Forecast, by Application 2019 & 2032
- Table 64: United States Proliferative Diabetic Retinopathy Industry Volume (K Unit) Forecast, by Application 2019 & 2032
- Table 65: Canada Proliferative Diabetic Retinopathy Industry Revenue (Million) Forecast, by Application 2019 & 2032
- Table 66: Canada Proliferative Diabetic Retinopathy Industry Volume (K Unit) Forecast, by Application 2019 & 2032
- Table 67: Mexico Proliferative Diabetic Retinopathy Industry Revenue (Million) Forecast, by Application 2019 & 2032
- Table 68: Mexico Proliferative Diabetic Retinopathy Industry Volume (K Unit) Forecast, by Application 2019 & 2032
- Table 69: Global Proliferative Diabetic Retinopathy Industry Revenue Million Forecast, by Treatment Type 2019 & 2032
- Table 70: Global Proliferative Diabetic Retinopathy Industry Volume K Unit Forecast, by Treatment Type 2019 & 2032
- Table 71: Global Proliferative Diabetic Retinopathy Industry Revenue Million Forecast, by Country 2019 & 2032
- Table 72: Global Proliferative Diabetic Retinopathy Industry Volume K Unit Forecast, by Country 2019 & 2032
- Table 73: Germany Proliferative Diabetic Retinopathy Industry Revenue (Million) Forecast, by Application 2019 & 2032
- Table 74: Germany Proliferative Diabetic Retinopathy Industry Volume (K Unit) Forecast, by Application 2019 & 2032
- Table 75: United Kingdom Proliferative Diabetic Retinopathy Industry Revenue (Million) Forecast, by Application 2019 & 2032
- Table 76: United Kingdom Proliferative Diabetic Retinopathy Industry Volume (K Unit) Forecast, by Application 2019 & 2032
- Table 77: France Proliferative Diabetic Retinopathy Industry Revenue (Million) Forecast, by Application 2019 & 2032
- Table 78: France Proliferative Diabetic Retinopathy Industry Volume (K Unit) Forecast, by Application 2019 & 2032
- Table 79: Italy Proliferative Diabetic Retinopathy Industry Revenue (Million) Forecast, by Application 2019 & 2032
- Table 80: Italy Proliferative Diabetic Retinopathy Industry Volume (K Unit) Forecast, by Application 2019 & 2032
- Table 81: Spain Proliferative Diabetic Retinopathy Industry Revenue (Million) Forecast, by Application 2019 & 2032
- Table 82: Spain Proliferative Diabetic Retinopathy Industry Volume (K Unit) Forecast, by Application 2019 & 2032
- Table 83: Rest of Europe Proliferative Diabetic Retinopathy Industry Revenue (Million) Forecast, by Application 2019 & 2032
- Table 84: Rest of Europe Proliferative Diabetic Retinopathy Industry Volume (K Unit) Forecast, by Application 2019 & 2032
- Table 85: Global Proliferative Diabetic Retinopathy Industry Revenue Million Forecast, by Treatment Type 2019 & 2032
- Table 86: Global Proliferative Diabetic Retinopathy Industry Volume K Unit Forecast, by Treatment Type 2019 & 2032
- Table 87: Global Proliferative Diabetic Retinopathy Industry Revenue Million Forecast, by Country 2019 & 2032
- Table 88: Global Proliferative Diabetic Retinopathy Industry Volume K Unit Forecast, by Country 2019 & 2032
- Table 89: China Proliferative Diabetic Retinopathy Industry Revenue (Million) Forecast, by Application 2019 & 2032
- Table 90: China Proliferative Diabetic Retinopathy Industry Volume (K Unit) Forecast, by Application 2019 & 2032
- Table 91: Japan Proliferative Diabetic Retinopathy Industry Revenue (Million) Forecast, by Application 2019 & 2032
- Table 92: Japan Proliferative Diabetic Retinopathy Industry Volume (K Unit) Forecast, by Application 2019 & 2032
- Table 93: India Proliferative Diabetic Retinopathy Industry Revenue (Million) Forecast, by Application 2019 & 2032
- Table 94: India Proliferative Diabetic Retinopathy Industry Volume (K Unit) Forecast, by Application 2019 & 2032
- Table 95: Australia Proliferative Diabetic Retinopathy Industry Revenue (Million) Forecast, by Application 2019 & 2032
- Table 96: Australia Proliferative Diabetic Retinopathy Industry Volume (K Unit) Forecast, by Application 2019 & 2032
- Table 97: South Korea Proliferative Diabetic Retinopathy Industry Revenue (Million) Forecast, by Application 2019 & 2032
- Table 98: South Korea Proliferative Diabetic Retinopathy Industry Volume (K Unit) Forecast, by Application 2019 & 2032
- Table 99: Rest of Asia Pacific Proliferative Diabetic Retinopathy Industry Revenue (Million) Forecast, by Application 2019 & 2032
- Table 100: Rest of Asia Pacific Proliferative Diabetic Retinopathy Industry Volume (K Unit) Forecast, by Application 2019 & 2032
- Table 101: Global Proliferative Diabetic Retinopathy Industry Revenue Million Forecast, by Treatment Type 2019 & 2032
- Table 102: Global Proliferative Diabetic Retinopathy Industry Volume K Unit Forecast, by Treatment Type 2019 & 2032
- Table 103: Global Proliferative Diabetic Retinopathy Industry Revenue Million Forecast, by Country 2019 & 2032
- Table 104: Global Proliferative Diabetic Retinopathy Industry Volume K Unit Forecast, by Country 2019 & 2032
- Table 105: GCC Proliferative Diabetic Retinopathy Industry Revenue (Million) Forecast, by Application 2019 & 2032
- Table 106: GCC Proliferative Diabetic Retinopathy Industry Volume (K Unit) Forecast, by Application 2019 & 2032
- Table 107: South Africa Proliferative Diabetic Retinopathy Industry Revenue (Million) Forecast, by Application 2019 & 2032
- Table 108: South Africa Proliferative Diabetic Retinopathy Industry Volume (K Unit) Forecast, by Application 2019 & 2032
- Table 109: Rest of Middle East and Africa Proliferative Diabetic Retinopathy Industry Revenue (Million) Forecast, by Application 2019 & 2032
- Table 110: Rest of Middle East and Africa Proliferative Diabetic Retinopathy Industry Volume (K Unit) Forecast, by Application 2019 & 2032
- Table 111: Global Proliferative Diabetic Retinopathy Industry Revenue Million Forecast, by Treatment Type 2019 & 2032
- Table 112: Global Proliferative Diabetic Retinopathy Industry Volume K Unit Forecast, by Treatment Type 2019 & 2032
- Table 113: Global Proliferative Diabetic Retinopathy Industry Revenue Million Forecast, by Country 2019 & 2032
- Table 114: Global Proliferative Diabetic Retinopathy Industry Volume K Unit Forecast, by Country 2019 & 2032
- Table 115: Brazil Proliferative Diabetic Retinopathy Industry Revenue (Million) Forecast, by Application 2019 & 2032
- Table 116: Brazil Proliferative Diabetic Retinopathy Industry Volume (K Unit) Forecast, by Application 2019 & 2032
- Table 117: Argentina Proliferative Diabetic Retinopathy Industry Revenue (Million) Forecast, by Application 2019 & 2032
- Table 118: Argentina Proliferative Diabetic Retinopathy Industry Volume (K Unit) Forecast, by Application 2019 & 2032
- Table 119: Rest of South America Proliferative Diabetic Retinopathy Industry Revenue (Million) Forecast, by Application 2019 & 2032
- Table 120: Rest of South America Proliferative Diabetic Retinopathy Industry Volume (K Unit) Forecast, by Application 2019 & 2032
Frequently Asked Questions
1. What is the projected Compound Annual Growth Rate (CAGR) of the Proliferative Diabetic Retinopathy Industry?
The projected CAGR is approximately 9.40%.
2. Which companies are prominent players in the Proliferative Diabetic Retinopathy Industry?
Key companies in the market include Hoffmann-La Roche (Genentech), Regeneron Pharmaceuticals Inc, Kowa Group, Novartis AG, Glycadia Pharmaceuticals, Oxurion NV, Alimera Sciences, Allergan Plc, BCN Peptides.
3. What are the main segments of the Proliferative Diabetic Retinopathy Industry?
The market segments include Treatment Type.
4. Can you provide details about the market size?
The market size is estimated to be USD XX Million as of 2022.
5. What are some drivers contributing to market growth?
; Rising Prevalence of Diabetes Increases Risk of Diabetic Retinopathy; Availability of Advanced Technology and Minimally Invasive Laser Technique.
6. What are the notable trends driving market growth?
Anti-VEGF Agents Segment is Expected to Witness a Healthy CAGR.
7. Are there any restraints impacting market growth?
; Extended Approval Time for Drugs.
8. Can you provide examples of recent developments in the market?
N/A
9. What pricing options are available for accessing the report?
Pricing options include single-user, multi-user, and enterprise licenses priced at USD 4750, USD 5250, and USD 8750 respectively.
10. Is the market size provided in terms of value or volume?
The market size is provided in terms of value, measured in Million and volume, measured in K Unit.
11. Are there any specific market keywords associated with the report?
Yes, the market keyword associated with the report is "Proliferative Diabetic Retinopathy Industry," which aids in identifying and referencing the specific market segment covered.
12. How do I determine which pricing option suits my needs best?
The pricing options vary based on user requirements and access needs. Individual users may opt for single-user licenses, while businesses requiring broader access may choose multi-user or enterprise licenses for cost-effective access to the report.
13. Are there any additional resources or data provided in the Proliferative Diabetic Retinopathy Industry report?
While the report offers comprehensive insights, it's advisable to review the specific contents or supplementary materials provided to ascertain if additional resources or data are available.
14. How can I stay updated on further developments or reports in the Proliferative Diabetic Retinopathy Industry?
To stay informed about further developments, trends, and reports in the Proliferative Diabetic Retinopathy Industry, consider subscribing to industry newsletters, following relevant companies and organizations, or regularly checking reputable industry news sources and publications.
Methodology
Step 1 - Identification of Relevant Samples Size from Population Database


Step 2 - Approaches for Defining Global Market Size (Value, Volume* & Price*)

Note*: In applicable scenarios
Step 3 - Data Sources
Primary Research
- Web Analytics
- Survey Reports
- Research Institute
- Latest Research Reports
- Opinion Leaders
Secondary Research
- Annual Reports
- White Paper
- Latest Press Release
- Industry Association
- Paid Database
- Investor Presentations

Step 4 - Data Triangulation
Involves using different sources of information in order to increase the validity of a study
These sources are likely to be stakeholders in a program - participants, other researchers, program staff, other community members, and so on.
Then we put all data in single framework & apply various statistical tools to find out the dynamic on the market.
During the analysis stage, feedback from the stakeholder groups would be compared to determine areas of agreement as well as areas of divergence
