

Key Insights
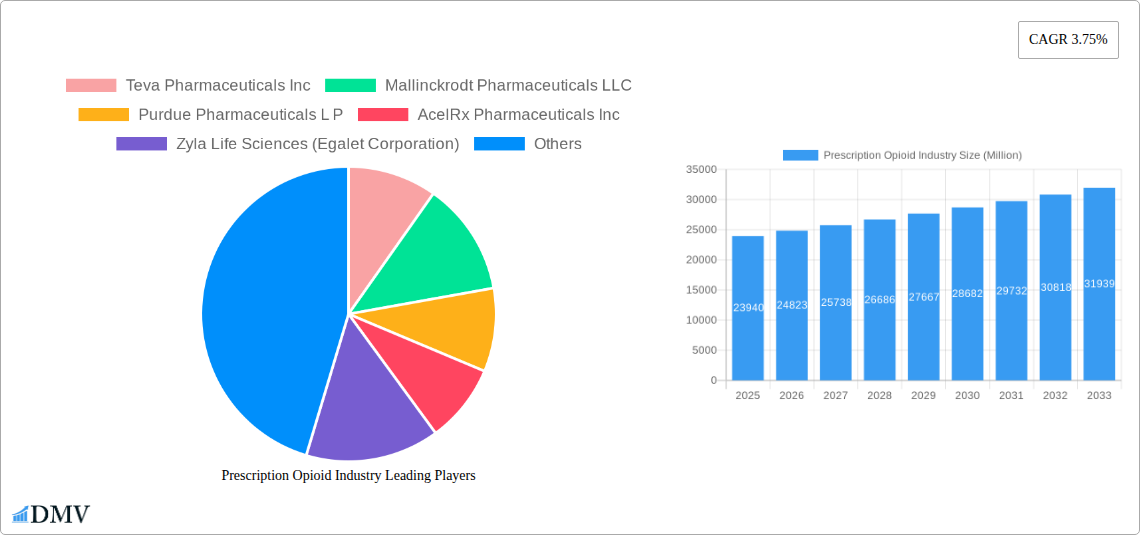
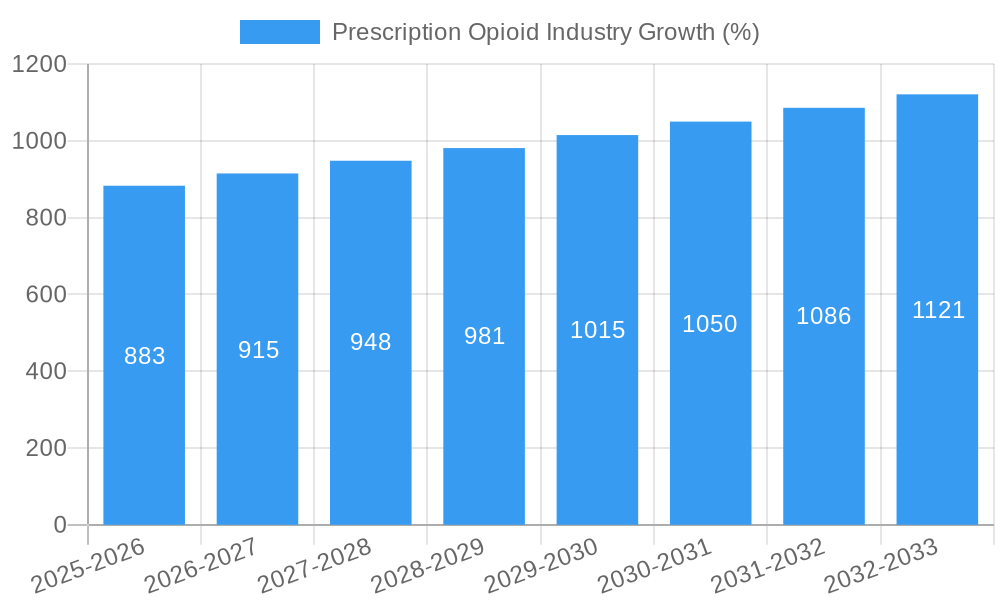
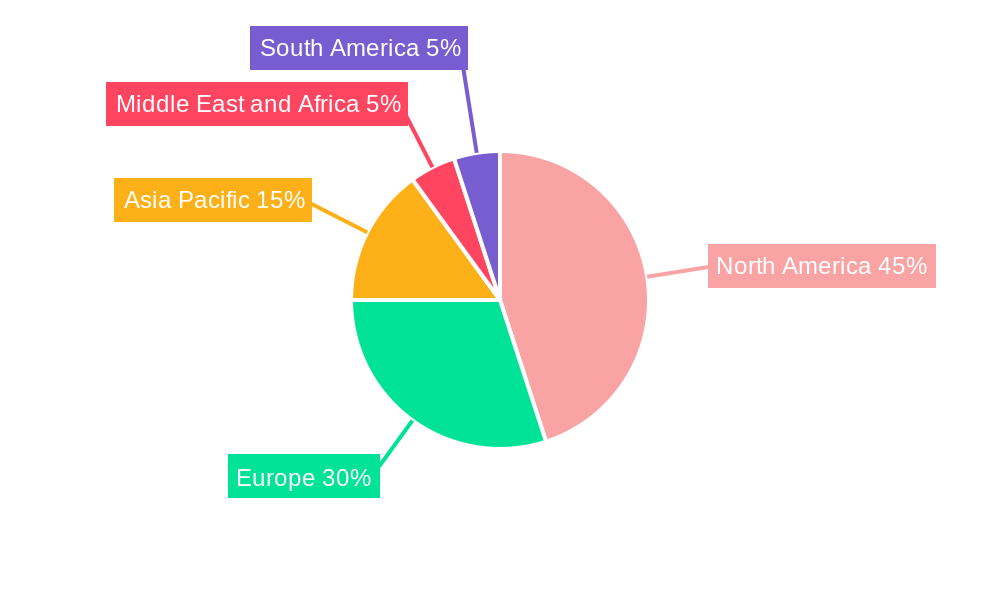
The global prescription opioid market, valued at $23.94 billion in 2025, is projected to experience steady growth, driven by a persistent need for effective pain management solutions, particularly for chronic conditions like arthritis and cancer. A compound annual growth rate (CAGR) of 3.75% from 2025 to 2033 indicates a sizeable market expansion. Key drivers include the aging global population, increasing prevalence of chronic pain, and ongoing research into opioid formulations with improved safety profiles. However, the market faces significant restraints including stringent regulatory scrutiny aimed at curbing opioid abuse and addiction, leading to tighter prescription controls and increased public awareness campaigns promoting alternative pain management strategies. This has resulted in a shift towards more controlled prescribing practices and a focus on multimodal pain management approaches incorporating non-opioid therapies. Market segmentation reveals strong demand across various product types, with codeine, fentanyl, morphine, and methadone holding significant market shares, differentiated by their potency and receptor binding characteristics (strong vs. mild/moderate agonist). The pain management application segment dominates, reflecting the primary use case for prescription opioids. Geographic analysis shows North America currently holds the largest market share due to high opioid consumption and established healthcare infrastructure, while Asia Pacific is expected to witness significant growth driven by rising healthcare spending and increasing awareness of chronic pain conditions. Leading pharmaceutical companies such as Teva Pharmaceuticals, Mallinckrodt, and Purdue Pharma are key players shaping market dynamics through research and development, strategic partnerships, and global distribution networks.
The competitive landscape is dynamic, with pharmaceutical companies focusing on developing extended-release formulations and abuse-deterrent technologies to mitigate the risk of misuse and diversion. This focus on improving safety profiles and reducing the potential for addiction is a critical factor influencing future market growth. The increasing prevalence of non-opioid alternatives such as NSAIDs and other analgesic medications adds another layer of complexity to the market dynamics. Looking ahead, the market's trajectory will largely depend on the balance between the ongoing need for effective pain management and stricter regulatory measures aimed at minimizing the risks associated with opioid use. Continued innovation in pain management strategies and the development of safer, more effective opioid alternatives will be crucial in shaping the future of this complex and evolving market.
Prescription Opioid Industry Market Report: 2019-2033
This comprehensive report provides a detailed analysis of the Prescription Opioid Industry, encompassing market size, trends, leading players, and future growth projections from 2019 to 2033. The report leverages extensive data analysis to provide actionable insights for stakeholders across the pharmaceutical value chain. With a base year of 2025 and an estimated year of 2025, this forecast covers the historical period (2019-2024) and the forecast period (2025-2033). The market is segmented by product type (Codeine, Fentanyl, Morphine, Meperidine, Methadone, Other Product Types), receptor binding (Strong Agonist, Mild to Moderate Agonist), and application (Pain Management). Key players analyzed include Teva Pharmaceuticals Inc, Mallinckrodt Pharmaceuticals LLC, Purdue Pharmaceuticals L P, AcelRx Pharmaceuticals Inc, Zyla Life Sciences (Egalet Corporation), Alcaliber SA, Hikma Pharmaceuticals PLC, Johnson & Johnson, Amneal Pharmaceuticals Inc, Vertice Pharma LLC, AbbVie Inc (Allergan PLC), Endo Pharmaceuticals Inc, Sun Pharmaceutical Industries Ltd, and Pfizer Inc.
Prescription Opioid Industry Market Composition & Trends
This section offers a detailed examination of the Prescription Opioid Industry's competitive landscape, outlining market concentration, innovation drivers, regulatory influences, and strategic activities. The market is characterized by a moderately concentrated structure, with the top 10 companies holding an estimated xx% market share in 2025. Mergers and acquisitions (M&A) have played a significant role in shaping the industry, with total M&A deal values exceeding $xx Million in the period 2019-2024.
- Market Concentration: Top 10 players hold xx% market share (2025).
- Innovation Catalysts: Focus on novel delivery systems and abuse-deterrent formulations.
- Regulatory Landscape: Stringent regulations impacting prescription practices and product approvals.
- Substitute Products: Non-opioid analgesics and alternative pain management therapies pose competitive pressure.
- End-User Profiles: Hospitals, clinics, and individual practitioners.
- M&A Activities: Significant consolidation observed, with total deal values exceeding $xx Million (2019-2024).
Prescription Opioid Industry Industry Evolution
The Prescription Opioid Industry has witnessed significant evolution over the past decade, characterized by fluctuating market growth trajectories, evolving technological advancements, and shifting consumer demands. Market growth experienced a period of decline due to increased regulatory scrutiny and public health concerns. However, the market shows signs of stabilization with a projected Compound Annual Growth Rate (CAGR) of xx% from 2025 to 2033, reaching a market value of $xx Million by 2033. This growth is partly driven by technological advancements in pain management and the development of abuse-deterrent formulations. Consumer demand is increasingly shifting towards safer, more effective, and less addictive opioid alternatives.
Leading Regions, Countries, or Segments in Prescription Opioid Industry
The North American market continues to dominate the global prescription opioid landscape, driven by high prescription rates and substantial investment in pain management research and development. Within product types, Fentanyl holds a significant market share, while strong agonists comprise the largest receptor binding segment. Pain Management remains the principal application, with a xx% market share.
- Key Drivers (North America):
- High prevalence of chronic pain conditions.
- Significant investments in pain management R&D.
- Well-established healthcare infrastructure.
- Fentanyl Dominance: High potency and efficacy in treating severe pain.
- Strong Agonist Prevalence: Wide use in various pain management applications.
- Pain Management Application: Primary driver of market growth due to high demand.
Prescription Opioid Industry Product Innovations
Recent innovations focus on improving safety profiles and reducing the potential for abuse. This includes abuse-deterrent formulations, novel delivery systems, and the development of alternative pain management medications. These innovations aim to minimize risks associated with opioid prescriptions while effectively managing patient pain. Key metrics include reduced rates of misuse and improved patient compliance.
Propelling Factors for Prescription Opioid Industry Growth
Technological advancements in drug delivery and formulation (e.g., extended-release opioids) are driving market growth. Economic factors, including rising healthcare expenditure and an aging population, also contribute. Furthermore, the development of effective treatments for chronic pain conditions fuels demand.
Obstacles in the Prescription Opioid Industry Market
Stricter regulations and increased scrutiny by regulatory agencies (e.g., FDA) pose significant hurdles. Supply chain disruptions and fluctuations in raw material prices impact profitability. Intense competition from alternative pain management therapies further restricts market expansion.
Future Opportunities in Prescription Opioid Industry
Emerging markets, particularly in Asia and Latin America, present significant growth potential. The development of novel opioid formulations with improved safety and efficacy profiles offers opportunities for expansion. Technological advancements in pain management will open new avenues for market growth.
Major Players in the Prescription Opioid Industry Ecosystem
- Teva Pharmaceuticals Inc
- Mallinckrodt Pharmaceuticals LLC
- Purdue Pharmaceuticals L P
- AcelRx Pharmaceuticals Inc
- Zyla Life Sciences (Egalet Corporation)
- Alcaliber SA
- Hikma Pharmaceuticals PLC
- Johnson & Johnson
- Amneal Pharmaceuticals Inc
- Vertice Pharma LLC
- AbbVie Inc (Allergan PLC)
- Endo Pharmaceuticals Inc
- Sun Pharmaceutical Industries Ltd
- Pfizer Inc
Key Developments in Prescription Opioid Industry Industry
- January 2022: Trevena, Inc.'s OLINVYK (oliceridine) injection NDA accepted by China's NMPA.
- October 2021: Esteve Pharmaceuticals received FDA approval for SEGLENTIS (celecoxib and tramadol hydrochloride).
Strategic Prescription Opioid Industry Market Forecast
The Prescription Opioid Industry is poised for moderate growth, driven by advancements in abuse-deterrent formulations and expanding access to pain management treatments in developing economies. Despite regulatory challenges, continued innovation and the unmet need for effective pain management will fuel future market expansion. The market is projected to reach a value of $xx Million by 2033, presenting substantial opportunities for established players and new entrants.
Prescription Opioid Industry Segmentation
-
1. Product Type
- 1.1. Codeine
- 1.2. Fentanyl
- 1.3. Morphine
- 1.4. Meperidine
- 1.5. Methadone
- 1.6. Other Product Types
-
2. Receptor Binding
- 2.1. Strong Agonist
- 2.2. Mild to Moderate Agonist
-
3. Application
-
3.1. Pain Management
- 3.1.1. Cancer Pain
- 3.1.2. Neuropathic Pain
- 3.1.3. Osteoarthritis Pain
- 3.1.4. Other Pain Managements
- 3.2. Cold and Cough
- 3.3. Diarrhoea
- 3.4. Other Applications
-
3.1. Pain Management
Prescription Opioid Industry Segmentation By Geography
-
1. North America
- 1.1. United States
- 1.2. Canada
- 1.3. Mexico
-
2. Europe
- 2.1. Germany
- 2.2. United Kingdom
- 2.3. France
- 2.4. Italy
- 2.5. Spain
- 2.6. Rest of Europe
-
3. Asia Pacific
- 3.1. China
- 3.2. Japan
- 3.3. India
- 3.4. Australia
- 3.5. South Korea
- 3.6. Rest of Asia Pacific
-
4. Middle East and Africa
- 4.1. GCC
- 4.2. South Africa
- 4.3. Rest of Middle East and Africa
-
5. South America
- 5.1. Brazil
- 5.2. Argentina
- 5.3. Rest of South America
Prescription Opioid Industry REPORT HIGHLIGHTS
| Aspects | Details |
|---|---|
| Study Period | 2019-2033 |
| Base Year | 2024 |
| Estimated Year | 2025 |
| Forecast Period | 2025-2033 |
| Historical Period | 2019-2024 |
| Growth Rate | CAGR of 3.75% from 2019-2033 |
| Segmentation |
|
Table of Contents
- 1. Introduction
- 1.1. Research Scope
- 1.2. Market Segmentation
- 1.3. Research Methodology
- 1.4. Definitions and Assumptions
- 2. Executive Summary
- 2.1. Introduction
- 3. Market Dynamics
- 3.1. Introduction
- 3.2. Market Drivers
- 3.2.1. Rising Prevalence of Orthopedic Diseases and Chronic Pain; Inclination toward Extended Release Formulations from Immediate Release of Opioids; Rising Focus on Abuse-deterrent Formulation (ADF) by Generic Manufacturers
- 3.3. Market Restrains
- 3.3.1. Advent and Legalization of Cannabis as an Alternative to Opioids; Prescription Drug Abuse
- 3.4. Market Trends
- 3.4.1. Strong Agonists are Expected to Hold Significant Market Share in the Receptor Binding Segment
- 4. Market Factor Analysis
- 4.1. Porters Five Forces
- 4.2. Supply/Value Chain
- 4.3. PESTEL analysis
- 4.4. Market Entropy
- 4.5. Patent/Trademark Analysis
- 5. Global Prescription Opioid Industry Analysis, Insights and Forecast, 2019-2031
- 5.1. Market Analysis, Insights and Forecast - by Product Type
- 5.1.1. Codeine
- 5.1.2. Fentanyl
- 5.1.3. Morphine
- 5.1.4. Meperidine
- 5.1.5. Methadone
- 5.1.6. Other Product Types
- 5.2. Market Analysis, Insights and Forecast - by Receptor Binding
- 5.2.1. Strong Agonist
- 5.2.2. Mild to Moderate Agonist
- 5.3. Market Analysis, Insights and Forecast - by Application
- 5.3.1. Pain Management
- 5.3.1.1. Cancer Pain
- 5.3.1.2. Neuropathic Pain
- 5.3.1.3. Osteoarthritis Pain
- 5.3.1.4. Other Pain Managements
- 5.3.2. Cold and Cough
- 5.3.3. Diarrhoea
- 5.3.4. Other Applications
- 5.3.1. Pain Management
- 5.4. Market Analysis, Insights and Forecast - by Region
- 5.4.1. North America
- 5.4.2. Europe
- 5.4.3. Asia Pacific
- 5.4.4. Middle East and Africa
- 5.4.5. South America
- 5.1. Market Analysis, Insights and Forecast - by Product Type
- 6. North America Prescription Opioid Industry Analysis, Insights and Forecast, 2019-2031
- 6.1. Market Analysis, Insights and Forecast - by Product Type
- 6.1.1. Codeine
- 6.1.2. Fentanyl
- 6.1.3. Morphine
- 6.1.4. Meperidine
- 6.1.5. Methadone
- 6.1.6. Other Product Types
- 6.2. Market Analysis, Insights and Forecast - by Receptor Binding
- 6.2.1. Strong Agonist
- 6.2.2. Mild to Moderate Agonist
- 6.3. Market Analysis, Insights and Forecast - by Application
- 6.3.1. Pain Management
- 6.3.1.1. Cancer Pain
- 6.3.1.2. Neuropathic Pain
- 6.3.1.3. Osteoarthritis Pain
- 6.3.1.4. Other Pain Managements
- 6.3.2. Cold and Cough
- 6.3.3. Diarrhoea
- 6.3.4. Other Applications
- 6.3.1. Pain Management
- 6.1. Market Analysis, Insights and Forecast - by Product Type
- 7. Europe Prescription Opioid Industry Analysis, Insights and Forecast, 2019-2031
- 7.1. Market Analysis, Insights and Forecast - by Product Type
- 7.1.1. Codeine
- 7.1.2. Fentanyl
- 7.1.3. Morphine
- 7.1.4. Meperidine
- 7.1.5. Methadone
- 7.1.6. Other Product Types
- 7.2. Market Analysis, Insights and Forecast - by Receptor Binding
- 7.2.1. Strong Agonist
- 7.2.2. Mild to Moderate Agonist
- 7.3. Market Analysis, Insights and Forecast - by Application
- 7.3.1. Pain Management
- 7.3.1.1. Cancer Pain
- 7.3.1.2. Neuropathic Pain
- 7.3.1.3. Osteoarthritis Pain
- 7.3.1.4. Other Pain Managements
- 7.3.2. Cold and Cough
- 7.3.3. Diarrhoea
- 7.3.4. Other Applications
- 7.3.1. Pain Management
- 7.1. Market Analysis, Insights and Forecast - by Product Type
- 8. Asia Pacific Prescription Opioid Industry Analysis, Insights and Forecast, 2019-2031
- 8.1. Market Analysis, Insights and Forecast - by Product Type
- 8.1.1. Codeine
- 8.1.2. Fentanyl
- 8.1.3. Morphine
- 8.1.4. Meperidine
- 8.1.5. Methadone
- 8.1.6. Other Product Types
- 8.2. Market Analysis, Insights and Forecast - by Receptor Binding
- 8.2.1. Strong Agonist
- 8.2.2. Mild to Moderate Agonist
- 8.3. Market Analysis, Insights and Forecast - by Application
- 8.3.1. Pain Management
- 8.3.1.1. Cancer Pain
- 8.3.1.2. Neuropathic Pain
- 8.3.1.3. Osteoarthritis Pain
- 8.3.1.4. Other Pain Managements
- 8.3.2. Cold and Cough
- 8.3.3. Diarrhoea
- 8.3.4. Other Applications
- 8.3.1. Pain Management
- 8.1. Market Analysis, Insights and Forecast - by Product Type
- 9. Middle East and Africa Prescription Opioid Industry Analysis, Insights and Forecast, 2019-2031
- 9.1. Market Analysis, Insights and Forecast - by Product Type
- 9.1.1. Codeine
- 9.1.2. Fentanyl
- 9.1.3. Morphine
- 9.1.4. Meperidine
- 9.1.5. Methadone
- 9.1.6. Other Product Types
- 9.2. Market Analysis, Insights and Forecast - by Receptor Binding
- 9.2.1. Strong Agonist
- 9.2.2. Mild to Moderate Agonist
- 9.3. Market Analysis, Insights and Forecast - by Application
- 9.3.1. Pain Management
- 9.3.1.1. Cancer Pain
- 9.3.1.2. Neuropathic Pain
- 9.3.1.3. Osteoarthritis Pain
- 9.3.1.4. Other Pain Managements
- 9.3.2. Cold and Cough
- 9.3.3. Diarrhoea
- 9.3.4. Other Applications
- 9.3.1. Pain Management
- 9.1. Market Analysis, Insights and Forecast - by Product Type
- 10. South America Prescription Opioid Industry Analysis, Insights and Forecast, 2019-2031
- 10.1. Market Analysis, Insights and Forecast - by Product Type
- 10.1.1. Codeine
- 10.1.2. Fentanyl
- 10.1.3. Morphine
- 10.1.4. Meperidine
- 10.1.5. Methadone
- 10.1.6. Other Product Types
- 10.2. Market Analysis, Insights and Forecast - by Receptor Binding
- 10.2.1. Strong Agonist
- 10.2.2. Mild to Moderate Agonist
- 10.3. Market Analysis, Insights and Forecast - by Application
- 10.3.1. Pain Management
- 10.3.1.1. Cancer Pain
- 10.3.1.2. Neuropathic Pain
- 10.3.1.3. Osteoarthritis Pain
- 10.3.1.4. Other Pain Managements
- 10.3.2. Cold and Cough
- 10.3.3. Diarrhoea
- 10.3.4. Other Applications
- 10.3.1. Pain Management
- 10.1. Market Analysis, Insights and Forecast - by Product Type
- 11. North America Prescription Opioid Industry Analysis, Insights and Forecast, 2019-2031
- 11.1. Market Analysis, Insights and Forecast - By Country/Sub-region
- 11.1.1. undefined
- 12. Europe Prescription Opioid Industry Analysis, Insights and Forecast, 2019-2031
- 12.1. Market Analysis, Insights and Forecast - By Country/Sub-region
- 12.1.1. undefined
- 13. Asia Pacific Prescription Opioid Industry Analysis, Insights and Forecast, 2019-2031
- 13.1. Market Analysis, Insights and Forecast - By Country/Sub-region
- 13.1.1. undefined
- 14. Middle East and Africa Prescription Opioid Industry Analysis, Insights and Forecast, 2019-2031
- 14.1. Market Analysis, Insights and Forecast - By Country/Sub-region
- 14.1.1. undefined
- 15. South America Prescription Opioid Industry Analysis, Insights and Forecast, 2019-2031
- 15.1. Market Analysis, Insights and Forecast - By Country/Sub-region
- 15.1.1. undefined
- 16. Competitive Analysis
- 16.1. Global Market Share Analysis 2024
- 16.2. Company Profiles
- 16.2.1 Teva Pharmaceuticals Inc
- 16.2.1.1. Overview
- 16.2.1.2. Products
- 16.2.1.3. SWOT Analysis
- 16.2.1.4. Recent Developments
- 16.2.1.5. Financials (Based on Availability)
- 16.2.2 Mallinckrodt Pharmaceuticals LLC
- 16.2.2.1. Overview
- 16.2.2.2. Products
- 16.2.2.3. SWOT Analysis
- 16.2.2.4. Recent Developments
- 16.2.2.5. Financials (Based on Availability)
- 16.2.3 Purdue Pharmaceuticals L P
- 16.2.3.1. Overview
- 16.2.3.2. Products
- 16.2.3.3. SWOT Analysis
- 16.2.3.4. Recent Developments
- 16.2.3.5. Financials (Based on Availability)
- 16.2.4 AcelRx Pharmaceuticals Inc
- 16.2.4.1. Overview
- 16.2.4.2. Products
- 16.2.4.3. SWOT Analysis
- 16.2.4.4. Recent Developments
- 16.2.4.5. Financials (Based on Availability)
- 16.2.5 Zyla Life Sciences (Egalet Corporation)
- 16.2.5.1. Overview
- 16.2.5.2. Products
- 16.2.5.3. SWOT Analysis
- 16.2.5.4. Recent Developments
- 16.2.5.5. Financials (Based on Availability)
- 16.2.6 Alcaliber SA
- 16.2.6.1. Overview
- 16.2.6.2. Products
- 16.2.6.3. SWOT Analysis
- 16.2.6.4. Recent Developments
- 16.2.6.5. Financials (Based on Availability)
- 16.2.7 Hikma Pharmaceuticals PLC
- 16.2.7.1. Overview
- 16.2.7.2. Products
- 16.2.7.3. SWOT Analysis
- 16.2.7.4. Recent Developments
- 16.2.7.5. Financials (Based on Availability)
- 16.2.8 Johnson and Johnson
- 16.2.8.1. Overview
- 16.2.8.2. Products
- 16.2.8.3. SWOT Analysis
- 16.2.8.4. Recent Developments
- 16.2.8.5. Financials (Based on Availability)
- 16.2.9 Amneal Pharmaceuticals Inc
- 16.2.9.1. Overview
- 16.2.9.2. Products
- 16.2.9.3. SWOT Analysis
- 16.2.9.4. Recent Developments
- 16.2.9.5. Financials (Based on Availability)
- 16.2.10 Vertice Pharma LLC
- 16.2.10.1. Overview
- 16.2.10.2. Products
- 16.2.10.3. SWOT Analysis
- 16.2.10.4. Recent Developments
- 16.2.10.5. Financials (Based on Availability)
- 16.2.11 AbbVie Inc (Allergan PLC)
- 16.2.11.1. Overview
- 16.2.11.2. Products
- 16.2.11.3. SWOT Analysis
- 16.2.11.4. Recent Developments
- 16.2.11.5. Financials (Based on Availability)
- 16.2.12 Endo Pharmaceuticals Inc
- 16.2.12.1. Overview
- 16.2.12.2. Products
- 16.2.12.3. SWOT Analysis
- 16.2.12.4. Recent Developments
- 16.2.12.5. Financials (Based on Availability)
- 16.2.13 Sun Pharmaceutical Industries Ltd
- 16.2.13.1. Overview
- 16.2.13.2. Products
- 16.2.13.3. SWOT Analysis
- 16.2.13.4. Recent Developments
- 16.2.13.5. Financials (Based on Availability)
- 16.2.14 Pfizer Inc
- 16.2.14.1. Overview
- 16.2.14.2. Products
- 16.2.14.3. SWOT Analysis
- 16.2.14.4. Recent Developments
- 16.2.14.5. Financials (Based on Availability)
- 16.2.1 Teva Pharmaceuticals Inc
List of Figures
- Figure 1: Global Prescription Opioid Industry Revenue Breakdown (Million, %) by Region 2024 & 2032
- Figure 2: Global Prescription Opioid Industry Volume Breakdown (K Unit, %) by Region 2024 & 2032
- Figure 3: North America Prescription Opioid Industry Revenue (Million), by Country 2024 & 2032
- Figure 4: North America Prescription Opioid Industry Volume (K Unit), by Country 2024 & 2032
- Figure 5: North America Prescription Opioid Industry Revenue Share (%), by Country 2024 & 2032
- Figure 6: North America Prescription Opioid Industry Volume Share (%), by Country 2024 & 2032
- Figure 7: Europe Prescription Opioid Industry Revenue (Million), by Country 2024 & 2032
- Figure 8: Europe Prescription Opioid Industry Volume (K Unit), by Country 2024 & 2032
- Figure 9: Europe Prescription Opioid Industry Revenue Share (%), by Country 2024 & 2032
- Figure 10: Europe Prescription Opioid Industry Volume Share (%), by Country 2024 & 2032
- Figure 11: Asia Pacific Prescription Opioid Industry Revenue (Million), by Country 2024 & 2032
- Figure 12: Asia Pacific Prescription Opioid Industry Volume (K Unit), by Country 2024 & 2032
- Figure 13: Asia Pacific Prescription Opioid Industry Revenue Share (%), by Country 2024 & 2032
- Figure 14: Asia Pacific Prescription Opioid Industry Volume Share (%), by Country 2024 & 2032
- Figure 15: Middle East and Africa Prescription Opioid Industry Revenue (Million), by Country 2024 & 2032
- Figure 16: Middle East and Africa Prescription Opioid Industry Volume (K Unit), by Country 2024 & 2032
- Figure 17: Middle East and Africa Prescription Opioid Industry Revenue Share (%), by Country 2024 & 2032
- Figure 18: Middle East and Africa Prescription Opioid Industry Volume Share (%), by Country 2024 & 2032
- Figure 19: South America Prescription Opioid Industry Revenue (Million), by Country 2024 & 2032
- Figure 20: South America Prescription Opioid Industry Volume (K Unit), by Country 2024 & 2032
- Figure 21: South America Prescription Opioid Industry Revenue Share (%), by Country 2024 & 2032
- Figure 22: South America Prescription Opioid Industry Volume Share (%), by Country 2024 & 2032
- Figure 23: North America Prescription Opioid Industry Revenue (Million), by Product Type 2024 & 2032
- Figure 24: North America Prescription Opioid Industry Volume (K Unit), by Product Type 2024 & 2032
- Figure 25: North America Prescription Opioid Industry Revenue Share (%), by Product Type 2024 & 2032
- Figure 26: North America Prescription Opioid Industry Volume Share (%), by Product Type 2024 & 2032
- Figure 27: North America Prescription Opioid Industry Revenue (Million), by Receptor Binding 2024 & 2032
- Figure 28: North America Prescription Opioid Industry Volume (K Unit), by Receptor Binding 2024 & 2032
- Figure 29: North America Prescription Opioid Industry Revenue Share (%), by Receptor Binding 2024 & 2032
- Figure 30: North America Prescription Opioid Industry Volume Share (%), by Receptor Binding 2024 & 2032
- Figure 31: North America Prescription Opioid Industry Revenue (Million), by Application 2024 & 2032
- Figure 32: North America Prescription Opioid Industry Volume (K Unit), by Application 2024 & 2032
- Figure 33: North America Prescription Opioid Industry Revenue Share (%), by Application 2024 & 2032
- Figure 34: North America Prescription Opioid Industry Volume Share (%), by Application 2024 & 2032
- Figure 35: North America Prescription Opioid Industry Revenue (Million), by Country 2024 & 2032
- Figure 36: North America Prescription Opioid Industry Volume (K Unit), by Country 2024 & 2032
- Figure 37: North America Prescription Opioid Industry Revenue Share (%), by Country 2024 & 2032
- Figure 38: North America Prescription Opioid Industry Volume Share (%), by Country 2024 & 2032
- Figure 39: Europe Prescription Opioid Industry Revenue (Million), by Product Type 2024 & 2032
- Figure 40: Europe Prescription Opioid Industry Volume (K Unit), by Product Type 2024 & 2032
- Figure 41: Europe Prescription Opioid Industry Revenue Share (%), by Product Type 2024 & 2032
- Figure 42: Europe Prescription Opioid Industry Volume Share (%), by Product Type 2024 & 2032
- Figure 43: Europe Prescription Opioid Industry Revenue (Million), by Receptor Binding 2024 & 2032
- Figure 44: Europe Prescription Opioid Industry Volume (K Unit), by Receptor Binding 2024 & 2032
- Figure 45: Europe Prescription Opioid Industry Revenue Share (%), by Receptor Binding 2024 & 2032
- Figure 46: Europe Prescription Opioid Industry Volume Share (%), by Receptor Binding 2024 & 2032
- Figure 47: Europe Prescription Opioid Industry Revenue (Million), by Application 2024 & 2032
- Figure 48: Europe Prescription Opioid Industry Volume (K Unit), by Application 2024 & 2032
- Figure 49: Europe Prescription Opioid Industry Revenue Share (%), by Application 2024 & 2032
- Figure 50: Europe Prescription Opioid Industry Volume Share (%), by Application 2024 & 2032
- Figure 51: Europe Prescription Opioid Industry Revenue (Million), by Country 2024 & 2032
- Figure 52: Europe Prescription Opioid Industry Volume (K Unit), by Country 2024 & 2032
- Figure 53: Europe Prescription Opioid Industry Revenue Share (%), by Country 2024 & 2032
- Figure 54: Europe Prescription Opioid Industry Volume Share (%), by Country 2024 & 2032
- Figure 55: Asia Pacific Prescription Opioid Industry Revenue (Million), by Product Type 2024 & 2032
- Figure 56: Asia Pacific Prescription Opioid Industry Volume (K Unit), by Product Type 2024 & 2032
- Figure 57: Asia Pacific Prescription Opioid Industry Revenue Share (%), by Product Type 2024 & 2032
- Figure 58: Asia Pacific Prescription Opioid Industry Volume Share (%), by Product Type 2024 & 2032
- Figure 59: Asia Pacific Prescription Opioid Industry Revenue (Million), by Receptor Binding 2024 & 2032
- Figure 60: Asia Pacific Prescription Opioid Industry Volume (K Unit), by Receptor Binding 2024 & 2032
- Figure 61: Asia Pacific Prescription Opioid Industry Revenue Share (%), by Receptor Binding 2024 & 2032
- Figure 62: Asia Pacific Prescription Opioid Industry Volume Share (%), by Receptor Binding 2024 & 2032
- Figure 63: Asia Pacific Prescription Opioid Industry Revenue (Million), by Application 2024 & 2032
- Figure 64: Asia Pacific Prescription Opioid Industry Volume (K Unit), by Application 2024 & 2032
- Figure 65: Asia Pacific Prescription Opioid Industry Revenue Share (%), by Application 2024 & 2032
- Figure 66: Asia Pacific Prescription Opioid Industry Volume Share (%), by Application 2024 & 2032
- Figure 67: Asia Pacific Prescription Opioid Industry Revenue (Million), by Country 2024 & 2032
- Figure 68: Asia Pacific Prescription Opioid Industry Volume (K Unit), by Country 2024 & 2032
- Figure 69: Asia Pacific Prescription Opioid Industry Revenue Share (%), by Country 2024 & 2032
- Figure 70: Asia Pacific Prescription Opioid Industry Volume Share (%), by Country 2024 & 2032
- Figure 71: Middle East and Africa Prescription Opioid Industry Revenue (Million), by Product Type 2024 & 2032
- Figure 72: Middle East and Africa Prescription Opioid Industry Volume (K Unit), by Product Type 2024 & 2032
- Figure 73: Middle East and Africa Prescription Opioid Industry Revenue Share (%), by Product Type 2024 & 2032
- Figure 74: Middle East and Africa Prescription Opioid Industry Volume Share (%), by Product Type 2024 & 2032
- Figure 75: Middle East and Africa Prescription Opioid Industry Revenue (Million), by Receptor Binding 2024 & 2032
- Figure 76: Middle East and Africa Prescription Opioid Industry Volume (K Unit), by Receptor Binding 2024 & 2032
- Figure 77: Middle East and Africa Prescription Opioid Industry Revenue Share (%), by Receptor Binding 2024 & 2032
- Figure 78: Middle East and Africa Prescription Opioid Industry Volume Share (%), by Receptor Binding 2024 & 2032
- Figure 79: Middle East and Africa Prescription Opioid Industry Revenue (Million), by Application 2024 & 2032
- Figure 80: Middle East and Africa Prescription Opioid Industry Volume (K Unit), by Application 2024 & 2032
- Figure 81: Middle East and Africa Prescription Opioid Industry Revenue Share (%), by Application 2024 & 2032
- Figure 82: Middle East and Africa Prescription Opioid Industry Volume Share (%), by Application 2024 & 2032
- Figure 83: Middle East and Africa Prescription Opioid Industry Revenue (Million), by Country 2024 & 2032
- Figure 84: Middle East and Africa Prescription Opioid Industry Volume (K Unit), by Country 2024 & 2032
- Figure 85: Middle East and Africa Prescription Opioid Industry Revenue Share (%), by Country 2024 & 2032
- Figure 86: Middle East and Africa Prescription Opioid Industry Volume Share (%), by Country 2024 & 2032
- Figure 87: South America Prescription Opioid Industry Revenue (Million), by Product Type 2024 & 2032
- Figure 88: South America Prescription Opioid Industry Volume (K Unit), by Product Type 2024 & 2032
- Figure 89: South America Prescription Opioid Industry Revenue Share (%), by Product Type 2024 & 2032
- Figure 90: South America Prescription Opioid Industry Volume Share (%), by Product Type 2024 & 2032
- Figure 91: South America Prescription Opioid Industry Revenue (Million), by Receptor Binding 2024 & 2032
- Figure 92: South America Prescription Opioid Industry Volume (K Unit), by Receptor Binding 2024 & 2032
- Figure 93: South America Prescription Opioid Industry Revenue Share (%), by Receptor Binding 2024 & 2032
- Figure 94: South America Prescription Opioid Industry Volume Share (%), by Receptor Binding 2024 & 2032
- Figure 95: South America Prescription Opioid Industry Revenue (Million), by Application 2024 & 2032
- Figure 96: South America Prescription Opioid Industry Volume (K Unit), by Application 2024 & 2032
- Figure 97: South America Prescription Opioid Industry Revenue Share (%), by Application 2024 & 2032
- Figure 98: South America Prescription Opioid Industry Volume Share (%), by Application 2024 & 2032
- Figure 99: South America Prescription Opioid Industry Revenue (Million), by Country 2024 & 2032
- Figure 100: South America Prescription Opioid Industry Volume (K Unit), by Country 2024 & 2032
- Figure 101: South America Prescription Opioid Industry Revenue Share (%), by Country 2024 & 2032
- Figure 102: South America Prescription Opioid Industry Volume Share (%), by Country 2024 & 2032
List of Tables
- Table 1: Global Prescription Opioid Industry Revenue Million Forecast, by Region 2019 & 2032
- Table 2: Global Prescription Opioid Industry Volume K Unit Forecast, by Region 2019 & 2032
- Table 3: Global Prescription Opioid Industry Revenue Million Forecast, by Product Type 2019 & 2032
- Table 4: Global Prescription Opioid Industry Volume K Unit Forecast, by Product Type 2019 & 2032
- Table 5: Global Prescription Opioid Industry Revenue Million Forecast, by Receptor Binding 2019 & 2032
- Table 6: Global Prescription Opioid Industry Volume K Unit Forecast, by Receptor Binding 2019 & 2032
- Table 7: Global Prescription Opioid Industry Revenue Million Forecast, by Application 2019 & 2032
- Table 8: Global Prescription Opioid Industry Volume K Unit Forecast, by Application 2019 & 2032
- Table 9: Global Prescription Opioid Industry Revenue Million Forecast, by Region 2019 & 2032
- Table 10: Global Prescription Opioid Industry Volume K Unit Forecast, by Region 2019 & 2032
- Table 11: Global Prescription Opioid Industry Revenue Million Forecast, by Country 2019 & 2032
- Table 12: Global Prescription Opioid Industry Volume K Unit Forecast, by Country 2019 & 2032
- Table 13: Global Prescription Opioid Industry Revenue Million Forecast, by Country 2019 & 2032
- Table 14: Global Prescription Opioid Industry Volume K Unit Forecast, by Country 2019 & 2032
- Table 15: Global Prescription Opioid Industry Revenue Million Forecast, by Country 2019 & 2032
- Table 16: Global Prescription Opioid Industry Volume K Unit Forecast, by Country 2019 & 2032
- Table 17: Global Prescription Opioid Industry Revenue Million Forecast, by Country 2019 & 2032
- Table 18: Global Prescription Opioid Industry Volume K Unit Forecast, by Country 2019 & 2032
- Table 19: Global Prescription Opioid Industry Revenue Million Forecast, by Country 2019 & 2032
- Table 20: Global Prescription Opioid Industry Volume K Unit Forecast, by Country 2019 & 2032
- Table 21: Global Prescription Opioid Industry Revenue Million Forecast, by Product Type 2019 & 2032
- Table 22: Global Prescription Opioid Industry Volume K Unit Forecast, by Product Type 2019 & 2032
- Table 23: Global Prescription Opioid Industry Revenue Million Forecast, by Receptor Binding 2019 & 2032
- Table 24: Global Prescription Opioid Industry Volume K Unit Forecast, by Receptor Binding 2019 & 2032
- Table 25: Global Prescription Opioid Industry Revenue Million Forecast, by Application 2019 & 2032
- Table 26: Global Prescription Opioid Industry Volume K Unit Forecast, by Application 2019 & 2032
- Table 27: Global Prescription Opioid Industry Revenue Million Forecast, by Country 2019 & 2032
- Table 28: Global Prescription Opioid Industry Volume K Unit Forecast, by Country 2019 & 2032
- Table 29: United States Prescription Opioid Industry Revenue (Million) Forecast, by Application 2019 & 2032
- Table 30: United States Prescription Opioid Industry Volume (K Unit) Forecast, by Application 2019 & 2032
- Table 31: Canada Prescription Opioid Industry Revenue (Million) Forecast, by Application 2019 & 2032
- Table 32: Canada Prescription Opioid Industry Volume (K Unit) Forecast, by Application 2019 & 2032
- Table 33: Mexico Prescription Opioid Industry Revenue (Million) Forecast, by Application 2019 & 2032
- Table 34: Mexico Prescription Opioid Industry Volume (K Unit) Forecast, by Application 2019 & 2032
- Table 35: Global Prescription Opioid Industry Revenue Million Forecast, by Product Type 2019 & 2032
- Table 36: Global Prescription Opioid Industry Volume K Unit Forecast, by Product Type 2019 & 2032
- Table 37: Global Prescription Opioid Industry Revenue Million Forecast, by Receptor Binding 2019 & 2032
- Table 38: Global Prescription Opioid Industry Volume K Unit Forecast, by Receptor Binding 2019 & 2032
- Table 39: Global Prescription Opioid Industry Revenue Million Forecast, by Application 2019 & 2032
- Table 40: Global Prescription Opioid Industry Volume K Unit Forecast, by Application 2019 & 2032
- Table 41: Global Prescription Opioid Industry Revenue Million Forecast, by Country 2019 & 2032
- Table 42: Global Prescription Opioid Industry Volume K Unit Forecast, by Country 2019 & 2032
- Table 43: Germany Prescription Opioid Industry Revenue (Million) Forecast, by Application 2019 & 2032
- Table 44: Germany Prescription Opioid Industry Volume (K Unit) Forecast, by Application 2019 & 2032
- Table 45: United Kingdom Prescription Opioid Industry Revenue (Million) Forecast, by Application 2019 & 2032
- Table 46: United Kingdom Prescription Opioid Industry Volume (K Unit) Forecast, by Application 2019 & 2032
- Table 47: France Prescription Opioid Industry Revenue (Million) Forecast, by Application 2019 & 2032
- Table 48: France Prescription Opioid Industry Volume (K Unit) Forecast, by Application 2019 & 2032
- Table 49: Italy Prescription Opioid Industry Revenue (Million) Forecast, by Application 2019 & 2032
- Table 50: Italy Prescription Opioid Industry Volume (K Unit) Forecast, by Application 2019 & 2032
- Table 51: Spain Prescription Opioid Industry Revenue (Million) Forecast, by Application 2019 & 2032
- Table 52: Spain Prescription Opioid Industry Volume (K Unit) Forecast, by Application 2019 & 2032
- Table 53: Rest of Europe Prescription Opioid Industry Revenue (Million) Forecast, by Application 2019 & 2032
- Table 54: Rest of Europe Prescription Opioid Industry Volume (K Unit) Forecast, by Application 2019 & 2032
- Table 55: Global Prescription Opioid Industry Revenue Million Forecast, by Product Type 2019 & 2032
- Table 56: Global Prescription Opioid Industry Volume K Unit Forecast, by Product Type 2019 & 2032
- Table 57: Global Prescription Opioid Industry Revenue Million Forecast, by Receptor Binding 2019 & 2032
- Table 58: Global Prescription Opioid Industry Volume K Unit Forecast, by Receptor Binding 2019 & 2032
- Table 59: Global Prescription Opioid Industry Revenue Million Forecast, by Application 2019 & 2032
- Table 60: Global Prescription Opioid Industry Volume K Unit Forecast, by Application 2019 & 2032
- Table 61: Global Prescription Opioid Industry Revenue Million Forecast, by Country 2019 & 2032
- Table 62: Global Prescription Opioid Industry Volume K Unit Forecast, by Country 2019 & 2032
- Table 63: China Prescription Opioid Industry Revenue (Million) Forecast, by Application 2019 & 2032
- Table 64: China Prescription Opioid Industry Volume (K Unit) Forecast, by Application 2019 & 2032
- Table 65: Japan Prescription Opioid Industry Revenue (Million) Forecast, by Application 2019 & 2032
- Table 66: Japan Prescription Opioid Industry Volume (K Unit) Forecast, by Application 2019 & 2032
- Table 67: India Prescription Opioid Industry Revenue (Million) Forecast, by Application 2019 & 2032
- Table 68: India Prescription Opioid Industry Volume (K Unit) Forecast, by Application 2019 & 2032
- Table 69: Australia Prescription Opioid Industry Revenue (Million) Forecast, by Application 2019 & 2032
- Table 70: Australia Prescription Opioid Industry Volume (K Unit) Forecast, by Application 2019 & 2032
- Table 71: South Korea Prescription Opioid Industry Revenue (Million) Forecast, by Application 2019 & 2032
- Table 72: South Korea Prescription Opioid Industry Volume (K Unit) Forecast, by Application 2019 & 2032
- Table 73: Rest of Asia Pacific Prescription Opioid Industry Revenue (Million) Forecast, by Application 2019 & 2032
- Table 74: Rest of Asia Pacific Prescription Opioid Industry Volume (K Unit) Forecast, by Application 2019 & 2032
- Table 75: Global Prescription Opioid Industry Revenue Million Forecast, by Product Type 2019 & 2032
- Table 76: Global Prescription Opioid Industry Volume K Unit Forecast, by Product Type 2019 & 2032
- Table 77: Global Prescription Opioid Industry Revenue Million Forecast, by Receptor Binding 2019 & 2032
- Table 78: Global Prescription Opioid Industry Volume K Unit Forecast, by Receptor Binding 2019 & 2032
- Table 79: Global Prescription Opioid Industry Revenue Million Forecast, by Application 2019 & 2032
- Table 80: Global Prescription Opioid Industry Volume K Unit Forecast, by Application 2019 & 2032
- Table 81: Global Prescription Opioid Industry Revenue Million Forecast, by Country 2019 & 2032
- Table 82: Global Prescription Opioid Industry Volume K Unit Forecast, by Country 2019 & 2032
- Table 83: GCC Prescription Opioid Industry Revenue (Million) Forecast, by Application 2019 & 2032
- Table 84: GCC Prescription Opioid Industry Volume (K Unit) Forecast, by Application 2019 & 2032
- Table 85: South Africa Prescription Opioid Industry Revenue (Million) Forecast, by Application 2019 & 2032
- Table 86: South Africa Prescription Opioid Industry Volume (K Unit) Forecast, by Application 2019 & 2032
- Table 87: Rest of Middle East and Africa Prescription Opioid Industry Revenue (Million) Forecast, by Application 2019 & 2032
- Table 88: Rest of Middle East and Africa Prescription Opioid Industry Volume (K Unit) Forecast, by Application 2019 & 2032
- Table 89: Global Prescription Opioid Industry Revenue Million Forecast, by Product Type 2019 & 2032
- Table 90: Global Prescription Opioid Industry Volume K Unit Forecast, by Product Type 2019 & 2032
- Table 91: Global Prescription Opioid Industry Revenue Million Forecast, by Receptor Binding 2019 & 2032
- Table 92: Global Prescription Opioid Industry Volume K Unit Forecast, by Receptor Binding 2019 & 2032
- Table 93: Global Prescription Opioid Industry Revenue Million Forecast, by Application 2019 & 2032
- Table 94: Global Prescription Opioid Industry Volume K Unit Forecast, by Application 2019 & 2032
- Table 95: Global Prescription Opioid Industry Revenue Million Forecast, by Country 2019 & 2032
- Table 96: Global Prescription Opioid Industry Volume K Unit Forecast, by Country 2019 & 2032
- Table 97: Brazil Prescription Opioid Industry Revenue (Million) Forecast, by Application 2019 & 2032
- Table 98: Brazil Prescription Opioid Industry Volume (K Unit) Forecast, by Application 2019 & 2032
- Table 99: Argentina Prescription Opioid Industry Revenue (Million) Forecast, by Application 2019 & 2032
- Table 100: Argentina Prescription Opioid Industry Volume (K Unit) Forecast, by Application 2019 & 2032
- Table 101: Rest of South America Prescription Opioid Industry Revenue (Million) Forecast, by Application 2019 & 2032
- Table 102: Rest of South America Prescription Opioid Industry Volume (K Unit) Forecast, by Application 2019 & 2032
Frequently Asked Questions
1. What is the projected Compound Annual Growth Rate (CAGR) of the Prescription Opioid Industry?
The projected CAGR is approximately 3.75%.
2. Which companies are prominent players in the Prescription Opioid Industry?
Key companies in the market include Teva Pharmaceuticals Inc, Mallinckrodt Pharmaceuticals LLC, Purdue Pharmaceuticals L P, AcelRx Pharmaceuticals Inc, Zyla Life Sciences (Egalet Corporation), Alcaliber SA, Hikma Pharmaceuticals PLC, Johnson and Johnson, Amneal Pharmaceuticals Inc, Vertice Pharma LLC, AbbVie Inc (Allergan PLC), Endo Pharmaceuticals Inc, Sun Pharmaceutical Industries Ltd, Pfizer Inc.
3. What are the main segments of the Prescription Opioid Industry?
The market segments include Product Type, Receptor Binding, Application.
4. Can you provide details about the market size?
The market size is estimated to be USD 23.94 Million as of 2022.
5. What are some drivers contributing to market growth?
Rising Prevalence of Orthopedic Diseases and Chronic Pain; Inclination toward Extended Release Formulations from Immediate Release of Opioids; Rising Focus on Abuse-deterrent Formulation (ADF) by Generic Manufacturers.
6. What are the notable trends driving market growth?
Strong Agonists are Expected to Hold Significant Market Share in the Receptor Binding Segment.
7. Are there any restraints impacting market growth?
Advent and Legalization of Cannabis as an Alternative to Opioids; Prescription Drug Abuse.
8. Can you provide examples of recent developments in the market?
In January 2022, Trevena, Inc. announced that China's National Medical Products Administration (NMPA) has accepted the submission of a New Drug Application (NDA) for OLINVYK (oliceridine) injection, a novel IV analgesic that has been approved in the United States by the Food and Drug Administration (FDA) for use in adults for the management of acute pain severe enough to require an intravenous opioid analgesic
9. What pricing options are available for accessing the report?
Pricing options include single-user, multi-user, and enterprise licenses priced at USD 4750, USD 5250, and USD 8750 respectively.
10. Is the market size provided in terms of value or volume?
The market size is provided in terms of value, measured in Million and volume, measured in K Unit.
11. Are there any specific market keywords associated with the report?
Yes, the market keyword associated with the report is "Prescription Opioid Industry," which aids in identifying and referencing the specific market segment covered.
12. How do I determine which pricing option suits my needs best?
The pricing options vary based on user requirements and access needs. Individual users may opt for single-user licenses, while businesses requiring broader access may choose multi-user or enterprise licenses for cost-effective access to the report.
13. Are there any additional resources or data provided in the Prescription Opioid Industry report?
While the report offers comprehensive insights, it's advisable to review the specific contents or supplementary materials provided to ascertain if additional resources or data are available.
14. How can I stay updated on further developments or reports in the Prescription Opioid Industry?
To stay informed about further developments, trends, and reports in the Prescription Opioid Industry, consider subscribing to industry newsletters, following relevant companies and organizations, or regularly checking reputable industry news sources and publications.
Methodology
Step 1 - Identification of Relevant Samples Size from Population Database


Step 2 - Approaches for Defining Global Market Size (Value, Volume* & Price*)

Note*: In applicable scenarios
Step 3 - Data Sources
Primary Research
- Web Analytics
- Survey Reports
- Research Institute
- Latest Research Reports
- Opinion Leaders
Secondary Research
- Annual Reports
- White Paper
- Latest Press Release
- Industry Association
- Paid Database
- Investor Presentations

Step 4 - Data Triangulation
Involves using different sources of information in order to increase the validity of a study
These sources are likely to be stakeholders in a program - participants, other researchers, program staff, other community members, and so on.
Then we put all data in single framework & apply various statistical tools to find out the dynamic on the market.
During the analysis stage, feedback from the stakeholder groups would be compared to determine areas of agreement as well as areas of divergence
