

Key Insights
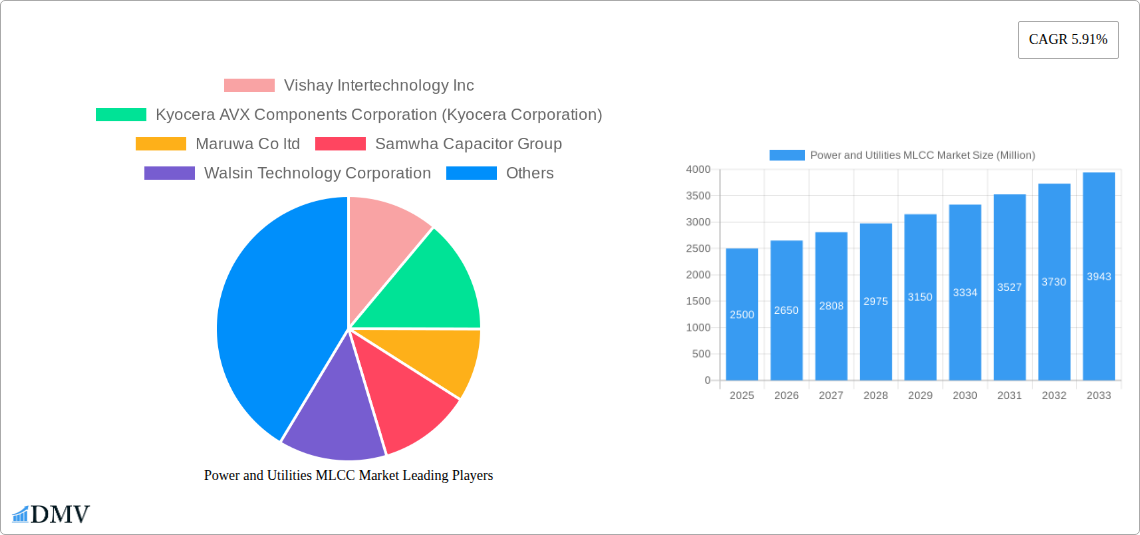
The Power and Utilities Multilayer Ceramic Capacitor (MLCC) market is experiencing robust growth, driven by the increasing demand for reliable and efficient power grids and smart utility infrastructure. A CAGR of 5.91% from 2019 to 2024 suggests a strong upward trajectory, projected to continue into the forecast period (2025-2033). Key drivers include the expansion of renewable energy sources (solar, wind), the growing adoption of smart meters and grid modernization initiatives, and the increasing integration of electronic controls in power distribution and transmission systems. Market segmentation reveals a significant demand across various capacitance ranges (10 μF to 100 μF being particularly prominent), voltage ratings (with 600V to 1100V and less than 600V segments showing strong growth), and case sizes. The market is characterized by a competitive landscape with key players like Vishay Intertechnology, Kyocera AVX, Murata Manufacturing, and TDK Corporation vying for market share through product innovation and strategic partnerships. While potential restraints include supply chain disruptions and material cost fluctuations, the overall market outlook remains positive, fueled by continuous technological advancements and the imperative for enhanced grid reliability and efficiency.
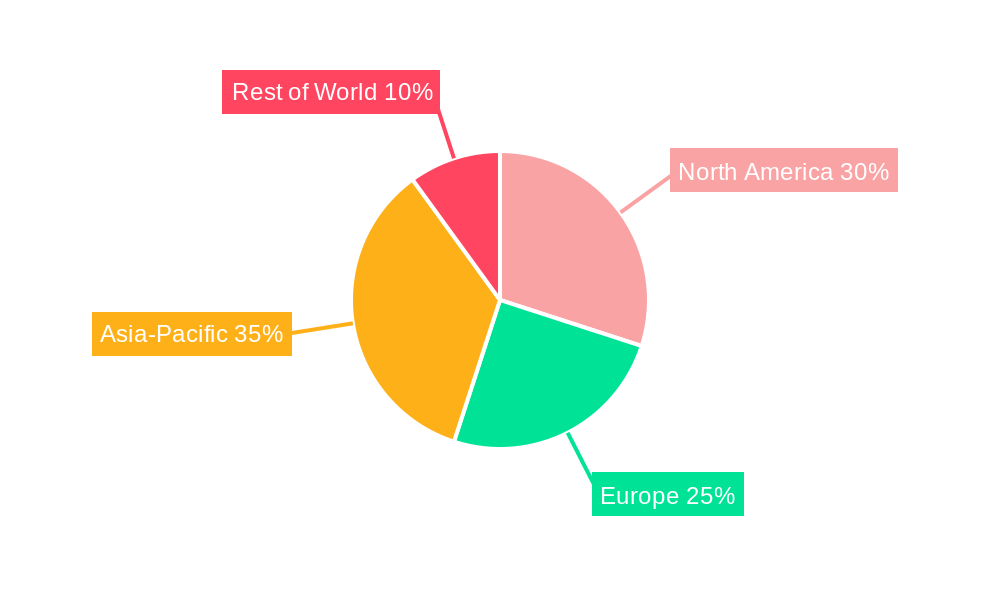
The continued expansion of smart grids and the increasing penetration of renewable energy sources will significantly impact the market’s growth trajectory in the coming years. The demand for higher capacitance and voltage-rated MLCCs is expected to rise, particularly in applications requiring high energy storage and surge protection. The ongoing miniaturization trend in electronic components is also creating opportunities for smaller-sized MLCCs, driving innovation in packaging and materials. While geographical variations may exist in market penetration and growth rates, the global nature of the power and utilities industry ensures broad distribution of MLCC applications across various regions. Companies are likely to focus on developing advanced MLCC technologies with enhanced performance characteristics like higher temperature stability and improved reliability to cater to the stringent requirements of the power and utilities sector.
Power and Utilities MLCC Market: A Comprehensive Market Report (2019-2033)
This insightful report provides a detailed analysis of the Power and Utilities Multilayer Ceramic Capacitor (MLCC) market, offering a comprehensive overview of market trends, competitive landscape, and future growth prospects. The study period spans from 2019 to 2033, with 2025 serving as the base and estimated year. The forecast period extends from 2025 to 2033, covering both historical (2019-2024) and projected market dynamics. This report is crucial for stakeholders seeking to understand the intricacies of this dynamic market and make informed strategic decisions.
Power and Utilities MLCC Market Composition & Trends
The Power and Utilities MLCC market is characterized by a moderately concentrated landscape, with key players vying for market share. The report analyzes the competitive intensity, examining market share distribution amongst leading companies like Vishay Intertechnology Inc, Kyocera AVX Components Corporation, Murata Manufacturing Co Ltd, TDK Corporation, and others. While precise market share figures for each company remain proprietary to the full report, the analysis reveals a dynamic interplay between established players and emerging competitors.
- Market Concentration: The market exhibits a [xx]% concentration ratio (CRx), indicating [description of market concentration - e.g., moderate concentration, high fragmentation etc.].
- Innovation Catalysts: The demand for miniaturization, increased energy efficiency, and improved reliability in power and utility applications fuels continuous innovation in MLCC technology.
- Regulatory Landscape: Stringent safety and performance standards governing the power and utilities sector directly impact MLCC specifications and market growth. [Further detail on specific regulations will be included in the full report].
- Substitute Products: The report analyzes potential substitute technologies and their competitive impact on MLCC adoption. [Specific substitutes and their market penetration will be detailed in the full report].
- End-User Profiles: The report profiles key end-users across various power and utility segments, including power generation, transmission, and distribution. [Specific end-user data will be shown in the full report].
- M&A Activities: The report identifies significant mergers and acquisitions (M&A) activities within the Power and Utilities MLCC market, quantifying their impact on market consolidation and technological advancement. [Specific M&A deals and their values, if publicly available, will be documented within the full report]. The total value of M&A deals in the past 5 years is estimated at $xx Million.
Power and Utilities MLCC Market Industry Evolution
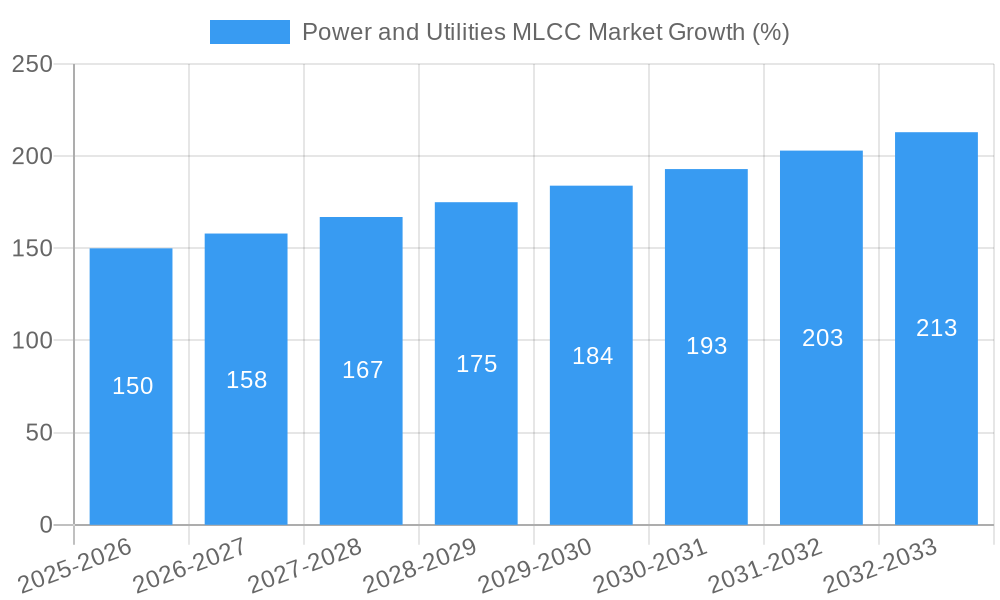
The Power and Utilities MLCC market has witnessed significant growth over the past five years, driven by factors like the increasing adoption of renewable energy sources, the expansion of smart grids, and the growing demand for energy-efficient electronic devices. This report details the market's growth trajectory, outlining technological advancements and shifts in consumer demand. The market is projected to grow at a CAGR of [xx]% from 2025 to 2033, reaching a market value of $xx Million by 2033.
Key technological advancements such as the development of high-capacitance, high-temperature, and low-ESL MLCCs have significantly enhanced the performance and reliability of power and utility equipment. Furthermore, the miniaturization of MLCCs has enabled the design of more compact and efficient power systems. The shift towards higher voltage applications (beyond 1100V) is also a significant trend shaping the market, driving demand for specialized MLCCs that can withstand extreme operating conditions. The full report details the specific adoption metrics for different MLCC technologies within the power and utilities sector.
Leading Regions, Countries, or Segments in Power and Utilities MLCC Market
The report pinpoints the dominant regions, countries, and market segments within the Power and Utilities MLCC market. While the exact ranking and market share breakdowns will be presented in the comprehensive report, initial analysis suggests [Region/Country] holds a leading position, driven by several factors.
- Key Drivers:
- [Specific details on investment trends in the leading region/country].
- [Specific details on relevant regulatory support provided to the industry].
- [Specific details on other influential factors driving market dominance].
Dominance Factors: The dominance of [Region/Country] or a specific segment (e.g., Class X7R dielectric type, specific case size) is analyzed comprehensively. This analysis includes factors such as:
- Strong industrial base: [Region/Country] possesses a robust industrial sector with a large number of power and utility infrastructure projects underway, driving demand for MLCCs.
- Government initiatives: [Specific details on governmental policies and support programs that facilitate market expansion].
- Technological advancements: The region/country may be a hub for technological innovation in MLCC technology, thereby attracting investments and driving manufacturing.
- Specific segment analysis: Detailed analysis of the dominant segment (e.g., voltage range, capacitance range, dielectric type) and associated reasons for its high demand.
Power and Utilities MLCC Market Product Innovations
Recent product innovations in the MLCC market focus on enhancing performance parameters such as capacitance, voltage rating, and temperature stability. Manufacturers are developing high-capacitance MLCCs for energy storage applications, high-voltage MLCCs for high-power systems, and miniaturized MLCCs for space-constrained designs. These innovations aim to address the evolving needs of power and utility applications, offering improved efficiency, reliability, and miniaturization. Unique selling propositions often include improved ESR (Equivalent Series Resistance), lower ESL (Equivalent Series Inductance), and enhanced operating temperature ranges.
Propelling Factors for Power and Utilities MLCC Market Growth
Several factors contribute to the growth of the Power and Utilities MLCC market. Technological advancements in MLCC design and manufacturing, leading to improved performance characteristics and miniaturization, are a key driver. The increasing adoption of renewable energy sources and smart grids further stimulates demand for reliable and efficient energy storage and management systems. Moreover, stringent government regulations on energy efficiency and grid stability create incentives for the adoption of advanced MLCC technologies.
Obstacles in the Power and Utilities MLCC Market
The Power and Utilities MLCC market faces challenges, including supply chain disruptions, particularly pronounced during periods of global uncertainty. These disruptions can lead to increased component costs and delivery delays. Furthermore, intense competition amongst MLCC manufacturers can pressure profit margins. Regulatory changes and stringent quality standards also add to the complexity of the market. The full report quantifies the impact of these obstacles on market growth.
Future Opportunities in Power and Utilities MLCC Market
Emerging opportunities in the Power and Utilities MLCC market include the growth of electric vehicles (EVs), the expansion of 5G networks, and the increasing demand for energy storage solutions. The development of advanced MLCC technologies tailored to these applications will further expand the market. New materials and manufacturing processes promise to enhance MLCC performance and reduce costs.
Major Players in the Power and Utilities MLCC Market Ecosystem
- Vishay Intertechnology Inc
- Kyocera AVX Components Corporation (Kyocera Corporation)
- Maruwa Co ltd
- Samwha Capacitor Group
- Walsin Technology Corporation
- Samsung Electro-Mechanics
- Würth Elektronik GmbH & Co KG
- Yageo Corporation
- Taiyo Yuden Co Ltd
- TDK Corporation
- Murata Manufacturing Co Ltd
- Nippon Chemi-Con Corporation
Key Developments in Power and Utilities MLCC Market Industry
- June 2023: [Company Name - specify which company introduced NTS/NTF series] introduced the NTS/NTF Series of SMD type MLCCs, designed for applications such as on-board power supplies and DC-DC converters. This signifies a response to the growing demand for industrial equipment.
- July 2022: Walsin Technology Corporation expanded its MLCC product portfolio with high-capacitance, high-temperature, and miniaturized MLCCs. This highlights the ongoing efforts to meet the diverse needs of the power and utilities sector.
- June 2022: Yageo Corporation launched its CL series MLCCs, characterized by low ESL, addressing the need for noise reduction and improved stability in power line operations.
Strategic Power and Utilities MLCC Market Forecast
The Power and Utilities MLCC market is poised for significant growth in the coming years, driven by technological advancements, the expanding renewable energy sector, and increasing demand for energy-efficient solutions. The market's future potential is substantial, with opportunities in emerging applications such as electric vehicles and smart grids. Continued innovation in MLCC technology, along with supportive government policies, will further propel market expansion.
Power and Utilities MLCC Market Segmentation
-
1. Case Size
- 1.1. 1210
- 1.2. 1812
- 1.3. 2 220
- 1.4. 3 640
- 1.5. 4 540
- 1.6. Others
-
2. Voltage
- 2.1. 600V to 1100V
- 2.2. Less than 600V
- 2.3. More than 1100V
-
3. Capacitance
- 3.1. 10 μF to 100 μF
- 3.2. Less than 10 μF
- 3.3. More than 100 μF
-
4. Dielectric Type
- 4.1. Class 1
- 4.2. Class 2
Power and Utilities MLCC Market Segmentation By Geography
-
1. North America
- 1.1. United States
- 1.2. Canada
- 1.3. Mexico
-
2. South America
- 2.1. Brazil
- 2.2. Argentina
- 2.3. Rest of South America
-
3. Europe
- 3.1. United Kingdom
- 3.2. Germany
- 3.3. France
- 3.4. Italy
- 3.5. Spain
- 3.6. Russia
- 3.7. Benelux
- 3.8. Nordics
- 3.9. Rest of Europe
-
4. Middle East & Africa
- 4.1. Turkey
- 4.2. Israel
- 4.3. GCC
- 4.4. North Africa
- 4.5. South Africa
- 4.6. Rest of Middle East & Africa
-
5. Asia Pacific
- 5.1. China
- 5.2. India
- 5.3. Japan
- 5.4. South Korea
- 5.5. ASEAN
- 5.6. Oceania
- 5.7. Rest of Asia Pacific
Power and Utilities MLCC Market REPORT HIGHLIGHTS
| Aspects | Details |
|---|---|
| Study Period | 2019-2033 |
| Base Year | 2024 |
| Estimated Year | 2025 |
| Forecast Period | 2025-2033 |
| Historical Period | 2019-2024 |
| Growth Rate | CAGR of 5.91% from 2019-2033 |
| Segmentation |
|
Table of Contents
- 1. Introduction
- 1.1. Research Scope
- 1.2. Market Segmentation
- 1.3. Research Methodology
- 1.4. Definitions and Assumptions
- 2. Executive Summary
- 2.1. Introduction
- 3. Market Dynamics
- 3.1. Introduction
- 3.2. Market Drivers
- 3.2.1. Rise in the Applications of Semiconductors; Advancement in Technology Such as Magnetron Sputtering Technology
- 3.3. Market Restrains
- 3.3.1. Rise of Alternative Technologies Such as Thermal Evaporation
- 3.4. Market Trends
- 3.4.1. OTHER KEY INDUSTRY TRENDS COVERED IN THE REPORT
- 4. Market Factor Analysis
- 4.1. Porters Five Forces
- 4.2. Supply/Value Chain
- 4.3. PESTEL analysis
- 4.4. Market Entropy
- 4.5. Patent/Trademark Analysis
- 5. Global Power and Utilities MLCC Market Analysis, Insights and Forecast, 2019-2031
- 5.1. Market Analysis, Insights and Forecast - by Case Size
- 5.1.1. 1210
- 5.1.2. 1812
- 5.1.3. 2 220
- 5.1.4. 3 640
- 5.1.5. 4 540
- 5.1.6. Others
- 5.2. Market Analysis, Insights and Forecast - by Voltage
- 5.2.1. 600V to 1100V
- 5.2.2. Less than 600V
- 5.2.3. More than 1100V
- 5.3. Market Analysis, Insights and Forecast - by Capacitance
- 5.3.1. 10 μF to 100 μF
- 5.3.2. Less than 10 μF
- 5.3.3. More than 100 μF
- 5.4. Market Analysis, Insights and Forecast - by Dielectric Type
- 5.4.1. Class 1
- 5.4.2. Class 2
- 5.5. Market Analysis, Insights and Forecast - by Region
- 5.5.1. North America
- 5.5.2. South America
- 5.5.3. Europe
- 5.5.4. Middle East & Africa
- 5.5.5. Asia Pacific
- 5.1. Market Analysis, Insights and Forecast - by Case Size
- 6. North America Power and Utilities MLCC Market Analysis, Insights and Forecast, 2019-2031
- 6.1. Market Analysis, Insights and Forecast - by Case Size
- 6.1.1. 1210
- 6.1.2. 1812
- 6.1.3. 2 220
- 6.1.4. 3 640
- 6.1.5. 4 540
- 6.1.6. Others
- 6.2. Market Analysis, Insights and Forecast - by Voltage
- 6.2.1. 600V to 1100V
- 6.2.2. Less than 600V
- 6.2.3. More than 1100V
- 6.3. Market Analysis, Insights and Forecast - by Capacitance
- 6.3.1. 10 μF to 100 μF
- 6.3.2. Less than 10 μF
- 6.3.3. More than 100 μF
- 6.4. Market Analysis, Insights and Forecast - by Dielectric Type
- 6.4.1. Class 1
- 6.4.2. Class 2
- 6.1. Market Analysis, Insights and Forecast - by Case Size
- 7. South America Power and Utilities MLCC Market Analysis, Insights and Forecast, 2019-2031
- 7.1. Market Analysis, Insights and Forecast - by Case Size
- 7.1.1. 1210
- 7.1.2. 1812
- 7.1.3. 2 220
- 7.1.4. 3 640
- 7.1.5. 4 540
- 7.1.6. Others
- 7.2. Market Analysis, Insights and Forecast - by Voltage
- 7.2.1. 600V to 1100V
- 7.2.2. Less than 600V
- 7.2.3. More than 1100V
- 7.3. Market Analysis, Insights and Forecast - by Capacitance
- 7.3.1. 10 μF to 100 μF
- 7.3.2. Less than 10 μF
- 7.3.3. More than 100 μF
- 7.4. Market Analysis, Insights and Forecast - by Dielectric Type
- 7.4.1. Class 1
- 7.4.2. Class 2
- 7.1. Market Analysis, Insights and Forecast - by Case Size
- 8. Europe Power and Utilities MLCC Market Analysis, Insights and Forecast, 2019-2031
- 8.1. Market Analysis, Insights and Forecast - by Case Size
- 8.1.1. 1210
- 8.1.2. 1812
- 8.1.3. 2 220
- 8.1.4. 3 640
- 8.1.5. 4 540
- 8.1.6. Others
- 8.2. Market Analysis, Insights and Forecast - by Voltage
- 8.2.1. 600V to 1100V
- 8.2.2. Less than 600V
- 8.2.3. More than 1100V
- 8.3. Market Analysis, Insights and Forecast - by Capacitance
- 8.3.1. 10 μF to 100 μF
- 8.3.2. Less than 10 μF
- 8.3.3. More than 100 μF
- 8.4. Market Analysis, Insights and Forecast - by Dielectric Type
- 8.4.1. Class 1
- 8.4.2. Class 2
- 8.1. Market Analysis, Insights and Forecast - by Case Size
- 9. Middle East & Africa Power and Utilities MLCC Market Analysis, Insights and Forecast, 2019-2031
- 9.1. Market Analysis, Insights and Forecast - by Case Size
- 9.1.1. 1210
- 9.1.2. 1812
- 9.1.3. 2 220
- 9.1.4. 3 640
- 9.1.5. 4 540
- 9.1.6. Others
- 9.2. Market Analysis, Insights and Forecast - by Voltage
- 9.2.1. 600V to 1100V
- 9.2.2. Less than 600V
- 9.2.3. More than 1100V
- 9.3. Market Analysis, Insights and Forecast - by Capacitance
- 9.3.1. 10 μF to 100 μF
- 9.3.2. Less than 10 μF
- 9.3.3. More than 100 μF
- 9.4. Market Analysis, Insights and Forecast - by Dielectric Type
- 9.4.1. Class 1
- 9.4.2. Class 2
- 9.1. Market Analysis, Insights and Forecast - by Case Size
- 10. Asia Pacific Power and Utilities MLCC Market Analysis, Insights and Forecast, 2019-2031
- 10.1. Market Analysis, Insights and Forecast - by Case Size
- 10.1.1. 1210
- 10.1.2. 1812
- 10.1.3. 2 220
- 10.1.4. 3 640
- 10.1.5. 4 540
- 10.1.6. Others
- 10.2. Market Analysis, Insights and Forecast - by Voltage
- 10.2.1. 600V to 1100V
- 10.2.2. Less than 600V
- 10.2.3. More than 1100V
- 10.3. Market Analysis, Insights and Forecast - by Capacitance
- 10.3.1. 10 μF to 100 μF
- 10.3.2. Less than 10 μF
- 10.3.3. More than 100 μF
- 10.4. Market Analysis, Insights and Forecast - by Dielectric Type
- 10.4.1. Class 1
- 10.4.2. Class 2
- 10.1. Market Analysis, Insights and Forecast - by Case Size
- 11. Competitive Analysis
- 11.1. Global Market Share Analysis 2024
- 11.2. Company Profiles
- 11.2.1 Vishay Intertechnology Inc
- 11.2.1.1. Overview
- 11.2.1.2. Products
- 11.2.1.3. SWOT Analysis
- 11.2.1.4. Recent Developments
- 11.2.1.5. Financials (Based on Availability)
- 11.2.2 Kyocera AVX Components Corporation (Kyocera Corporation)
- 11.2.2.1. Overview
- 11.2.2.2. Products
- 11.2.2.3. SWOT Analysis
- 11.2.2.4. Recent Developments
- 11.2.2.5. Financials (Based on Availability)
- 11.2.3 Maruwa Co ltd
- 11.2.3.1. Overview
- 11.2.3.2. Products
- 11.2.3.3. SWOT Analysis
- 11.2.3.4. Recent Developments
- 11.2.3.5. Financials (Based on Availability)
- 11.2.4 Samwha Capacitor Group
- 11.2.4.1. Overview
- 11.2.4.2. Products
- 11.2.4.3. SWOT Analysis
- 11.2.4.4. Recent Developments
- 11.2.4.5. Financials (Based on Availability)
- 11.2.5 Walsin Technology Corporation
- 11.2.5.1. Overview
- 11.2.5.2. Products
- 11.2.5.3. SWOT Analysis
- 11.2.5.4. Recent Developments
- 11.2.5.5. Financials (Based on Availability)
- 11.2.6 Samsung Electro-Mechanics
- 11.2.6.1. Overview
- 11.2.6.2. Products
- 11.2.6.3. SWOT Analysis
- 11.2.6.4. Recent Developments
- 11.2.6.5. Financials (Based on Availability)
- 11.2.7 Würth Elektronik GmbH & Co KG
- 11.2.7.1. Overview
- 11.2.7.2. Products
- 11.2.7.3. SWOT Analysis
- 11.2.7.4. Recent Developments
- 11.2.7.5. Financials (Based on Availability)
- 11.2.8 Yageo Corporatio
- 11.2.8.1. Overview
- 11.2.8.2. Products
- 11.2.8.3. SWOT Analysis
- 11.2.8.4. Recent Developments
- 11.2.8.5. Financials (Based on Availability)
- 11.2.9 Taiyo Yuden Co Ltd
- 11.2.9.1. Overview
- 11.2.9.2. Products
- 11.2.9.3. SWOT Analysis
- 11.2.9.4. Recent Developments
- 11.2.9.5. Financials (Based on Availability)
- 11.2.10 TDK Corporation
- 11.2.10.1. Overview
- 11.2.10.2. Products
- 11.2.10.3. SWOT Analysis
- 11.2.10.4. Recent Developments
- 11.2.10.5. Financials (Based on Availability)
- 11.2.11 Murata Manufacturing Co Ltd
- 11.2.11.1. Overview
- 11.2.11.2. Products
- 11.2.11.3. SWOT Analysis
- 11.2.11.4. Recent Developments
- 11.2.11.5. Financials (Based on Availability)
- 11.2.12 Nippon Chemi-Con Corporation
- 11.2.12.1. Overview
- 11.2.12.2. Products
- 11.2.12.3. SWOT Analysis
- 11.2.12.4. Recent Developments
- 11.2.12.5. Financials (Based on Availability)
- 11.2.1 Vishay Intertechnology Inc
List of Figures
- Figure 1: Global Power and Utilities MLCC Market Revenue Breakdown (Million, %) by Region 2024 & 2032
- Figure 2: North America Power and Utilities MLCC Market Revenue (Million), by Case Size 2024 & 2032
- Figure 3: North America Power and Utilities MLCC Market Revenue Share (%), by Case Size 2024 & 2032
- Figure 4: North America Power and Utilities MLCC Market Revenue (Million), by Voltage 2024 & 2032
- Figure 5: North America Power and Utilities MLCC Market Revenue Share (%), by Voltage 2024 & 2032
- Figure 6: North America Power and Utilities MLCC Market Revenue (Million), by Capacitance 2024 & 2032
- Figure 7: North America Power and Utilities MLCC Market Revenue Share (%), by Capacitance 2024 & 2032
- Figure 8: North America Power and Utilities MLCC Market Revenue (Million), by Dielectric Type 2024 & 2032
- Figure 9: North America Power and Utilities MLCC Market Revenue Share (%), by Dielectric Type 2024 & 2032
- Figure 10: North America Power and Utilities MLCC Market Revenue (Million), by Country 2024 & 2032
- Figure 11: North America Power and Utilities MLCC Market Revenue Share (%), by Country 2024 & 2032
- Figure 12: South America Power and Utilities MLCC Market Revenue (Million), by Case Size 2024 & 2032
- Figure 13: South America Power and Utilities MLCC Market Revenue Share (%), by Case Size 2024 & 2032
- Figure 14: South America Power and Utilities MLCC Market Revenue (Million), by Voltage 2024 & 2032
- Figure 15: South America Power and Utilities MLCC Market Revenue Share (%), by Voltage 2024 & 2032
- Figure 16: South America Power and Utilities MLCC Market Revenue (Million), by Capacitance 2024 & 2032
- Figure 17: South America Power and Utilities MLCC Market Revenue Share (%), by Capacitance 2024 & 2032
- Figure 18: South America Power and Utilities MLCC Market Revenue (Million), by Dielectric Type 2024 & 2032
- Figure 19: South America Power and Utilities MLCC Market Revenue Share (%), by Dielectric Type 2024 & 2032
- Figure 20: South America Power and Utilities MLCC Market Revenue (Million), by Country 2024 & 2032
- Figure 21: South America Power and Utilities MLCC Market Revenue Share (%), by Country 2024 & 2032
- Figure 22: Europe Power and Utilities MLCC Market Revenue (Million), by Case Size 2024 & 2032
- Figure 23: Europe Power and Utilities MLCC Market Revenue Share (%), by Case Size 2024 & 2032
- Figure 24: Europe Power and Utilities MLCC Market Revenue (Million), by Voltage 2024 & 2032
- Figure 25: Europe Power and Utilities MLCC Market Revenue Share (%), by Voltage 2024 & 2032
- Figure 26: Europe Power and Utilities MLCC Market Revenue (Million), by Capacitance 2024 & 2032
- Figure 27: Europe Power and Utilities MLCC Market Revenue Share (%), by Capacitance 2024 & 2032
- Figure 28: Europe Power and Utilities MLCC Market Revenue (Million), by Dielectric Type 2024 & 2032
- Figure 29: Europe Power and Utilities MLCC Market Revenue Share (%), by Dielectric Type 2024 & 2032
- Figure 30: Europe Power and Utilities MLCC Market Revenue (Million), by Country 2024 & 2032
- Figure 31: Europe Power and Utilities MLCC Market Revenue Share (%), by Country 2024 & 2032
- Figure 32: Middle East & Africa Power and Utilities MLCC Market Revenue (Million), by Case Size 2024 & 2032
- Figure 33: Middle East & Africa Power and Utilities MLCC Market Revenue Share (%), by Case Size 2024 & 2032
- Figure 34: Middle East & Africa Power and Utilities MLCC Market Revenue (Million), by Voltage 2024 & 2032
- Figure 35: Middle East & Africa Power and Utilities MLCC Market Revenue Share (%), by Voltage 2024 & 2032
- Figure 36: Middle East & Africa Power and Utilities MLCC Market Revenue (Million), by Capacitance 2024 & 2032
- Figure 37: Middle East & Africa Power and Utilities MLCC Market Revenue Share (%), by Capacitance 2024 & 2032
- Figure 38: Middle East & Africa Power and Utilities MLCC Market Revenue (Million), by Dielectric Type 2024 & 2032
- Figure 39: Middle East & Africa Power and Utilities MLCC Market Revenue Share (%), by Dielectric Type 2024 & 2032
- Figure 40: Middle East & Africa Power and Utilities MLCC Market Revenue (Million), by Country 2024 & 2032
- Figure 41: Middle East & Africa Power and Utilities MLCC Market Revenue Share (%), by Country 2024 & 2032
- Figure 42: Asia Pacific Power and Utilities MLCC Market Revenue (Million), by Case Size 2024 & 2032
- Figure 43: Asia Pacific Power and Utilities MLCC Market Revenue Share (%), by Case Size 2024 & 2032
- Figure 44: Asia Pacific Power and Utilities MLCC Market Revenue (Million), by Voltage 2024 & 2032
- Figure 45: Asia Pacific Power and Utilities MLCC Market Revenue Share (%), by Voltage 2024 & 2032
- Figure 46: Asia Pacific Power and Utilities MLCC Market Revenue (Million), by Capacitance 2024 & 2032
- Figure 47: Asia Pacific Power and Utilities MLCC Market Revenue Share (%), by Capacitance 2024 & 2032
- Figure 48: Asia Pacific Power and Utilities MLCC Market Revenue (Million), by Dielectric Type 2024 & 2032
- Figure 49: Asia Pacific Power and Utilities MLCC Market Revenue Share (%), by Dielectric Type 2024 & 2032
- Figure 50: Asia Pacific Power and Utilities MLCC Market Revenue (Million), by Country 2024 & 2032
- Figure 51: Asia Pacific Power and Utilities MLCC Market Revenue Share (%), by Country 2024 & 2032
List of Tables
- Table 1: Global Power and Utilities MLCC Market Revenue Million Forecast, by Region 2019 & 2032
- Table 2: Global Power and Utilities MLCC Market Revenue Million Forecast, by Case Size 2019 & 2032
- Table 3: Global Power and Utilities MLCC Market Revenue Million Forecast, by Voltage 2019 & 2032
- Table 4: Global Power and Utilities MLCC Market Revenue Million Forecast, by Capacitance 2019 & 2032
- Table 5: Global Power and Utilities MLCC Market Revenue Million Forecast, by Dielectric Type 2019 & 2032
- Table 6: Global Power and Utilities MLCC Market Revenue Million Forecast, by Region 2019 & 2032
- Table 7: Global Power and Utilities MLCC Market Revenue Million Forecast, by Case Size 2019 & 2032
- Table 8: Global Power and Utilities MLCC Market Revenue Million Forecast, by Voltage 2019 & 2032
- Table 9: Global Power and Utilities MLCC Market Revenue Million Forecast, by Capacitance 2019 & 2032
- Table 10: Global Power and Utilities MLCC Market Revenue Million Forecast, by Dielectric Type 2019 & 2032
- Table 11: Global Power and Utilities MLCC Market Revenue Million Forecast, by Country 2019 & 2032
- Table 12: United States Power and Utilities MLCC Market Revenue (Million) Forecast, by Application 2019 & 2032
- Table 13: Canada Power and Utilities MLCC Market Revenue (Million) Forecast, by Application 2019 & 2032
- Table 14: Mexico Power and Utilities MLCC Market Revenue (Million) Forecast, by Application 2019 & 2032
- Table 15: Global Power and Utilities MLCC Market Revenue Million Forecast, by Case Size 2019 & 2032
- Table 16: Global Power and Utilities MLCC Market Revenue Million Forecast, by Voltage 2019 & 2032
- Table 17: Global Power and Utilities MLCC Market Revenue Million Forecast, by Capacitance 2019 & 2032
- Table 18: Global Power and Utilities MLCC Market Revenue Million Forecast, by Dielectric Type 2019 & 2032
- Table 19: Global Power and Utilities MLCC Market Revenue Million Forecast, by Country 2019 & 2032
- Table 20: Brazil Power and Utilities MLCC Market Revenue (Million) Forecast, by Application 2019 & 2032
- Table 21: Argentina Power and Utilities MLCC Market Revenue (Million) Forecast, by Application 2019 & 2032
- Table 22: Rest of South America Power and Utilities MLCC Market Revenue (Million) Forecast, by Application 2019 & 2032
- Table 23: Global Power and Utilities MLCC Market Revenue Million Forecast, by Case Size 2019 & 2032
- Table 24: Global Power and Utilities MLCC Market Revenue Million Forecast, by Voltage 2019 & 2032
- Table 25: Global Power and Utilities MLCC Market Revenue Million Forecast, by Capacitance 2019 & 2032
- Table 26: Global Power and Utilities MLCC Market Revenue Million Forecast, by Dielectric Type 2019 & 2032
- Table 27: Global Power and Utilities MLCC Market Revenue Million Forecast, by Country 2019 & 2032
- Table 28: United Kingdom Power and Utilities MLCC Market Revenue (Million) Forecast, by Application 2019 & 2032
- Table 29: Germany Power and Utilities MLCC Market Revenue (Million) Forecast, by Application 2019 & 2032
- Table 30: France Power and Utilities MLCC Market Revenue (Million) Forecast, by Application 2019 & 2032
- Table 31: Italy Power and Utilities MLCC Market Revenue (Million) Forecast, by Application 2019 & 2032
- Table 32: Spain Power and Utilities MLCC Market Revenue (Million) Forecast, by Application 2019 & 2032
- Table 33: Russia Power and Utilities MLCC Market Revenue (Million) Forecast, by Application 2019 & 2032
- Table 34: Benelux Power and Utilities MLCC Market Revenue (Million) Forecast, by Application 2019 & 2032
- Table 35: Nordics Power and Utilities MLCC Market Revenue (Million) Forecast, by Application 2019 & 2032
- Table 36: Rest of Europe Power and Utilities MLCC Market Revenue (Million) Forecast, by Application 2019 & 2032
- Table 37: Global Power and Utilities MLCC Market Revenue Million Forecast, by Case Size 2019 & 2032
- Table 38: Global Power and Utilities MLCC Market Revenue Million Forecast, by Voltage 2019 & 2032
- Table 39: Global Power and Utilities MLCC Market Revenue Million Forecast, by Capacitance 2019 & 2032
- Table 40: Global Power and Utilities MLCC Market Revenue Million Forecast, by Dielectric Type 2019 & 2032
- Table 41: Global Power and Utilities MLCC Market Revenue Million Forecast, by Country 2019 & 2032
- Table 42: Turkey Power and Utilities MLCC Market Revenue (Million) Forecast, by Application 2019 & 2032
- Table 43: Israel Power and Utilities MLCC Market Revenue (Million) Forecast, by Application 2019 & 2032
- Table 44: GCC Power and Utilities MLCC Market Revenue (Million) Forecast, by Application 2019 & 2032
- Table 45: North Africa Power and Utilities MLCC Market Revenue (Million) Forecast, by Application 2019 & 2032
- Table 46: South Africa Power and Utilities MLCC Market Revenue (Million) Forecast, by Application 2019 & 2032
- Table 47: Rest of Middle East & Africa Power and Utilities MLCC Market Revenue (Million) Forecast, by Application 2019 & 2032
- Table 48: Global Power and Utilities MLCC Market Revenue Million Forecast, by Case Size 2019 & 2032
- Table 49: Global Power and Utilities MLCC Market Revenue Million Forecast, by Voltage 2019 & 2032
- Table 50: Global Power and Utilities MLCC Market Revenue Million Forecast, by Capacitance 2019 & 2032
- Table 51: Global Power and Utilities MLCC Market Revenue Million Forecast, by Dielectric Type 2019 & 2032
- Table 52: Global Power and Utilities MLCC Market Revenue Million Forecast, by Country 2019 & 2032
- Table 53: China Power and Utilities MLCC Market Revenue (Million) Forecast, by Application 2019 & 2032
- Table 54: India Power and Utilities MLCC Market Revenue (Million) Forecast, by Application 2019 & 2032
- Table 55: Japan Power and Utilities MLCC Market Revenue (Million) Forecast, by Application 2019 & 2032
- Table 56: South Korea Power and Utilities MLCC Market Revenue (Million) Forecast, by Application 2019 & 2032
- Table 57: ASEAN Power and Utilities MLCC Market Revenue (Million) Forecast, by Application 2019 & 2032
- Table 58: Oceania Power and Utilities MLCC Market Revenue (Million) Forecast, by Application 2019 & 2032
- Table 59: Rest of Asia Pacific Power and Utilities MLCC Market Revenue (Million) Forecast, by Application 2019 & 2032
Frequently Asked Questions
1. What is the projected Compound Annual Growth Rate (CAGR) of the Power and Utilities MLCC Market?
The projected CAGR is approximately 5.91%.
2. Which companies are prominent players in the Power and Utilities MLCC Market?
Key companies in the market include Vishay Intertechnology Inc, Kyocera AVX Components Corporation (Kyocera Corporation), Maruwa Co ltd, Samwha Capacitor Group, Walsin Technology Corporation, Samsung Electro-Mechanics, Würth Elektronik GmbH & Co KG, Yageo Corporatio, Taiyo Yuden Co Ltd, TDK Corporation, Murata Manufacturing Co Ltd, Nippon Chemi-Con Corporation.
3. What are the main segments of the Power and Utilities MLCC Market?
The market segments include Case Size, Voltage, Capacitance, Dielectric Type.
4. Can you provide details about the market size?
The market size is estimated to be USD XX Million as of 2022.
5. What are some drivers contributing to market growth?
Rise in the Applications of Semiconductors; Advancement in Technology Such as Magnetron Sputtering Technology.
6. What are the notable trends driving market growth?
OTHER KEY INDUSTRY TRENDS COVERED IN THE REPORT.
7. Are there any restraints impacting market growth?
Rise of Alternative Technologies Such as Thermal Evaporation.
8. Can you provide examples of recent developments in the market?
June 2023: The growing demand for industrial equipments has driven the company to introduce NTS/NTF NTS/NTF Series of SMD type MLCC. These capacitors are rated with 25 to 500 Vdc with a capacitance ranging from 0.010 to 47µF. These MLCCs are used in on-board power supplies,voltage regulators for computers,smoothing circuit of DC-DC converters,etc.July 2022: In 2022, Walsin Technology developed and released several new MLCC products are
9. What pricing options are available for accessing the report?
Pricing options include single-user, multi-user, and enterprise licenses priced at USD 3800, USD 4500, and USD 5800 respectively.
10. Is the market size provided in terms of value or volume?
The market size is provided in terms of value, measured in Million.
11. Are there any specific market keywords associated with the report?
Yes, the market keyword associated with the report is "Power and Utilities MLCC Market," which aids in identifying and referencing the specific market segment covered.
12. How do I determine which pricing option suits my needs best?
The pricing options vary based on user requirements and access needs. Individual users may opt for single-user licenses, while businesses requiring broader access may choose multi-user or enterprise licenses for cost-effective access to the report.
13. Are there any additional resources or data provided in the Power and Utilities MLCC Market report?
While the report offers comprehensive insights, it's advisable to review the specific contents or supplementary materials provided to ascertain if additional resources or data are available.
14. How can I stay updated on further developments or reports in the Power and Utilities MLCC Market?
To stay informed about further developments, trends, and reports in the Power and Utilities MLCC Market, consider subscribing to industry newsletters, following relevant companies and organizations, or regularly checking reputable industry news sources and publications.
Methodology
Step 1 - Identification of Relevant Samples Size from Population Database


Step 2 - Approaches for Defining Global Market Size (Value, Volume* & Price*)

Note*: In applicable scenarios
Step 3 - Data Sources
Primary Research
- Web Analytics
- Survey Reports
- Research Institute
- Latest Research Reports
- Opinion Leaders
Secondary Research
- Annual Reports
- White Paper
- Latest Press Release
- Industry Association
- Paid Database
- Investor Presentations

Step 4 - Data Triangulation
Involves using different sources of information in order to increase the validity of a study
These sources are likely to be stakeholders in a program - participants, other researchers, program staff, other community members, and so on.
Then we put all data in single framework & apply various statistical tools to find out the dynamic on the market.
During the analysis stage, feedback from the stakeholder groups would be compared to determine areas of agreement as well as areas of divergence
