

Key Insights
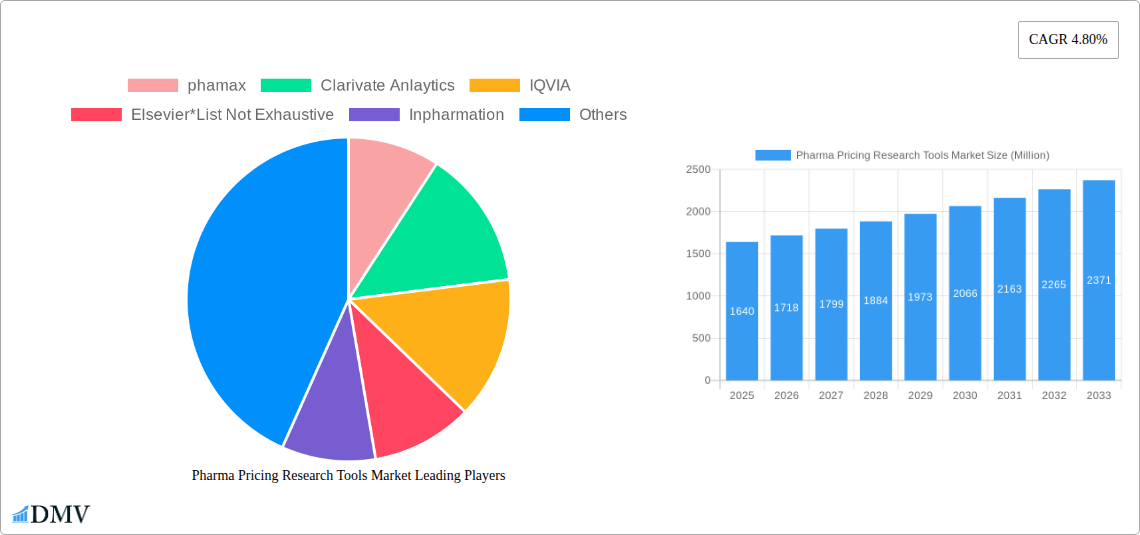
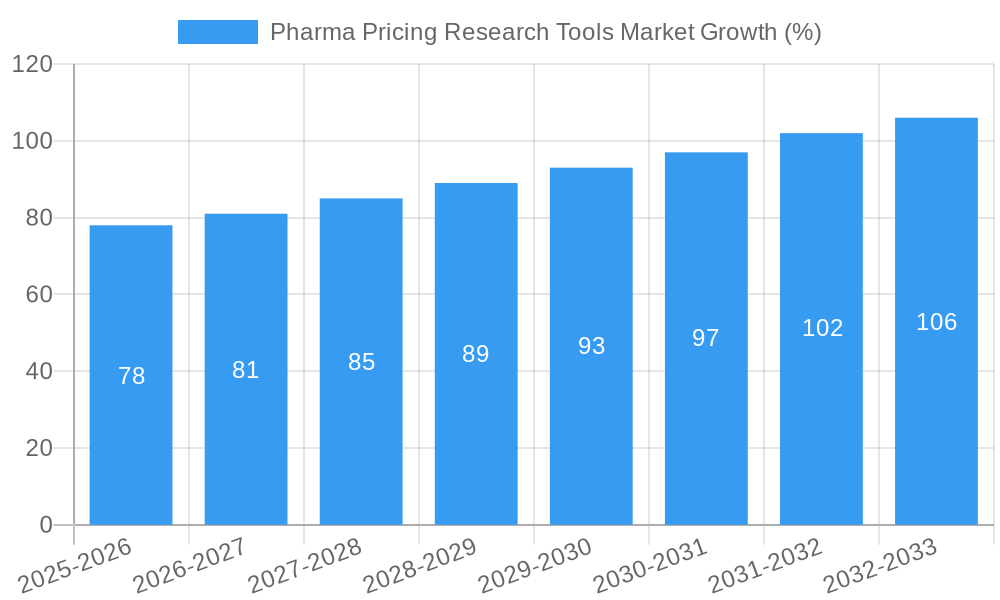
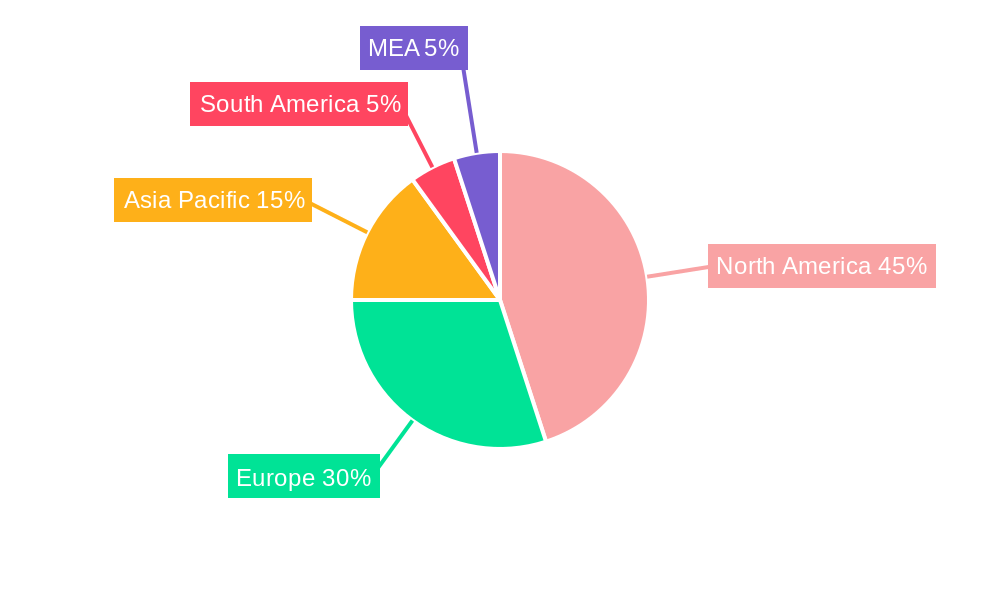
The Pharma Pricing Research Tools market, valued at $1.64 billion in 2025, is projected to experience robust growth, driven by increasing regulatory scrutiny, the need for efficient pricing strategies in a complex pharmaceutical landscape, and the rising adoption of advanced analytics. The market's Compound Annual Growth Rate (CAGR) of 4.80% from 2025 to 2033 indicates a steady expansion, fueled by pharmaceutical companies' desire to optimize pricing decisions and ensure compliance. Key market segments include market-based, value-based, and cost-based pricing models, with applications spanning prescription and over-the-counter drugs. North America currently holds a significant market share, owing to strong regulatory frameworks and high pharmaceutical spending, followed by Europe and Asia Pacific. The competitive landscape comprises established players like IQVIA, Elsevier, and Clarivate Analytics, alongside specialized providers such as Phamax and Inpharmation. These companies are constantly innovating to offer comprehensive tools incorporating data analytics, predictive modeling, and regulatory compliance features. The market's growth trajectory is further bolstered by increasing investments in data-driven decision-making within the pharmaceutical industry, necessitating sophisticated tools for price optimization and risk mitigation.
Further growth will be influenced by several factors. Advancements in data analytics and artificial intelligence will enable more precise pricing models, leading to enhanced market penetration. However, challenges like data privacy concerns and the need for continuous software updates might pose limitations. The increasing prevalence of value-based healthcare reimbursement models is expected to stimulate demand for tools that facilitate the assessment of drug value and efficacy, contributing to positive growth within the value-based pricing segment. Competitive pricing strategies employed by existing and emerging market players will continue to shape the market dynamics. Geographic expansion, particularly in emerging markets, will unlock additional growth opportunities as pharmaceutical industries in these regions continue to expand. The continued evolution of healthcare regulations globally will also necessitate continuous adaptation and innovation within the pharma pricing research tools market.
Pharma Pricing Research Tools Market: A Comprehensive Report (2019-2033)
This insightful report provides a deep dive into the dynamic Pharma Pricing Research Tools Market, offering a comprehensive analysis of market trends, leading players, and future growth prospects. Valued at $XX Million in 2025, the market is poised for significant expansion, reaching $XX Million by 2033, exhibiting a CAGR of XX% during the forecast period (2025-2033). The study covers the historical period (2019-2024), with 2025 serving as the base year. This report is essential for stakeholders seeking to understand the complexities of this rapidly evolving market and make informed strategic decisions.
Pharma Pricing Research Tools Market Composition & Trends
The Pharma Pricing Research Tools Market is characterized by moderate concentration, with key players such as phamax, Clarivate Analytics, IQVIA, Elsevier, Inpharmation, Wolters Kluwer N.V., Veeva Systems, and Avalere Health LLC holding significant market share. However, the market also features several smaller, specialized players, indicating a competitive landscape. Market share distribution varies significantly by tool type and application, with market-based pricing tools currently holding the largest segment.
Market Dynamics:
- Innovation Catalysts: The increasing complexity of pharmaceutical pricing regulations and the growing need for data-driven decision-making are driving innovation in pricing research tools. Advancements in AI and machine learning are particularly impactful.
- Regulatory Landscape: Stringent regulatory frameworks across different geographies significantly influence pricing strategies and the demand for compliant tools. Changes in these regulations directly affect market growth.
- Substitute Products: While dedicated pricing tools exist, some functionalities overlap with broader market research and data analytics platforms, creating a degree of substitutability.
- End-User Profiles: The market primarily serves pharmaceutical companies, healthcare providers, and regulatory bodies. Each segment has unique needs, influencing the features and functionality of the preferred tools.
- M&A Activities: The market has witnessed several M&A activities in recent years, with deal values ranging from $XX Million to $XX Million. These acquisitions often aim to expand product portfolios and market reach. For instance, in [Year], [Company A] acquired [Company B] for $XX Million, significantly impacting market dynamics. This trend is expected to continue.
Pharma Pricing Research Tools Market Industry Evolution
The Pharma Pricing Research Tools Market has witnessed substantial growth driven by several factors. The historical period (2019-2024) saw a CAGR of XX%, primarily fueled by the increasing adoption of value-based pricing models and the growing need for sophisticated data analytics in pharmaceutical pricing. Technological advancements such as the integration of AI and machine learning capabilities into pricing tools have significantly improved accuracy and efficiency. Simultaneously, shifting consumer demands for greater transparency in pharmaceutical pricing have also driven market expansion.
Further, the market is witnessing the increasing use of cloud-based solutions, leading to improved accessibility and scalability. The adoption rate of cloud-based pharma pricing research tools has increased by XX% in the past five years. This trend is expected to continue, with the forecast period (2025-2033) projecting a CAGR of XX%, driven by the continued adoption of advanced analytical capabilities and the expansion into emerging markets. The rise of real-world evidence (RWE) and its incorporation into pricing decisions will further propel market growth.
Leading Regions, Countries, or Segments in Pharma Pricing Research Tools Market
The North American region currently holds the dominant position in the Pharma Pricing Research Tools Market, accounting for approximately XX% of the global market share in 2025. This dominance is primarily attributed to:
- High Investment in R&D: Extensive investments in pharmaceutical research and development in North America fuels the need for sophisticated pricing tools.
- Stringent Regulatory Environment: The highly regulated pharmaceutical market in North America necessitates the use of compliant pricing tools.
- High Adoption of Advanced Technologies: The region exhibits a high adoption rate of advanced technologies, including AI and machine learning, impacting the demand for sophisticated pricing solutions.
Segment Analysis:
- By Type: The Value-Based Pricing segment is experiencing rapid growth, driven by the increasing focus on patient outcomes and cost-effectiveness.
- By Application: The Prescription Drugs segment currently dominates, owing to the complex pricing structures and regulatory requirements associated with prescription medications. However, the Over-the-Counter (OTC) segment is projected to witness significant growth in the coming years.
Pharma Pricing Research Tools Market Product Innovations
Recent innovations focus on integrating advanced analytics, such as predictive modeling and machine learning, into pricing tools. This enables more accurate forecasting of market trends and optimal price setting. The integration of real-world evidence (RWE) into pricing models is also gaining traction, leading to more data-driven and evidence-based decision-making. Furthermore, cloud-based platforms offer enhanced scalability, accessibility, and collaboration capabilities. Key selling propositions emphasize data accuracy, regulatory compliance, and ease of use.
Propelling Factors for Pharma Pricing Research Tools Market Growth
Several factors are propelling the growth of the Pharma Pricing Research Tools Market:
- Technological Advancements: The integration of AI, machine learning, and big data analytics enhances the accuracy and efficiency of pricing models.
- Regulatory Changes: Shifting regulatory landscapes, especially concerning value-based pricing, necessitate advanced pricing tools.
- Increased Competition: The intense competition in the pharmaceutical industry drives the need for optimized pricing strategies supported by robust analytics.
Obstacles in the Pharma Pricing Research Tools Market
Despite significant growth potential, several obstacles hinder market expansion:
- High Implementation Costs: The initial investment in implementing these tools can be substantial, particularly for smaller pharmaceutical companies.
- Data Privacy Concerns: Handling sensitive patient data necessitates robust security measures, adding to the complexity and cost.
- Lack of Skilled Professionals: The effective use of these advanced tools requires specialized expertise, creating a talent gap.
Future Opportunities in Pharma Pricing Research Tools Market
Emerging opportunities lie in expanding into new markets, such as developing countries with growing pharmaceutical industries, and integrating innovative technologies, such as blockchain for secure data management. Further opportunities include the development of tools that cater to personalized pricing models and the incorporation of insights from social media analytics to better understand consumer preferences and pricing sensitivities.
Major Players in the Pharma Pricing Research Tools Market Ecosystem
- phamax
- Clarivate Analytics
- IQVIA
- Elsevier
- Inpharmation
- Wolters Kluwer N.V.
- Veeva Systems
- Avalere Health LLC
Key Developments in Pharma Pricing Research Tools Market Industry
- [Month, Year]: Phamax launched a new AI-powered pricing tool.
- [Month, Year]: Clarivate Analytics acquired a smaller pricing analytics firm.
- [Month, Year]: IQVIA announced a strategic partnership to expand its RWE capabilities in pricing. (Add more entries as needed)
Strategic Pharma Pricing Research Tools Market Forecast
The Pharma Pricing Research Tools Market is expected to experience sustained growth, driven by technological advancements, regulatory changes, and increasing competition. The focus on value-based pricing, personalized medicine, and the utilization of real-world evidence will continue to shape market dynamics. This presents significant opportunities for established players and new entrants alike, prompting further innovation and market expansion throughout the forecast period.
Pharma Pricing Research Tools Market Segmentation
-
1. Application
- 1.1. Prescription Drugs
- 1.2. Over-the-counter Drugs
-
2. Type
- 2.1. Market-Based Pricing
- 2.2. Value-Based Pricing
- 2.3. Cost-based pricing
Pharma Pricing Research Tools Market Segmentation By Geography
-
1. North America
- 1.1. United States
- 1.2. Canada
- 1.3. Mexico
-
2. Europe
- 2.1. Germany
- 2.2. United Kingdom
- 2.3. France
- 2.4. Italy
- 2.5. Spain
- 2.6. Rest of Europe
- 3. Rest of the World
Pharma Pricing Research Tools Market REPORT HIGHLIGHTS
| Aspects | Details |
|---|---|
| Study Period | 2019-2033 |
| Base Year | 2024 |
| Estimated Year | 2025 |
| Forecast Period | 2025-2033 |
| Historical Period | 2019-2024 |
| Growth Rate | CAGR of 4.80% from 2019-2033 |
| Segmentation |
|
Table of Contents
- 1. Introduction
- 1.1. Research Scope
- 1.2. Market Segmentation
- 1.3. Research Methodology
- 1.4. Definitions and Assumptions
- 2. Executive Summary
- 2.1. Introduction
- 3. Market Dynamics
- 3.1. Introduction
- 3.2. Market Drivers
- 3.2.1. Increasing Complexity of Pharmaceutical Pricing; Rising Demand for Pricing Research & Analytics in Healthcare
- 3.3. Market Restrains
- 3.3.1. Lack of Standardization in Underdeveloped Countries
- 3.4. Market Trends
- 3.4.1. The Over-the-Counter Segment is Expected to Show Healthy Growth Over the Forecast Period
- 4. Market Factor Analysis
- 4.1. Porters Five Forces
- 4.2. Supply/Value Chain
- 4.3. PESTEL analysis
- 4.4. Market Entropy
- 4.5. Patent/Trademark Analysis
- 5. Global Pharma Pricing Research Tools Market Analysis, Insights and Forecast, 2019-2031
- 5.1. Market Analysis, Insights and Forecast - by Application
- 5.1.1. Prescription Drugs
- 5.1.2. Over-the-counter Drugs
- 5.2. Market Analysis, Insights and Forecast - by Type
- 5.2.1. Market-Based Pricing
- 5.2.2. Value-Based Pricing
- 5.2.3. Cost-based pricing
- 5.3. Market Analysis, Insights and Forecast - by Region
- 5.3.1. North America
- 5.3.2. Europe
- 5.3.3. Rest of the World
- 5.1. Market Analysis, Insights and Forecast - by Application
- 6. North America Pharma Pricing Research Tools Market Analysis, Insights and Forecast, 2019-2031
- 6.1. Market Analysis, Insights and Forecast - by Application
- 6.1.1. Prescription Drugs
- 6.1.2. Over-the-counter Drugs
- 6.2. Market Analysis, Insights and Forecast - by Type
- 6.2.1. Market-Based Pricing
- 6.2.2. Value-Based Pricing
- 6.2.3. Cost-based pricing
- 6.1. Market Analysis, Insights and Forecast - by Application
- 7. Europe Pharma Pricing Research Tools Market Analysis, Insights and Forecast, 2019-2031
- 7.1. Market Analysis, Insights and Forecast - by Application
- 7.1.1. Prescription Drugs
- 7.1.2. Over-the-counter Drugs
- 7.2. Market Analysis, Insights and Forecast - by Type
- 7.2.1. Market-Based Pricing
- 7.2.2. Value-Based Pricing
- 7.2.3. Cost-based pricing
- 7.1. Market Analysis, Insights and Forecast - by Application
- 8. Rest of the World Pharma Pricing Research Tools Market Analysis, Insights and Forecast, 2019-2031
- 8.1. Market Analysis, Insights and Forecast - by Application
- 8.1.1. Prescription Drugs
- 8.1.2. Over-the-counter Drugs
- 8.2. Market Analysis, Insights and Forecast - by Type
- 8.2.1. Market-Based Pricing
- 8.2.2. Value-Based Pricing
- 8.2.3. Cost-based pricing
- 8.1. Market Analysis, Insights and Forecast - by Application
- 9. North America Pharma Pricing Research Tools Market Analysis, Insights and Forecast, 2019-2031
- 9.1. Market Analysis, Insights and Forecast - By Country/Sub-region
- 9.1.1 United States
- 9.1.2 Canada
- 9.1.3 Mexico
- 10. Europe Pharma Pricing Research Tools Market Analysis, Insights and Forecast, 2019-2031
- 10.1. Market Analysis, Insights and Forecast - By Country/Sub-region
- 10.1.1 Germany
- 10.1.2 United Kingdom
- 10.1.3 France
- 10.1.4 Spain
- 10.1.5 Italy
- 10.1.6 Spain
- 10.1.7 Belgium
- 10.1.8 Netherland
- 10.1.9 Nordics
- 10.1.10 Rest of Europe
- 11. Asia Pacific Pharma Pricing Research Tools Market Analysis, Insights and Forecast, 2019-2031
- 11.1. Market Analysis, Insights and Forecast - By Country/Sub-region
- 11.1.1 China
- 11.1.2 Japan
- 11.1.3 India
- 11.1.4 South Korea
- 11.1.5 Southeast Asia
- 11.1.6 Australia
- 11.1.7 Indonesia
- 11.1.8 Phillipes
- 11.1.9 Singapore
- 11.1.10 Thailandc
- 11.1.11 Rest of Asia Pacific
- 12. South America Pharma Pricing Research Tools Market Analysis, Insights and Forecast, 2019-2031
- 12.1. Market Analysis, Insights and Forecast - By Country/Sub-region
- 12.1.1 Brazil
- 12.1.2 Argentina
- 12.1.3 Peru
- 12.1.4 Chile
- 12.1.5 Colombia
- 12.1.6 Ecuador
- 12.1.7 Venezuela
- 12.1.8 Rest of South America
- 13. North America Pharma Pricing Research Tools Market Analysis, Insights and Forecast, 2019-2031
- 13.1. Market Analysis, Insights and Forecast - By Country/Sub-region
- 13.1.1 United States
- 13.1.2 Canada
- 13.1.3 Mexico
- 14. MEA Pharma Pricing Research Tools Market Analysis, Insights and Forecast, 2019-2031
- 14.1. Market Analysis, Insights and Forecast - By Country/Sub-region
- 14.1.1 United Arab Emirates
- 14.1.2 Saudi Arabia
- 14.1.3 South Africa
- 14.1.4 Rest of Middle East and Africa
- 15. Competitive Analysis
- 15.1. Global Market Share Analysis 2024
- 15.2. Company Profiles
- 15.2.1 phamax
- 15.2.1.1. Overview
- 15.2.1.2. Products
- 15.2.1.3. SWOT Analysis
- 15.2.1.4. Recent Developments
- 15.2.1.5. Financials (Based on Availability)
- 15.2.2 Clarivate Anlaytics
- 15.2.2.1. Overview
- 15.2.2.2. Products
- 15.2.2.3. SWOT Analysis
- 15.2.2.4. Recent Developments
- 15.2.2.5. Financials (Based on Availability)
- 15.2.3 IQVIA
- 15.2.3.1. Overview
- 15.2.3.2. Products
- 15.2.3.3. SWOT Analysis
- 15.2.3.4. Recent Developments
- 15.2.3.5. Financials (Based on Availability)
- 15.2.4 Elsevier*List Not Exhaustive
- 15.2.4.1. Overview
- 15.2.4.2. Products
- 15.2.4.3. SWOT Analysis
- 15.2.4.4. Recent Developments
- 15.2.4.5. Financials (Based on Availability)
- 15.2.5 Inpharmation
- 15.2.5.1. Overview
- 15.2.5.2. Products
- 15.2.5.3. SWOT Analysis
- 15.2.5.4. Recent Developments
- 15.2.5.5. Financials (Based on Availability)
- 15.2.6 Wolters Kluwer N V
- 15.2.6.1. Overview
- 15.2.6.2. Products
- 15.2.6.3. SWOT Analysis
- 15.2.6.4. Recent Developments
- 15.2.6.5. Financials (Based on Availability)
- 15.2.7 Veeva Systems
- 15.2.7.1. Overview
- 15.2.7.2. Products
- 15.2.7.3. SWOT Analysis
- 15.2.7.4. Recent Developments
- 15.2.7.5. Financials (Based on Availability)
- 15.2.8 Avalere Health LLC
- 15.2.8.1. Overview
- 15.2.8.2. Products
- 15.2.8.3. SWOT Analysis
- 15.2.8.4. Recent Developments
- 15.2.8.5. Financials (Based on Availability)
- 15.2.1 phamax
List of Figures
- Figure 1: Global Pharma Pricing Research Tools Market Revenue Breakdown (Million, %) by Region 2024 & 2032
- Figure 2: North America Pharma Pricing Research Tools Market Revenue (Million), by Country 2024 & 2032
- Figure 3: North America Pharma Pricing Research Tools Market Revenue Share (%), by Country 2024 & 2032
- Figure 4: Europe Pharma Pricing Research Tools Market Revenue (Million), by Country 2024 & 2032
- Figure 5: Europe Pharma Pricing Research Tools Market Revenue Share (%), by Country 2024 & 2032
- Figure 6: Asia Pacific Pharma Pricing Research Tools Market Revenue (Million), by Country 2024 & 2032
- Figure 7: Asia Pacific Pharma Pricing Research Tools Market Revenue Share (%), by Country 2024 & 2032
- Figure 8: South America Pharma Pricing Research Tools Market Revenue (Million), by Country 2024 & 2032
- Figure 9: South America Pharma Pricing Research Tools Market Revenue Share (%), by Country 2024 & 2032
- Figure 10: North America Pharma Pricing Research Tools Market Revenue (Million), by Country 2024 & 2032
- Figure 11: North America Pharma Pricing Research Tools Market Revenue Share (%), by Country 2024 & 2032
- Figure 12: MEA Pharma Pricing Research Tools Market Revenue (Million), by Country 2024 & 2032
- Figure 13: MEA Pharma Pricing Research Tools Market Revenue Share (%), by Country 2024 & 2032
- Figure 14: North America Pharma Pricing Research Tools Market Revenue (Million), by Application 2024 & 2032
- Figure 15: North America Pharma Pricing Research Tools Market Revenue Share (%), by Application 2024 & 2032
- Figure 16: North America Pharma Pricing Research Tools Market Revenue (Million), by Type 2024 & 2032
- Figure 17: North America Pharma Pricing Research Tools Market Revenue Share (%), by Type 2024 & 2032
- Figure 18: North America Pharma Pricing Research Tools Market Revenue (Million), by Country 2024 & 2032
- Figure 19: North America Pharma Pricing Research Tools Market Revenue Share (%), by Country 2024 & 2032
- Figure 20: Europe Pharma Pricing Research Tools Market Revenue (Million), by Application 2024 & 2032
- Figure 21: Europe Pharma Pricing Research Tools Market Revenue Share (%), by Application 2024 & 2032
- Figure 22: Europe Pharma Pricing Research Tools Market Revenue (Million), by Type 2024 & 2032
- Figure 23: Europe Pharma Pricing Research Tools Market Revenue Share (%), by Type 2024 & 2032
- Figure 24: Europe Pharma Pricing Research Tools Market Revenue (Million), by Country 2024 & 2032
- Figure 25: Europe Pharma Pricing Research Tools Market Revenue Share (%), by Country 2024 & 2032
- Figure 26: Rest of the World Pharma Pricing Research Tools Market Revenue (Million), by Application 2024 & 2032
- Figure 27: Rest of the World Pharma Pricing Research Tools Market Revenue Share (%), by Application 2024 & 2032
- Figure 28: Rest of the World Pharma Pricing Research Tools Market Revenue (Million), by Type 2024 & 2032
- Figure 29: Rest of the World Pharma Pricing Research Tools Market Revenue Share (%), by Type 2024 & 2032
- Figure 30: Rest of the World Pharma Pricing Research Tools Market Revenue (Million), by Country 2024 & 2032
- Figure 31: Rest of the World Pharma Pricing Research Tools Market Revenue Share (%), by Country 2024 & 2032
List of Tables
- Table 1: Global Pharma Pricing Research Tools Market Revenue Million Forecast, by Region 2019 & 2032
- Table 2: Global Pharma Pricing Research Tools Market Revenue Million Forecast, by Application 2019 & 2032
- Table 3: Global Pharma Pricing Research Tools Market Revenue Million Forecast, by Type 2019 & 2032
- Table 4: Global Pharma Pricing Research Tools Market Revenue Million Forecast, by Region 2019 & 2032
- Table 5: Global Pharma Pricing Research Tools Market Revenue Million Forecast, by Country 2019 & 2032
- Table 6: United States Pharma Pricing Research Tools Market Revenue (Million) Forecast, by Application 2019 & 2032
- Table 7: Canada Pharma Pricing Research Tools Market Revenue (Million) Forecast, by Application 2019 & 2032
- Table 8: Mexico Pharma Pricing Research Tools Market Revenue (Million) Forecast, by Application 2019 & 2032
- Table 9: Global Pharma Pricing Research Tools Market Revenue Million Forecast, by Country 2019 & 2032
- Table 10: Germany Pharma Pricing Research Tools Market Revenue (Million) Forecast, by Application 2019 & 2032
- Table 11: United Kingdom Pharma Pricing Research Tools Market Revenue (Million) Forecast, by Application 2019 & 2032
- Table 12: France Pharma Pricing Research Tools Market Revenue (Million) Forecast, by Application 2019 & 2032
- Table 13: Spain Pharma Pricing Research Tools Market Revenue (Million) Forecast, by Application 2019 & 2032
- Table 14: Italy Pharma Pricing Research Tools Market Revenue (Million) Forecast, by Application 2019 & 2032
- Table 15: Spain Pharma Pricing Research Tools Market Revenue (Million) Forecast, by Application 2019 & 2032
- Table 16: Belgium Pharma Pricing Research Tools Market Revenue (Million) Forecast, by Application 2019 & 2032
- Table 17: Netherland Pharma Pricing Research Tools Market Revenue (Million) Forecast, by Application 2019 & 2032
- Table 18: Nordics Pharma Pricing Research Tools Market Revenue (Million) Forecast, by Application 2019 & 2032
- Table 19: Rest of Europe Pharma Pricing Research Tools Market Revenue (Million) Forecast, by Application 2019 & 2032
- Table 20: Global Pharma Pricing Research Tools Market Revenue Million Forecast, by Country 2019 & 2032
- Table 21: China Pharma Pricing Research Tools Market Revenue (Million) Forecast, by Application 2019 & 2032
- Table 22: Japan Pharma Pricing Research Tools Market Revenue (Million) Forecast, by Application 2019 & 2032
- Table 23: India Pharma Pricing Research Tools Market Revenue (Million) Forecast, by Application 2019 & 2032
- Table 24: South Korea Pharma Pricing Research Tools Market Revenue (Million) Forecast, by Application 2019 & 2032
- Table 25: Southeast Asia Pharma Pricing Research Tools Market Revenue (Million) Forecast, by Application 2019 & 2032
- Table 26: Australia Pharma Pricing Research Tools Market Revenue (Million) Forecast, by Application 2019 & 2032
- Table 27: Indonesia Pharma Pricing Research Tools Market Revenue (Million) Forecast, by Application 2019 & 2032
- Table 28: Phillipes Pharma Pricing Research Tools Market Revenue (Million) Forecast, by Application 2019 & 2032
- Table 29: Singapore Pharma Pricing Research Tools Market Revenue (Million) Forecast, by Application 2019 & 2032
- Table 30: Thailandc Pharma Pricing Research Tools Market Revenue (Million) Forecast, by Application 2019 & 2032
- Table 31: Rest of Asia Pacific Pharma Pricing Research Tools Market Revenue (Million) Forecast, by Application 2019 & 2032
- Table 32: Global Pharma Pricing Research Tools Market Revenue Million Forecast, by Country 2019 & 2032
- Table 33: Brazil Pharma Pricing Research Tools Market Revenue (Million) Forecast, by Application 2019 & 2032
- Table 34: Argentina Pharma Pricing Research Tools Market Revenue (Million) Forecast, by Application 2019 & 2032
- Table 35: Peru Pharma Pricing Research Tools Market Revenue (Million) Forecast, by Application 2019 & 2032
- Table 36: Chile Pharma Pricing Research Tools Market Revenue (Million) Forecast, by Application 2019 & 2032
- Table 37: Colombia Pharma Pricing Research Tools Market Revenue (Million) Forecast, by Application 2019 & 2032
- Table 38: Ecuador Pharma Pricing Research Tools Market Revenue (Million) Forecast, by Application 2019 & 2032
- Table 39: Venezuela Pharma Pricing Research Tools Market Revenue (Million) Forecast, by Application 2019 & 2032
- Table 40: Rest of South America Pharma Pricing Research Tools Market Revenue (Million) Forecast, by Application 2019 & 2032
- Table 41: Global Pharma Pricing Research Tools Market Revenue Million Forecast, by Country 2019 & 2032
- Table 42: United States Pharma Pricing Research Tools Market Revenue (Million) Forecast, by Application 2019 & 2032
- Table 43: Canada Pharma Pricing Research Tools Market Revenue (Million) Forecast, by Application 2019 & 2032
- Table 44: Mexico Pharma Pricing Research Tools Market Revenue (Million) Forecast, by Application 2019 & 2032
- Table 45: Global Pharma Pricing Research Tools Market Revenue Million Forecast, by Country 2019 & 2032
- Table 46: United Arab Emirates Pharma Pricing Research Tools Market Revenue (Million) Forecast, by Application 2019 & 2032
- Table 47: Saudi Arabia Pharma Pricing Research Tools Market Revenue (Million) Forecast, by Application 2019 & 2032
- Table 48: South Africa Pharma Pricing Research Tools Market Revenue (Million) Forecast, by Application 2019 & 2032
- Table 49: Rest of Middle East and Africa Pharma Pricing Research Tools Market Revenue (Million) Forecast, by Application 2019 & 2032
- Table 50: Global Pharma Pricing Research Tools Market Revenue Million Forecast, by Application 2019 & 2032
- Table 51: Global Pharma Pricing Research Tools Market Revenue Million Forecast, by Type 2019 & 2032
- Table 52: Global Pharma Pricing Research Tools Market Revenue Million Forecast, by Country 2019 & 2032
- Table 53: United States Pharma Pricing Research Tools Market Revenue (Million) Forecast, by Application 2019 & 2032
- Table 54: Canada Pharma Pricing Research Tools Market Revenue (Million) Forecast, by Application 2019 & 2032
- Table 55: Mexico Pharma Pricing Research Tools Market Revenue (Million) Forecast, by Application 2019 & 2032
- Table 56: Global Pharma Pricing Research Tools Market Revenue Million Forecast, by Application 2019 & 2032
- Table 57: Global Pharma Pricing Research Tools Market Revenue Million Forecast, by Type 2019 & 2032
- Table 58: Global Pharma Pricing Research Tools Market Revenue Million Forecast, by Country 2019 & 2032
- Table 59: Germany Pharma Pricing Research Tools Market Revenue (Million) Forecast, by Application 2019 & 2032
- Table 60: United Kingdom Pharma Pricing Research Tools Market Revenue (Million) Forecast, by Application 2019 & 2032
- Table 61: France Pharma Pricing Research Tools Market Revenue (Million) Forecast, by Application 2019 & 2032
- Table 62: Italy Pharma Pricing Research Tools Market Revenue (Million) Forecast, by Application 2019 & 2032
- Table 63: Spain Pharma Pricing Research Tools Market Revenue (Million) Forecast, by Application 2019 & 2032
- Table 64: Rest of Europe Pharma Pricing Research Tools Market Revenue (Million) Forecast, by Application 2019 & 2032
- Table 65: Global Pharma Pricing Research Tools Market Revenue Million Forecast, by Application 2019 & 2032
- Table 66: Global Pharma Pricing Research Tools Market Revenue Million Forecast, by Type 2019 & 2032
- Table 67: Global Pharma Pricing Research Tools Market Revenue Million Forecast, by Country 2019 & 2032
Frequently Asked Questions
1. What is the projected Compound Annual Growth Rate (CAGR) of the Pharma Pricing Research Tools Market?
The projected CAGR is approximately 4.80%.
2. Which companies are prominent players in the Pharma Pricing Research Tools Market?
Key companies in the market include phamax, Clarivate Anlaytics, IQVIA, Elsevier*List Not Exhaustive, Inpharmation, Wolters Kluwer N V, Veeva Systems, Avalere Health LLC.
3. What are the main segments of the Pharma Pricing Research Tools Market?
The market segments include Application, Type.
4. Can you provide details about the market size?
The market size is estimated to be USD 1.64 Million as of 2022.
5. What are some drivers contributing to market growth?
Increasing Complexity of Pharmaceutical Pricing; Rising Demand for Pricing Research & Analytics in Healthcare.
6. What are the notable trends driving market growth?
The Over-the-Counter Segment is Expected to Show Healthy Growth Over the Forecast Period.
7. Are there any restraints impacting market growth?
Lack of Standardization in Underdeveloped Countries.
8. Can you provide examples of recent developments in the market?
N/A
9. What pricing options are available for accessing the report?
Pricing options include single-user, multi-user, and enterprise licenses priced at USD 4750, USD 5250, and USD 8750 respectively.
10. Is the market size provided in terms of value or volume?
The market size is provided in terms of value, measured in Million.
11. Are there any specific market keywords associated with the report?
Yes, the market keyword associated with the report is "Pharma Pricing Research Tools Market," which aids in identifying and referencing the specific market segment covered.
12. How do I determine which pricing option suits my needs best?
The pricing options vary based on user requirements and access needs. Individual users may opt for single-user licenses, while businesses requiring broader access may choose multi-user or enterprise licenses for cost-effective access to the report.
13. Are there any additional resources or data provided in the Pharma Pricing Research Tools Market report?
While the report offers comprehensive insights, it's advisable to review the specific contents or supplementary materials provided to ascertain if additional resources or data are available.
14. How can I stay updated on further developments or reports in the Pharma Pricing Research Tools Market?
To stay informed about further developments, trends, and reports in the Pharma Pricing Research Tools Market, consider subscribing to industry newsletters, following relevant companies and organizations, or regularly checking reputable industry news sources and publications.
Methodology
Step 1 - Identification of Relevant Samples Size from Population Database


Step 2 - Approaches for Defining Global Market Size (Value, Volume* & Price*)

Note*: In applicable scenarios
Step 3 - Data Sources
Primary Research
- Web Analytics
- Survey Reports
- Research Institute
- Latest Research Reports
- Opinion Leaders
Secondary Research
- Annual Reports
- White Paper
- Latest Press Release
- Industry Association
- Paid Database
- Investor Presentations

Step 4 - Data Triangulation
Involves using different sources of information in order to increase the validity of a study
These sources are likely to be stakeholders in a program - participants, other researchers, program staff, other community members, and so on.
Then we put all data in single framework & apply various statistical tools to find out the dynamic on the market.
During the analysis stage, feedback from the stakeholder groups would be compared to determine areas of agreement as well as areas of divergence
